Introduction
Tumor cells are often marked by a variety of genomic diversity and aberrations. These alterations can cause changes in genome structure or gene function, leading to the activation of oncogenes and suppression of tumor suppressor genes, ultimately contributing to malignant growth and cancer progression1. Characterizing these genomic alterations is crucial for understanding tumor development and guiding the design of targeted therapeutic strategies2,3. CTCs, which are shed from both primary and metastatic tumors into the bloodstream or lymphatic system, offer a unique and non-invasive resource for studying tumor biology4,5. CTCs retain the genetic and molecular profiles of their originating tumors, offering comprehensive insights into genomic features and mutation landscapes6,7,8. Consequently, CTCs play a pivotal role in real-time monitoring of tumor dynamics, assessing therapeutic responses, and facilitating the early detection of cancer, thereby demonstrating significant clinical potential for improving patient management and outcomes9,10. Currently, there is no method capable of comprehensively detecting complex genomic alterations such as structural variants11,12, extrachromosomal DNA (ecDNA)13,14, and homogenously staining regions (HSRs)15 in individual CTCs because of the absence of suitable single-cell detection technologies. This limitation significantly hinders their potential use in optimizing treatment strategies and monitoring prognosis.
A variety of single-cell genomic amplification technologies, including strand-displacing DNA polymerase-based multiple displacement amplification (MDA)16, multiple annealing and looping-based amplification cycles (MALBAC)17, transposase-based multiplexed end-tagging amplification (META)18,19, and primary template-directed amplification (PTA)20, have been developed to address these challenges. These technologies have considerably improved the uniformity, precision, and coverage of single-cell amplification, making them suitable for detecting single nucleotide polymorphisms (SNPs), insertions and deletions (INDELs), and copy number variations (CNVs). However, these methods primarily capture two-dimensional linear genomic information and are inadequate for detecting large-scale genomic structural variants. Additionally, the lack of insight into three-dimensional chromosomal structures restricts these techniques from understanding the impact of genomic structural abnormalities on the three-dimensional organization and transcriptional regulation of the genome.
Hi-C has emerged as a powerful tool for detecting the spatial organization and structural variants of the genome in large cell populations21,22. To achieve high-resolution analysis of chromatin spatial structure at the single-cell level, several advanced single-cell Hi-C methodologies have been developed based on the original Hi-C technique23,24. These include single-cell Hi-C (scHi-C)25, single-nucleus Hi-C (snHi-C)26, diploid cell chromatin conformation capture (Dip-C)18, single-cell indexed DLO Hi-C (sciDLO Hi-C)27, and Hi-C combined with RNA-seq (HiRES)28. Among them, scHi-C, which employs Tn5 transposase-based amplification29, enables the detection of chromatin interaction differences across distinct cell cycle stages at single-cell resolution. In contrast, snHi-C, utilizing MDA16, reveals unique chromatin reorganization during the oocyte-to-zygote transition. Furthermore, Dip-C, leveraging META18,19 and specific algorithms, can distinguish chromatin interaction differences between parental haplotypes. sciDLO Hi-C, through a split-pool strategy30, assigns unique barcodes to each single cell, allowing high-throughput capture of chromatin spatial structures at the single-cell level. Finally, the HiRES integrates Hi-C with RNA-seq using MALBAC17, enabling simultaneous analysis of chromatin interactions and gene expression, thereby providing a comprehensive view of the genomic and transcriptional landscapes of individual cells. These advancements in Hi-C technologies have greatly enhanced the ability to investigate chromatin interactions and genome structure at single-cell resolution, offering critical insights into the mechanisms of gene regulation.
To further enhance the capacity to decode chromatin spatial structure at the single-cell level and improve genome coverage and uniformity, thereby enabling the detection of diverse types of genomic alterations, this study introduces the Uni-C. Through optimizing the experimental workflow and refining the single-cell amplification method, we achieved a substantial improvement in genomic coverage while effectively reducing background noise. This methodological advancement enables the precise identification of a wide spectrum of genomic alterations, alongside comprehensive characterization of the spatial organization of chromatin at the single-cell level.
Utilizing Uni-C, we systematically dissected a wide range of genomic alterations within CTCs from pancreatic cancer, which are largely consistent with those observed in tumor tissues. Notably, we discovered that a subset of CTCs harbored ecDNA, a significant form of structural variation that plays a crucial role in drug resistance and cellular proliferation13. At the single-cell level, we successfully resolved the molecular structure of ecDNA. Additionally, chromatin conformation insights revealed variations in chromatin folding and A/B compartmentalization across CTCs in different mitotic phases. Importantly, by integrating information on genomic alterations, we predicted neoantigens in CTCs and validated that these neoantigens significantly inhibit tumor cell proliferation in vivo. Our findings provide valuable insights for advancing single-cell transcriptional regulation research and may contribute to improving early cancer diagnosis, treatment strategies, and prognosis monitoring.
Results
Overview of Uni-C
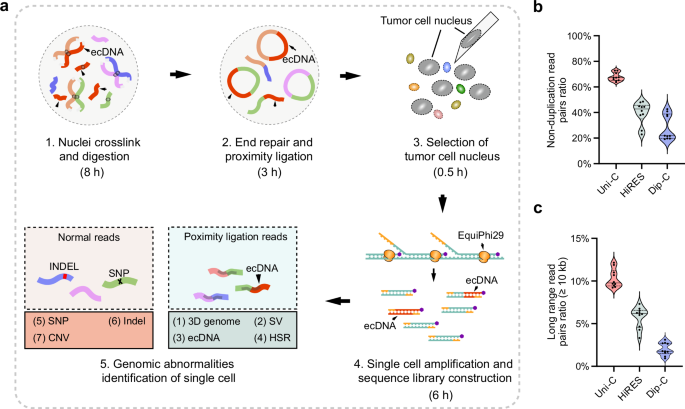
To preserve the stability of chromatin spatial conformation throughout the process, we first employed ethylene glycol bis (succinimidyl succinate) (EGS)21,31 and formaldehyde for dual crosslinking of the cells, followed by cell lysis (step 1, Fig. 1a). To prevent nuclei aggregation during centrifugation, we excluded all centrifugation steps in later experimental stages. Chromatin fragmentation was achieved using a 4-base cutter restriction endonuclease, followed by end-repair and proximity ligation within the same reaction mixture (step 1 and 2, Fig. 1a). Following proximity ligation, individual nuclei were transferred into an alkaline lysis buffer using a glass capillary, setting the foundation for subsequent single-nucleus amplification (step 3, Fig. 1a).

a Experimental workflow for Uni-C. Cells are subjected to dual crosslinking with formaldehyde and EGS, followed by cell membrane lysis to release the nuclei. Then, the nuclei are fragmented via a 4-base pair cutter restriction enzyme, and the fragments are processed via end-repair by Klenow (exo + ) polymerase and proximity ligation by T4 DNA ligase. After ligation, the tumor cell nuclei are transferred into an alkaline lysis solution using glass micropipettes, followed by single-cell amplification in a mixture containing EquiPhi29, dNTPs, and thiol-modified ddNTPs. The amplified products were then size-selected and used to construct a sequencing library for high-throughput sequencing. This process allows for the comprehensive detection of various genomic anomalies through the combined analysis of whole-genome sequencing and three-dimensional genome structural data. b Comparison of the no-duplication read pairs ratio among Uni-C, HiRES, and Dip-C (n = 10 cells per method). The ratio of non-duplicated read pairs is defined as the percentage of read pairs that are non-redundant within the total raw read pairs. In both panels, each dot represents a single-cell library. Solid horizontal lines indicate the medians, and dashed lines indicate the 25th and 75th percentiles. c Comparison of the ratio of intra-chromosomal long-range interaction read pairs between Uni-C, HiRES, and Dip-C (n = 10 cells per method). The intra-chromosomal long-range interaction read pairs ratio refers to the percentage of read pairs within the same chromosome that interact over distances greater than 10 kb within the total raw read pairs. Solid horizontal lines indicate the medians, and dashed lines indicate the 25th and 75th percentiles. Source data are provided as a Source Data file.
For single-nucleus amplification, we employed heat-stable phi29 DNA polymerase32 along with a mixture of dNTPs and α-thiol-modified ddNTPs, and exonuclease-resistant random primers. The incorporation of α-thiol-modified ddNTPs during the amplification process effectively terminated extension, thereby controlling the size of the amplified products to under 2 kb. This size limitation reduces the likelihood of random primer rebinding, ensuring that only the original single-cell genome serves as the template for amplification, thus preventing over-amplification of specific genomic regions. This approach enabled uniform whole-genome amplification, significantly improving genome coverage20. Moreover, the use of the fast, heat-resistant phi29 polymerase reduced the amplification time to approximately 2 h. The amplified products were then subjected to size selection, followed by the preparation of libraries for high-throughput sequencing to facilitate downstream analysis (step 4, Fig. 1a).
The sequencing data obtained provided two key types of information: chromatin three-dimensional interaction data and whole-genome sequencing data33. The chromatin interaction data were used to construct a genome-wide interaction matrix, aiding in the identification of structural variants and the analysis of single-cell transcriptional regulation. The whole-genome sequencing data allowed for the accurate detection of SNPs, INDELs, and CNVs at the single-nucleus level. Integration of these datasets enabled the identification and classification of structural variants at the single-nucleus level and facilitated the detection of various genomic diversity and aberrations, including ecDNA and HSRs, providing insights into the genomic landscape of tumor cells (step 5, Fig. 1a).
We selected 10 GM12878 nuclei to construct the Uni-C library and assessed the efficiency of chromatin conformation capture by comparison with well-established methods like Dip-C and HiRES18,28. Key indicators, including the no-duplication read pairs ratio and the long-range read pairs ratio (≥10 kb), were assessed. Optimization efforts resulted in an increased proportion of no-duplication read pairs among the total read pairs to 67.8% (Fig. 1b). Furthermore, the percentage of long-range read pairs (≥ 10 kb), which are essential for analyzing structural variants and transcriptional regulation, was also enhanced to 10.3% of the total read pairs (Fig. 1c). Comparative analysis of chromatin interaction matrices generated by Uni-C, Dip-C, and HiRES indicated that Uni-C captured more long-range chromosomal interactions at a 25 kb resolution (Supplementary Fig. 1).
Uni-C can efficiently identify SNPs and INDELs at the single-cell level
To evaluate the performance of Uni-C, we assessed the genomic coverage and sequencing depth of the Uni-C sequencing dataset. With an average of 224.4 million raw paired-end reads (PE150) per cell, we achieved an average sequencing depth of 14.6× and a genomic coverage of 86.4% across individual cells (Fig. 2a). We then used the HaplotypeCaller tool from the Genome Analysis ToolKit34 (GATK) to identify SNPs and INDELs in each cell. To mitigate the potential false positive inherent in single-cell amplification, we applied various filtering criteria and compared their effects at different thresholds. In GM12878 cells, using a threshold of detecting variants in at least two cells as candidate SNPs/INDELs effectively removed false positives while retaining 89.4% of true positives (Supplementary Fig. 2a, b). However, increasing the threshold resulted in a significant decrease in true positives (Supplementary Fig. 2c, d). Therefore, for SNP and INDEL detection, we defined variants detected in at least two cells as candidate SNPs/INDELs, and classified those found in only one cell as low-confidence SNPs/INDELs (Fig. 2b). After the filtering process, Uni-C identified 4,127,543 high-confidence variants across the 10 GM12878 cells (Fig. 2c, d). The overall true positive rate increased from 32.6% (pre-filtering) to 81.7% (post-filtering), while the false positive rate decreased from 67.4% to 18.3%, and the estimated false negative rate was 5.4% (Fig. 2c, d, Supplementary Fig. 3a, b). The filtering step substantially enhances the reliability of Uni-C by improving the true positive rate and reducing false positives.

a Comparison of sequencing depth and genome coverage for each GM12878 cell in the Uni-C and Dip-C datasets, with 10 cells selected from each. b Filtering criteria for low-confidence single-cell SNPs and INDELs. Variants appearing in two or more single cells are considered candidate mutations, whereas those appearing in only one cell are regarded as low-confidence candidates and therefore are excluded. c Overlap of SNPs and INDELs detected in 10 GM12878 Uni-C libraries with those detected in bulk GM12878 cells before filtering. SNPs/INDELs that were detected in both the single-cell and bulk datasets were classified as true positives, while those found exclusively in the single-cell data were deemed false positives. d Overlap of SNPs and INDELs detected in 10 GM12878 Uni-C libraries with those detected in bulk GM12878 cells after filtering. e Number of SNPs and INDELs detected in each Uni-C library and bulk cells. f Bulk mutation spectrum derived from a large population of GM12878 cells (no biological replicates applicable). g Mutation spectrum across n = 10 single GM12878 cells (independent biological replicates). Each colored segment of the bars represents the mean relative contribution of a specific mutation type to the total mutation count. Error bars indicate standard deviation (SD), and dots represent individual cells. Data are presented as mean ± SD. h, i Ninety-six mutation profiles on chromosome 1 in GM12878 bulk cells and single cells. The height indicates the relative frequency of each mutation type. j, k Indel spectra across GM12878 bulk cells and single cells. The histograms display the distribution of various indel types, categorized by the principal type of deletion or insertion and further by the number of repeat units or the length of microhomology. The x-axis represents the number of repeat units for multi-base indels and the microhomology length for microhomology deletions. Source data are provided as a Source Data file.
At the single-cell level, an average of 1.82 million SNPs and 0.28 million INDELs were identified per GM12878 cell after filtering (Fig. 2e), with the per-cell true positive rate increasing from 64.9 to 86.2%, and the estimated false negative rate being 5.7% (Fig. 2e, Supplementary Fig. 3a, b). Notably, the patterns of base transitions identified by Uni-C across the 10 cells showed high consistency with those observed in bulk cells, with a predominant transition from cytosine (C) to thymine (T) (Fig. 2f, g). This consistency was also observed in the amino acid alterations resulting from base transitions, which closely mirrored those seen in bulk cell analyses (Fig. 2h, i). Further analysis of base insertions and deletions revealed a high degree of concordance between single-cell and bulk cell data, especially for thymine (T) base alterations (Fig. 2j, k, Supplementary Fig. 4). These findings support the reliability of Uni-C in accurately reflecting genomic dynamics that are representative of bulk cell populations. Given that tumor neoantigens often arise from minor coding region alterations like base mutations, deletions, and insertions, these findings suggest the potential clinical utility of Uni-C for early tumor diagnosis, neoantigen prediction, and therapeutic intervention.
Detection of structural variants and ecDNA in single tumor cells
To verify Uni-C’s capability in detecting genomic structural variants in single tumor cells, we selected the COLO320-DM cell line, a colorectal cancer cell line known to harbor various types of structural variants and ecDNA33, to construct six Uni-C single-cell libraries. Using single-cell chromatin interaction matrices and genomic CNV data, we employed EagleC35 to identify genomic structural variants in these cells. Since these structural variants detection tools were originally developed based on bulk-cell Hi-C data35,36,37, they may exhibit a high false-positive rate when applied to single-cell structural variant detection. To address this issue, we adopted a filtering strategy similar to that used for single-cell SNPs and INDELs detection. This strategy considers only those structural variants observed in at least two cells to be candidate structural variants (Fig. 3a, b). Additionally, several prominent structural variants, missed by the software but visually identifiable, were also classified as genuine. Ultimately, we identified 13 distinct structural variants across the six colorectal cancer single cells (Supplementary Table 1). Statistical analysis of structural variant detection rates in individual cells showed that Uni-C achieved an average detection rate of approximately 50.0% per cell, relative to the structural variants identified in the COLO320-DM bulk sample (Supplementary Fig. 5a). Through multi-cell integration analysis, a total of 81.3% of the structural variants present in the bulk sample were recovered across the six cells (Supplementary Fig. 5b).

a, b Structural variants detected in two or more cells are considered candidate structural variants, while those found in only one cell are treated as low-confidence structural variants and are filtered out. c–q Evaluating the concordance of structural variants identified in the single-cell Uni-C library with those found in bulk cells. For balanced translocations, the regions before and after the breakpoints did not exhibit a change in chromosomal copy number (c–e). In contrast, unbalanced translocations usually lead to a gain or loss in chromosomal copy number around the breakpoints (f–h). Inversions create a pair of symmetrical triangular shapes in the chromatin interaction heatmap without altering the chromosomal copy number (i–k). Duplications manifest as triangular patterns in the chromatin interaction heatmap and correspond with an increased chromosomal copy number (l–n). Lastly, deletions show up as upside-down triangular patterns in the chromatin interaction heatmap and align with a decreased chromosomal copy number (o–q).
Subsequently, we conducted a comparison between the structural variants found at the single-cell level and those detected in bulk cells (Fig. 3c–q). We successfully identified various intra- and inter-chromosomal structural variants and categorized based on CNV data, including balanced and unbalanced translocations between chromosomes, as well as inversions, duplications, and large deletions within chromosomes (Fig. 3c, f, i, l, o). These structural variants detected in single cells were consistent with those observed in bulk cells (Fig. 3d, g, j, m, p), underscoring the reliability of Uni-C in capturing true genomic structural variants at the single-cell level. To further evaluate the sensitivity of Uni-C, we assessed how the number of input cells affects the reliability of structural variant detection in COLO320-DM cells. Specifically, we randomly generated combinations of 1 to 6 cells from a set of six single cells and performed integrated structural variants analyses. After filtering, we found that combining at least four cells enabled the detection of 79.2% of the structural variants identified in the bulk COLO320-DM dataset (Supplementary Fig. 5b).
Furthermore, we compared the CNVs between the bulk COLO320-DM cells and single cells. Similarly, a high degree of consistency was observed between the two (Fig. 4a, b). In single cell 4 from the COLO320-DM cell line, the extent of the MYC focal amplification region were consistent with those found in the bulk cells (Fig. 4c, d). Further analysis of the interaction between the MYC gene amplification region and the whole genome at both the bulk and single-cell levels revealed significant interactions across the genome, indicating that the amplification region exhibits characteristics of ecDNA (Fig. 4e–j). Additionally, results from the genome-wide interaction fluctuation analysis (GWIFA)33 confirmed the identification of ecDNA as the form of amplification (Fig. 4g, j). These findings demonstrate that integrating Uni-C’s CNV data with chromatin interaction information enables accurate characterization of both the type and copy number of focal amplifications in single cells.

a, b Genome-wide copy number (CN) profiles of COLO320-DM bulk cells and a single cell (Cell 4), with chromosomes divided into 500 kb bins. The Y-axis represents the copy number for each bin size. c, d Amplification span and copy number gains of the MYC region in bulk and Uni-C single-cell data. e Chromatin interaction heatmap of COLO320-DM bulk cells. f Chromatin interaction heatmap focusing on the MYC amplification region in bulk cells, with the deepest color within the bin denoting a maximum contact count of 8. g Second-order backward difference (SOBD) values plotted across the genome for the focal amplification region (chr8:127,300,000–128,900,000) in COLO320-DM bulk cells using a bin size of 100 kb. h Chromatin interaction matrix for a single cell (Cell 4) using Uni-C data. i Chromatin interaction heatmap for the MYC amplification region in single-cell Uni-C data, where the most intense contact within the bin reaches a count of 4. j SOBD values mapped across the genome for the same focal amplification region in COLO320-DM single cells, also with a bin size of 100 kb.
Assessing Uni-C accuracy in a monoclonal cell line
To evaluate the accuracy of Uni-C in detecting SNPs and INDELs at the single-cell level, we isolated a single MC38 cell, cultured it to establish a monoclonal cell line, and performed Uni-C analysis (Supplementary Fig. 6a). We constructed eight Uni-C libraries, each from a single cell isolated from the monoclonal MC38 cell line, generating an average of 245.6 million raw paired-end 150 bp reads (PE150) per cell. For SNPs and INDELs detection, Uni-C identified 507,286 high-confidence variants after data integration and filtering (Supplementary Fig. 6b). Following the filtering process, the average true positive rate per cell increased from 36.8 to 80.7%, with a false negative rate of 1.9% on average (Supplementary Fig. 6c, d).
Furthermore, we compared Uni-C and PTA in terms of genome coverage as well as SNPs and INDELs detection. Across a range of sequencing depths, Uni-C consistently achieved slightly higher genome coverage than PTA, surpassing 85.6% at a sequencing depth of 200 million raw read pairs (Supplementary Fig. 7a). In SNPs and INDELs detection, Uni-C identified approximately 197,401 SNPs and 19,227 INDELs, marginally exceeding PTA, which detected 182,562 SNPs and 15,399 INDELs (Supplementary Fig. 7b). Analysis of random base substitution patterns showed that Uni-C’s mutation spectrum was more similar to that of the bulk sample than to PTA (Supplementary Fig. 7c). Pearson correlation analysis further confirmed that Uni-C had a slightly higher similarity to bulk variants than PTA (Supplementary Fig. 7d). These results demonstrate that Uni-C performs comparably to PTA, with certain improvements in genome coverage and single-nucleotide variant detection at the single-cell level.
Investigating genomic alterations in CTCs
To assess the potential clinical application of Uni-C, we selected two spontaneously tumorigenic KPC (Pdx1creKrasLSL-G12D/+-Trp53LSL-R172H/+) mouse models, KPC0402 and KPC0403, along with a pancreatic cancer patient-derived xenograft (PDX) mouse, PanT24. We collected CTCs from peripheral blood using anti-CD45 magnetic beads for negative enrichment, and constructed 19 Uni-C single-cell libraries (Fig. 5a). We investigated genomic alterations in CTCs and constructed a high-coverage genomic profile through multi-cell integration analysis, with a genomic coverage of 97.3% (Supplementary Fig. 8a, b).

a Schematic of CTC isolation via negative selection with anti-CD45 magnetic beads. b Copy number amplifications of the Nfib gene across various CTCs from the KPC0402 sample, the y-axis represents the copy number and the x-axis in 5 kb bins. c–e Chromatin interaction heatmap of KPC0402-Cell 6, with GWIFA indicating the type of focal amplification of the Nfib oncogene as ecDNA. f Reconstruction of the molecular structure of ecDNA in the KPC0402-Cell 6 cells using whole-genome sequencing information and split reads from the Uni-C dataset. g Copy number amplifications of the MYC gene across various CTCs in the KPC0402 sample. h–j Chromatin interaction heatmap of KPC0402-Cell 6, with GWIFA identifying the type of focal amplification of the MYC as HSR. k Chromatin interaction heatmap between chromosome 8 and chromosome 16 in the PanT24-Cell 5. l–o Validation of the type and location of MYC amplification in PanT24 cells by DNA FISH. Scale bar, 5 µm. The red signal indicates MYC and the green signal represents the centromere of chromosome 8 (l, m) and chromosome 16 (n, o). Images are representative of three independent experiments with similar results.
We adopted a filtering strategy similar to that used for single-cell SNPs and INDELs detection in GM12878. In the analysis of seven CTCs from the PanT24 mouse, a total of 3,826,380 SNPs and INDELs were identified through multi-cell integration analysis. These variants covered 88.7% of the SNPs and INDELs detected in the tumor tissue (Supplementary Fig. 9a). Meanwhile, in individual CTCs, Uni-C achieved a true positive rate of 80.7% for SNPs and INDELs after filtering, with an average false negative rate of 6.7% (Supplementary Fig. 9b, c).
Integrated analysis of seven CTCs revealed that Uni-C identified 12 structural variants (Supplementary Fig. 9d). Representative intra- and interchromosomal structural variants in single cells are shown in Supplementary Fig. 9e, f. Across these CTCs, 75.0% of the tumor tissue structural variants were detected, and each CTC identified approximately 59.8% on average (Supplementary Fig. 9g). Furthermore, we assessed how the number of input cells influences structural variant detection. After filtering, we found that combining at least three cells enabled the detection of 74.8% of the structural variants present in the tumor tissue, with minimal statistical variation (Supplementary Fig. 9h).
Investigating focal amplification of oncogenes in CTCs
However, unlike CTCs from the PanT24 mouse, no significant structural variants were identified in the CTCs from the two KPC mice. Interestingly, among six CTCs from the KPC0402 mouse, one cell presented a notable focal amplification of the Nfib oncogene38 (Fig. 5b). Further analysis using GWIFA confirmed that this amplification was in the form of ecDNA (Fig. 5c–e). The amplified region was reconstructed into a complete circular ecDNA structure using split reads from the Uni-C dataset, marking the resolution of the three-dimensional molecular structure of ecDNA at the single-cell level (Fig. 5f).
In the analysis of seven CTCs from the PanT24 mouse, focal amplification of the MYC gene region was observed both in all single cells and tumor tissue, with each containing approximately 40 copies (Fig. 5g). GWIFA analysis indicated that MYC amplifications occurred in the form of HSRs (Fig. 5h–j, Supplementary Fig. 10a–d), and the amplified region showed strong interactions with chromosome 16, suggesting a potential translocation of the MYC amplification region to this chromosome (Fig. 5k). To validate these findings, fluorescent in situ hybridization (FISH) was conducted using centromeric probes for chromosomes 8 and 16, along with a MYC probe. The results confirmed that the MYC gene was indeed amplified intrachromosomally in the form of HSRs and located specifically to chromosome 16 (Fig. 5l–o).
Analysis of chromatin structures in CTCs across cell cycle phases
During the analysis of the three-dimensional chromatin structures of CTCs, an interesting observation was made in one of the CTCs from the PanT24 mouse, specifically in PanT24-Cell 2. The chromatin interaction matrix revealed significant interaction between the long and short arms of the chromosomes, suggesting potential spatial interactions between the two sister chromatids. Additionally, when the interaction matrix was examined more closely, no topologically associating domains (TADs) or other higher-order chromatin conformations were visible, which is a characteristic typically observed in cells during mitosis (Fig. 6a), suggesting that this particular cell was in the mitotic phase25,39. In contrast, other interphase CTCs displayed well-defined chromatin higher-order structures in the chromatin interaction matrix (Fig. 6b). Moreover, compared to other CTCs, the mitotic CTC exhibited stronger interactions within the B-B compartment, indicating suppressed gene transcription activity (Fig. 6c, d). Further analysis of the global-scale differences in chromatin A/B compartments between mitotic and interphase cells revealed that chromosomes in mitosis lacked the alternating A/B compartment pattern seen in interphase cells, with most regions being localized to the B compartment (Fig. 6e and Supplementary Fig. 11), further illustrating the reduced transcriptional activity in mitotic cells.

a, b Interaction heatmaps of chromatin within CTCs at 1 Mb, 500 Kb, and 100 Kb resolutions, during the mitotic and interphase stages, respectively. c, d Saddle plots of genome-wide interaction maps for mitotic and interphase CTCs. The saddle plots were constructed by sorting the interaction matrix according to the eigenvector values from the lowest (B) to the highest (A) values. The sorted maps were then normalized to their expected interaction frequencies. The upper left of the interaction matrix indicates the strongest B-B interactions, the lower right shows the strongest A-A interactions, and the upper right and lower left quadrants represent B-A and A-B interactions, respectively. The saddle plots were quantified by taking the top 20% of B-B interactions and the top 20% of A-A interactions, normalized by the bottom 20% of A-B interactions. e Distribution of A/B compartments in mitotic and interphase CTCs, with the y-axis representing eigenvectors. Values greater than zero denote the A compartment and values less than zero denote the B compartment. The resolution on the x-axis is 100 kb. Simulated three-dimensional chromatin structures, with (f) and (g) representing the nuclear structure of a cell in mitosis, including the spatial organization of individual chromosomes, and (h) and (i) depicting the chromatin spatial structure during interphase. Source data are provided as a Source Data file.
Subsequently, we simulated the spatial chromatin structures of single cells in both mitotic and interphase stages based on chromatin interaction data. We observed that chromosomes in mitotic cells appeared more compact, with clear delineation and condensation (Fig. 6f, g). In contrast, nuclei from cells in interphase exhibited a less defined organization, with no distinct boundaries between different chromatin regions, and the structure of each chromosome was more relaxed (Fig. 6h, i).
Detection of genetic mutations and prediction of neoantigens in CTCs
We detected SNPs and INDELs in 19 CTCs using HaplotypeCaller and annotated the variants with VEP40, followed by statistical analysis using Maftools41 (Supplementary Fig. 12a–l). In the CTCs derived from the PDX model, an average of 6877 variants per cell that are likely to affect protein function were identified (Supplementary Fig. 12a). The majority of these variants were missense mutations (Supplementary Fig. 12b), with single nucleotide variant (SNV) types mainly comprising transitions from T to C and C to T (Supplementary Fig. 12c). Notably, genes associated with tumor proliferation and apoptosis, including MUC family genes MUC3A, MUC6, MUC16, and MUC442,43, exhibited a high mutation load, which may inform future therapeutic strategies (Supplementary Fig. 12d). Further analysis of the genomic variations in CTCs derived from KPC mice revealed a significantly lower mutation burden, with an average of approximately 1000 variants per cell (Supplementary Fig. 12e, i). The types of mutations and SNV patterns were consistent across these three samples (Supplementary Fig. 12b, c, f, g, j, k). Frequent MUC4 mutations were also detected in CTCs from KPC0402 and KPC0403 mice (Supplementary Fig. 12h, l). Additionally, we analyzed mutations in key pancreatic cancer driver genes (BRCA1, BRCA2, KRAS, TP53)44,45 and mismatch repair (MMR) genes (MLH1, MSH6, PMS2)46 in both CTCs and tumor tissue which are critical for genomic stability (Supplementary Fig. 13a, b). Notably, mutations in these driver and MMR-related genes were consistently detected in both CTCs and tumor tissues. These results indicate that Uni-C-detected variants in CTCs reflect the genomic alterations in the corresponding tumor tissues.
Furthermore, we predicted neoantigens following the workflow outlined in Fig. 7a. Based on the variant information, we predicted potential neoantigens using pVACtools47, identifying 276 and 359 candidate neoantigens in CTCs from KPC0402 and KPC0403 mice, respectively (Supplementary Data 1 and 2). Since Uni-C does not provide RNA expression data, we selected transcriptomic data from 15 pancreatic cancer cell lines obtained from the Cancer Cell Line Encyclopedia (CCLE) database48 to assess the expression of genes associated with these predicted neoantigens (Supplementary Fig. 14a, b). We confirmed the expression of 41 neoantigens in KPC0402 and 44 in KPC0403, with 22 neoantigens common to both mouse strains (Fig. 7b and Supplementary Data 3 and 4). Subsequently, we revalidated these 22 shared neoantigens in the DNA Binary Alignment/Map (BAM) files from the Uni-C dataset and synthesized peptides for 10 of these neoantigens. Immunogenicity assays showed that five of these peptides stimulated the secretion of IFNγ by sorting CD8+ T cells isolated from mouse spleens, indicating their immunogenic potential (Fig. 7c, d, Supplementary Fig. 15). Following this, we pre-immunized mice with these five peptides and treated them with chloroquine (CQ), an autophagy inhibitor, to block the degradation of major histocompatibility complex class I (MHC-I) molecules by endogenous autophagy in pancreatic cancer49. Combination therapy with the neoantigen peptides and CQ led to reduced tumor volume and weight, indicating potential for therapeutic application (Fig. 7e–g).

a Workflow for predicting neoantigens. bThe number of predicted neoantigens in CTCs from KPC0402 and KPC0403 mice, and their shared neoantigens. c, d Percentages of IFNγ-secreting CD8⁺ T cells among total CD8⁺ T cells after co-culture with BMDCs followed by peptide stimulation. Data are presented as mean ± s.d. from n = 4 independent biological replicates, and analyzed using an unpaired two-tailed Student’s t test. Exact P values are shown in the figure. P values less than the detection limit (0.0001) are indicated as P < 0.0001. e Schematic of the experimental design for mouse immune experiments, with “qd.” indicating drug administration every 24 h. Tumor volume (f) and tumor weight (g) of subcutaneous tumors derived from KPC0402 and KPC0403 primary tumor cells in mice treated with neoantigen peptides. n = 7 mice per group (independent biological replicates). Data are presented as mean ± s.d., and analyzed using Tukey’s one-way ANOVA. P values < 0.05 were considered statistically significant. Exact P values are shown in the figure. P values less than the detection limit (0.0001) are indicated as P < 0.0001. Source data are provided as a Source Data file.
Discussion
In this study, we developed Uni-C, a genomic alterations, and chromatin spatial conformation capture technology. Uni-C simplifies experimental procedures, allowing single-cell sequencing library construction within 18 h. By incorporating an optimized single-cell amplification technique20 and unique data filtering steps, Uni-C achieves improved genomic coverage and reduces background noise in its datasets. These advancements enable more accurate detection of structural variants, SNP,s and INDELs, thereby enhancing the sensitivity and precision of genomic analyses at the single-cell level.
Our study identified a broad spectrum of structural variants in CTCs at the single-cell level, including complex genomic rearrangements and translocations. These alterations play a crucial role in tumor development and progression and hold promise as potential biomarkers for early cancer detection. Notably, the genomic alteration patterns detected in CTCs closely resembled those in tumor samples, underscoring the utility of Uni-C for single-cell multi-omics analysis enabling comprehensive characterization of genomic alterations in primary tumors.
A notable result in our study was the detection of ecDNA in a single CTC, along with the reconstruction of its molecular structure. This highlights the complexity and heterogeneity of ecDNA, likely driven by chromosomal instability or ongoing genomic alterations within the tumor14. Although ecDNA is present in only a subset of CTCs, it can drive tumor evolution by facilitating genetic changes that confer a selective advantage, potentially playing a significant role in tumor progression and metastasis50,51. The detection of ecDNA in CTCs using Uni-C advances our understanding of cancer genetics and offers a promising avenue for clinical diagnostics. It is worth noting that no filtering strategy was applied for ecDNA detection. The omission of filtering was justified by the unique characteristics of ecDNA as a focal amplification, which typically spans several megabases and exists at high copy numbers, often reaching dozens or even hundreds of copies. These distinct features make ecDNA readily detectable in CN plots and reduce the risk of it being inadvertently removed during filtering. Furthermore, to ensure the reliability of the detected focal amplifications, we validated their amplification type using GWIFA, confirming the authenticity of the identified ecDNA and strengthening the robustness of our findings.
Uni-C offers a effective approach to precisely identify the cell cycle stages of CTCs through features of their three-dimensional chromatin structure. This approach not only deepens our understanding of the relationship between higher-order chromatin conformations and gene expression in tumor cells across different cell cycle phases, but also allows for the assessment of CTC vitality. By enabling non-invasive monitoring of tumor cell activity directly from blood samples, it offers significant potential for real-time tracking of treatment responses and tumor recurrence, making it a valuable alternative to invasive biopsies. This capability further enhances the clinical applicability of Uni-C in personalized cancer management.
Furthermore, by analyzing single-cell genomic data from CTCs, we not only identified critical tumor-driving gene mutations but also predicted tumor neoantigens. The subsequent validation of these neoantigens in animal models demonstrated that early immunization could effectively inhibit tumor cell proliferation in vivo. These findings underscore the potential of Uni-C technology in both early cancer detection and therapeutic intervention, offering insights and strategies for future cancer therapies.
Uni-C has notable advantages, but its efficiency in detecting certain specific types of genomic alterations is slightly lower. Since Uni-C involves restriction enzyme fragmentation, it disrupts the circular structure of shorter extrachromosomal circular DNA (eccDNA)52, resulting in lower detection efficiency. Additionally, as Uni-C relies on second-generation short-read sequencing (Paired-End 150 bp sequencing), it may have limitations in identifying small-scale intrachromosomal structural variants and genomic abnormalities in large repetitive regions, such as microsatellites. Integrating long-read third-generation sequencing in the future could effectively address these challenges53. Moreover, existing software35,36,37 designed for analyzing structural variants from large numbers of cells may struggle to handle the inherent complexity of single-cell data. Therefore, specialized tools need to be developed in the future to effectively analyze Uni-C datasets. While Uni-C captures genomic information effectively, to confirm the expression of neoantigens in tumor cells, necessitates complementary transcriptomic data from the same type of cancer is needed. In cases where the cancer type is unknown, this limits the prediction of neoantigens in CTCs. To address this, we are upgrading Uni-C to amplify single-cell cDNA amplification as well, thereby achieving high-resolution co-detection of DNA and RNA in single cells. Currently, the related methods are still under optimization. Additionally, to achieve accurate detection of whole-genome variations, the sequencing depth of Uni-C single-cell libraries is relatively high, which limits its throughput. However, for cases where detailed analysis of genomic alterations is not required, Uni-C can utilize 96-well or 384-well plates combined with flow sorting to increase cell throughput.
The study of tumor heterogeneity has long been a major focus in cancer research. Previous studies have employed multi-region sequencing to explore intratumor heterogeneity in specific regions and the evolutionary history of tumors54,55. In addition, researchers have developed specialized CNV detection algorithms to investigate karyotype heterogeneity in both murine and human malignancies56. However, the filtering and thresholding method used in our study (classifying variants observed in two or more cells as true positives) may exclude extremely rare genomic abnormalities that exist in only a single cell. Therefore, when the initial cell count is too low, this method is not recommended for heterogeneity analysis. Nevertheless, our approach significantly reduces the long-standing issue of high false positive rates in single-cell genomic variant detection.
Overall, we introduced Uni-C, a genomic research tool. The application of this technology not only covers high-resolution detection of genomic abnormalities in CTCs but also extends to capturing high-order chromatin conformations, determining cell division phases, detecting driver genes, predicting neoantigens, and supporting early cancer treatment. It serves as an efficient tool for advancing both fundamental research and clinical applications.
Methods
Ethics statement
This study complies with all relevant ethical regulations for research involving human participants and animals. Ethical approval for all human studies was obtained from the Research Ethics Committee of Shanghai General Hospital, Shanghai, China (Approval No. 2020AW135). Written informed consent was obtained from all donors prior to sample collection. Ethical approval for all animal experiments was granted by the same committee (Approval No. 2023AW009), and experiments were conducted in accordance with institutional guidelines for the care and use of laboratory animals.
Patients and mice
Pancreatic cancer tissues were obtained from patients undergoing surgical resection at Shanghai General Hospital. Tissues were confirmed as tumor specimens based on pathological assessment.
Wild-type C57BL/6, Pdx1-cre, KrasLSL-G12D/+-Trp53LSL-R172H/+ (KP), NOD-SCID IL-2 receptor gamma null (NSG) mice aged 6–8 weeks were procured from Cyagen Biosciences (Suzhou, China) Inc. and housed in specific pathogen-free environments at the Laboratory Animal Services of Shanghai General Hospital under specific pathogen-free (SPF) conditions with 12-h light/dark cycles. Room temperature was maintained at 25 °C. The humidity level was controlled between 40-60%. Pdx1creKrasLSL-G12D/+-Trp53LSL-R172H/+ (KPC) mice were generated by crossing KP mice with Pdx1-cre mice.
Uni-C library construction
Cell fixation and permeabilization
Cells were fixed directly with 1% formaldehyde (Sigma-Aldrich, 47608-250ML-F) for 10 min with rotation at room temperature. The reaction was terminated with 0.2% BSA (Sigma-Aldrich, V900933) for 5 min. After washing twice with PBS (HyClone, SH30256.FS), cells were crosslinked with freshly made 3 mM EGS (Thermo Fisher Scientific, 21565) for 20 min with rotation at room temperature. Then, 0.25 M glycine (Sigma-Aldrich, 410225) was added to quench the reaction. Subsequently, the cells were washed twice with ice-cold Wash Buffer (10 mM Tris-HCl pH 8.0 (Sango Biotech, B548127), 10 mM NaCl (Sigma-Aldrich, S9888) and 0.1 mg/ml BSA). Fixed cells were then resuspended in ice-cold Hi-C Lysis Buffer (10 mM Tris-HCl pH 8.0, 10 mM NaCl, 0.2% NP40 (Sigma-Aldrich, 127087-87-0)) containing a protease inhibitor (Roche, 11836170001) and incubated on ice for 15 min. After centrifugation, cells were further permeabilized with 40 μl of 0.5% SDS (Sigma-Aldrich, 05030) at 65 °C for 10 min and then immediately placed on ice for 3 min.
In situ digestion: Added 20 μl of 10% Triton X-100 (Sigma-Aldrich, T8787) to the mixture which was subsequently incubated for 5 min to quench the SDS. The digestion mix (100 μl of ddH2O, 20 μl of 10× NEB buffer 2, 20 μl of MboI (NEB, R0147S, 20 units/μl)) was added to the reaction and incubated at 37 °C for 6 h.
End repairing and in situ proximity ligation
The reaction was incubated at 65 °C for 20 min to terminate digestion, and then cooled to room temperature. Added 81 μl of ddH2O, 10 μl of 10× NEB buffer 2, 3 μl of dNTPs (NEB, N0447S), and 6 μl of DNA polymerase I Klenow fragment (NEB, M0210) was added to the reaction system, and the sample was incubated the sample at 37 °C for 1 h. Ligation was performed by the addition of 270 μl of H2O, 50 μl of T4 ligase buffer, 50 μl of 10% Triton X-100, 5 μl of 2% BSA, and 25 μl of T4 DNA ligase (Thermo Fisher Scientific, EL0011), followed by incubation at room temperature for 2 h.
Single cell isolation and amplification
Individual nuclei were transferred with a glass micropipette into a 0.2 ml low-bind PCR tube (Axygen, PCR-02-L-C) containing 2 μl of Buffer L (100 mM KOH and 50 mM DTT (Sigma-Aldrich, D9779)) and were incubated at 72 °C for 10 min. Then, 2 μl of Buffer N (100 mM Tris-HCl, pH 7.0) was added, and the mixture was incubated in a thermomixer (Eppendorf) with rotation at 1000 rpm for 3 min to terminate lysis and neutralize the reaction. Next, 8.8 μl of ddH₂O, 0.5 μl of dNTPs (10 mM each), 1 μl of α-thiol-modified ddNTPs (10 mM each, Trilink), 2 μl of Exo-Resistant Random Primer (500 μM), 2 μl of EquiPhi29™ DNA Polymerase Reaction Buffer (10×), 0.2 μl of DTT (0.1 M), and 1 μl of EquiPhi29™ DNA Polymerase (Thermo Fisher Scientific, A39390) were added to the reaction and mixed thoroughly, followed by incubation at 45 °C for 2 h. The reaction was subsequently terminated by incubation at 65 °C for 10 min.
DNA size selection
Size selection of PCR products was performed using VAHTS DNA Clean Beads (Vazyme, N411). Briefly, to obtain PCR products with a fragment size of 300–400 bp, the amplified sample was first diluted with ddH₂O to a final volume of 100 μl. Then, 70 μl of DNA Clean Beads were added to the 100 μl sample to bind DNA fragments larger than 400 bp. The collected supernatant was then mixed with 20 μl of beads to capture the target DNA fragments, and the supernatant was removed. After washing twice with 80% ethanol (Sigma-Aldrich, E7023), 20 μl of ddH₂O was added to elute the DNA fragments bound to the magnetic beads.
Sequencing library construction
DNA sequencing libraries were prepared via the VAHTS Universal Plus DNA Library Prep Kit (Vazyme, NDM627) according to the manufacturer’s protocol.
PTA library construction
For single-cell amplification, PTA reactions were performed using ResolveOME Whole Genome Amplification Kit (BioSkryb, PN100136) according to the manufacturer’s protocol. In brief, single nuclei were sorted into wells containing 3 μl of pre-chilled Cell Buffer, then lysed on ice using MS Mix under alkaline conditions. The lysate was mixed at 1,400 r.p.m. and subsequently neutralized with SN1 buffer. Afterward, SDX buffer was added to the neutralized nuclei, followed by a brief incubation at room temperature. Reaction-Enzyme Mix was then introduced, and the amplification reaction proceeded at 30 °C for 10 h, followed by enzyme inactivation at 65 °C for 3 min. The PCR products were performed size selection using VAHTS DNA Clean Beads to obtain PCR products with a fragment size of 300–400 bp. DNA sequencing libraries were generated using the VAHTS Universal Plus DNA Library Prep Kit (Vazyme, NDM627) following the manufacturer’s instructions.
SNP and INDEL calling from Uni-C datasets
For SNP and INDEL detection, raw read pairs are initially processed using FASTP (version: 0.23.2) to remove residual sequencing adapter sequences. To mitigate background noise associated with Hi-C ligation junctions, we filtered out all read pairs that contain the MboI restriction site ligation junction “GATCGATC”. Subsequently, these filtered read pairs were aligned to the reference genome GRCh37 or GRCm38 via BWA (version: 0.7.17). The aligned BAM files are sorted with SAMTOOLS (version: 1.15.1), and duplicate reads are removed via SAMBAMBA (version: 0.6.6). Next, base quality scores are recalibrated using the BaseRecalibrator (from GATK, version 4.2.2), followed by the detection of SNPs and indels using HaplotypeCaller (from GATK, version 4.2.2). We then conducted a statistical analysis of the variant data in each single-cell VCF. Variants present in two or more VCF files were considered genuine and retained, whereas variants that only appeared in one VCF file were filtered out. The statistics for base substitution types, mutation spectra, 96 mutational profiles, and types of Indels are implemented using the R package MutationalPatterns (version 3.12.0).
CNV calling
For CNV calling, the deduplicated BAM files from the SNP and INDEL detection steps are used. We employ the WGS mode of CNVkit (version: 0.9.10): “cnvkit.py batch -m wgs” for calling CNVs, and specific details can be found in the software manual at https://cnvkit.readthedocs.io/en/stable/.
Construction of single-cell genome-wide chromatin interaction matrix
Uni-C raw read pairs are initially processed using FASTP (version: 0.23.2) to remove residual sequencing adapter sequences. After filtering, the read pairs are aligned to the reference genome using the “mem” module of BWA (version: 0.7.17) with the parameters “−5SP -T0”. After alignment, we used the “parse” module of PAIRTOOLS (Version: 0.3.0) to convert the generated SAM files into PAIRSAM format, with specific parameters set to “–min-mapq 40 –walks-policy 5unique –max-interalign-gap 30”. The pairsam files are then sorted and deduplicated using the “sort” and “dedup” modules of PAIRTOOLS, respectively. Following deduplication, the “split” module of PAIRTOOLS is used to convert the deduplicated PAIRSAM files into PAIRS files. These final pair files are utilized to generate the chromatin interaction matrices using tools such as JUICERTOOLS (Version: 1.9.9) or COOLER (Version: 0.9.3).
Detection of structural variants from single cells
For the detection of genomic structural variants within each single cell, we utilized EagleC (version:0.1.9). Briefly, Hi-C contact pair files were converted into mcool files at resolutions of 10 kb, 25 kb, and 50 kb. Subsequently, the “balance” module of COOLER (version: 0.9.3) was employed to normalize the mcool files, followed by CNV calling using the “calculate-cnv” module of Neoloop (version: 0.4.3), with subsequent correction using its “correct-cnv” module. After these preliminary steps, structural variants were identified using the “predictSV-single-resolution” module of EagleC at each of the specified resolutions. We set the “balance-type” parameter to CNV and the “prob-cutoff” parameter to 0.8. After identifying structural variants, we merged redundancies within the same cell across different resolutions using EagleC’s “merge-redundant-SVs” module. To address the issue of high false positive rates, we adopted a filtering strategy similar to that used in single-cell SNP and INDEL detection. We compared structural variants across different cells from the same sample, and only those variations observed in at least two cells were considered genuine. Variations identified in only one cell were deemed false positive noise. We also visually validated these findings in the chromatin interaction heatmaps, further eliminating potential false positives. Additionally, obvious structural variants that were possibly missed by the software were manually added to the results, ensuring that no significant alterations were missed.
A/B compartment
A/B compartmentalization was identified using the Uni-C contact matrix at 100 kb resolution with the “cooltools” package. Additionally, saddle plots were generated via the same “cooltools” package. For detailed procedures, refer to the software’s manual available at: https://cooltools.readthedocs.io/en/latest/.
Prediction of neoantigens from CTCs
The SNPs and INDELs calling for the Uni-C library of circulating single tumor cells were conducted as previously described. Additionally, peripheral blood lymphocytes from wild-type C57BL/6 mice were isolated to construct a second-generation whole-genome sequencing library, using HaplotypeCaller (from GATK, version 4.2.2) to identify SNPs and INDELs. Variants identical to those in wild-type mice were removed from the VCF files of the CTCs. Next, VCF files from different CTCs of the same mouse were merged, ensuring that the “DP” values from each single-cell VCF file were accumulated to avoid issues due to sequencing depth affecting neoantigen prediction later. The merged VCF files were annotated using VEP (version: 102), and the neoantigens were predicted using pVACtools (version: 4.0.6), choosing MHC class I molecules H-2-Kb and H-2-Db. To verify the expression of the predicted neoantigens in pancreatic cancer, transcriptomic data from 15 pancreatic cancer cell lines from the Cancer Cell Line Encyclopedia (CCLE) database were used, retaining only those neoantigens from genes with a total RPKM greater than 50 (Supplementary Fig. 9).
Patient-derived xenograft (PDX) models
The experiment involved one patient, a 75-year-old female. The case was randomly and blindly selected, fresh pancreatic cancer tissues were obtained from the patient in the operating room. Under sterile conditions, the surface fibrous capsule and areas of necrosis or hemorrhage were carefully removed. Well-preserved tumor tissues, appearing pale red or grayish-white, were then excised for further processing. NSG mice were anesthetized via intraperitoneal injection of ketamine and xylazine. In a sterile environment, tumor tissues were minced to a size of 2 × 2 × 2 mm and implanted subcutaneously through a tiny incision in the right flank of anesthetized NSG mice, followed by closure of the skin incision. The mice received postsurgical care and were monitored daily for side effects. Tumor growth was assessed by measuring the tumor size twice a week using a Vernier caliper. After xenograft establishment, all mice were sacrificed to harvest subcutaneous tumor tissue samples.
Mouse CTCs enrichment
The CTCs enrichment system employed negative depletion technology, utilizing the MagniSort™ mouse CD45 depletion set (Thermo Fisher Scientific, 8804-6864-74) and a microscope (Leica). Prior to blood processing, the total white blood cell (WBC) count was determined using a cell blood count machine. The blood samples were then incubated with MagniSort™ anti-mouse CD45 biotin at room temperature for 10 min. The cells were washed once with flow cytometry staining (FACS) buffer (1× PBS, 2 mM EDTA, 2% FBS, 0.09% Sodium Azide). Subsequently, the MagniSort™ negative selection beads were added and incubated for 5 min at room temperature. CTC-enriched samples were collected from the supernatant using a MagniSort™ magnet. Then, CTCs were selected based on cell sizes using a microscope.
Primary cell culture of PanT24, KPC0402, and KPC0403
Tumor tissues were obtained from PDX models and cut into small pieces using scissors and digested with Collagenase D (Worthington Biochemical) for 40 min at 37 °C in 5% CO2. The resulting single-cell suspension was passed through a 70 μm cell strainer (Falcon) within a 50 ml Falcon tube. The cells were then pelleted at 300 × g at 4 °C for 5 min, and the pellet was suspended and further cultured in complete medium (RPMI 1640, 10% FBS, 1% Pen/Strep/glutamate, Thermo Fisher Scientific) at 37 °C and 5% CO2. The cells obtained from successive digestions and passages were designated as PanT24 cells and were subcultured until a homogeneous cell line was established.
Pancreatic tumors were obtained from KPC mice, and the tumor tissues were processed following the same procedure as described above. The resulting tumor cells were designated as KPC0402 or KPC0403 cells, depending on the source. These cells were passaged and cryopreserved for further experimentation.
DNA FISH assay
PanT24 cells were treated with colchicine at a final concentration of 8 μg/ml for 24 h. After incubation, the cells were collected by centrifugation at 300 × g for 5 min and washed twice with PBS. Subsequently, the cell pellet was resuspended in 10 ml of hypotonic KCl solution (0.075 M) and incubated for 30 min at 37 °C. Then, 1 ml of fixative buffer (3:1 methanol:glacial acetic acid) was added to the cell suspension. The cell pellet was re-collected by centrifugation at 300 g for 5 min and resuspended in 5 ml of fixative buffer. After a 5 min incubation, the cell pellet was re-collected by centrifugation at 300 × g for 5 min and resuspended in 1 ml of fixative buffer. Following fixation, 10 μl of the suspension was dropped onto a glass slide and incubated in the prewarmed 2 × SSC (Sigma, 8310-OP) at 67 °C for 30 min. The cells were then dehydrated sequentially in ddH2O, 70%, 85%, and 100% ethanol solutions. After ethanol dehydration, the cells were heated on a hot plate at 82 °C for 10 min in 80% formamide and 2× SSC for DNA denaturation. Next, the cells were incubated for 12 h in a hybridization solution containing 2 μM DNA probes (MYC and CEP8 or CEP16, Spatial FISH Co. Ltd.) in the presence of 50% formamide, 8% dextran sulfate sodium salt (Sigma, 265152-M), and 2× SSC. After hybridization, the cells were washed three times with 20% formamide and three times with 2× SSC. Finally, the slides were stained with DAPI (Thermo Fisher Scientific, 62248) and observed under a super-resolution microscope (Leica, STELLARIS 8 DIVE, NZCKP23110084), 100× oil immersion objective.
Bone marrow-derived dendritic cells (BMDCs) induction
Bone marrow cells were collected from the tibias and femurs by flushing with cold PBS through a 25-gauge needle. The resulting single-cell suspension was filtered through a 70 μm cell strainer into a 50 ml Falcon tube. The cells were then pelleted at 300 × g for 5 min, and the pellet was suspended in ACK lysis buffer (0.15 M NH4Cl, 1 mM KHCO3, 0.1 mM Na2EDTA, pH 7.2) at room temperature for 5 min to lyse red blood cells. After centrifugation at 300 × g for 5 min, the cell pellet was resuspended in RPMI1640 supplemented with 10% FBS, 1% Pen/Strep/glutamate, 20 ng/ml recombinant murine granulocyte macrophage colony-stimulating factor (rGM-CSF, Peprotech, 315-03), 10 ng/ml recombinant murine IL-4 (rIL-4, Peprotech, 214-14) to induce differentiation into dendritic cells (DCs). After 7 days, the suspended cells were harvested were referred to as BMDCs for subsequent experimentation.
Encapsulation of peptides
1,2-Distearoyl-sn-glycero-3-phosphocholine (DSPC), cholesterol (for injection) (CHO-HP), 1,2-Dioleoyl-sn-glycero-3-phosphoethanolamine (DOPE) and 1,2-dimyristoyl-rac-glycero-3-methoxypolyethylene glycol-2000 (DMG-PEG2000) (AVT (Shanghai, China) Pharmaceutical Tech Co., Ltd) were mixed at a molar ratio of 50:40:9:1 and dissolved in trichloromethane-containing peptides (Bankpeptide, Ltd., China). After a few seconds in a water bath, the organic solvent was completely removed by rotary evaporation under reduced pressure. Next, PBS was added to the residue, and the mixture was stirred with a magnetic stirrer to achieve complete hydration. After 2 h, the solution was further concentrated to obtain peptide-loaded liposomes57.
Immunogenicity assessment
Spleen cells were collected from mice that had been stimulated with encapsulated peptides (200 μg per mouse) for 7 days. CD8+ T cells were then isolated from these spleen cells using the EasySep™ Mouse CD8+ T-Cell Isolation Kit (Stemcell, 19853). BMDCs were primed with each encapsulated peptide at a final concentration of 10 μg/ml for 4 h. Subsequently, thirty thousand treated BMDCs and one hundred twenty thousand CD8+ T cells were cocultured in 96-well plates, and maintained in RPMI1640 supplemented with a final concentration of 10% FBS, 20 ng/ml rGM-CSF, 10 ng/ml rIL-4, 1× Con A (Thermo Fisher Scientific, 00-4978-93), and 10 μg/ml of respective peptides. After 48 h, cells were harvested and subjected to flow cytometry analysis.
Flow cytometry analysis
For the analysis of IFNγ production, cells were restimulated in vitro with PMA (50 ng/ml, Sigma, 880134 P) and ionomycin (1 mg/ml, Sigma, 407952) for 4 h at 37 °C in the presence of brefeldin A (1×, BioLegend, 420601). Prior to surface staining, cell pellets were resuspended in Live/Dead dye (Zombie Aqua Fixable Viability Dye, BioLegend, 423101) diluted 1:1000 in PBS on ice for 20 min in the dark and blocked with anti-mouse CD16/CD32 antibody (2.4G2, BD Bioscience, 553141). Cell staining was performed with the appropriate antibody cocktail in FACS buffer. The cells were stained with the following cell surface markers: CD3 (diluted 1:200, 17A2, BioLegend, 100203) and CD8 (diluted 1:200, 53-6.7, BioLegend, 100721). These fluorescence-conjugated antibodies and IFNγ (diluted 1:150, XMG1.2, BioLegend, 505839) were purchased from BioLegend. For IFNγ staining, cell suspensions were stained for the surface markers at 4 °C for 30 min in the dark. Cells were washed twice with FACS buffer prior to fixation and permeabilized using the Intracellular Staining Perm Wash Buffer for 20 min at room temperature in the dark. Cells were then washed twice with perm wash buffer and stained with antibodies against IFNγ in perm wash buffer for at least 1 h at 4 °C in the dark. After staining, cells were washed twice with perm wash buffer before the samples were processed on a flow cytometer. Samples were collected on a flow cytometer and analyzed using FlowJo software (v10.6.2).
Mouse immune experiments
Subcutaneous injections of KPC0402 or KPC0403 cells were performed as follows: approximately 1 × 10⁶ KPC0402 or KPC0403 cells were suspended in 100 μl of HBSS:Matrigel (1:1) solution and injected into the left flank of C57BL/6 mice. For immune experiments, encapsulated peptides (200 μg per mouse) were injected into the right flank of C57BL/6 mice on days 7 and 14 prior to the subcutaneous implantation of tumor cells. For chloroquine treatment, mice received an intraperitoneal injection of chloroquine solution in PBS at a dose of 30 mg/kg or PBS alone, daily starting from day 4 after tumor cell implantation until 2 days before tumor collection. Tumor growth was monitored by measuring two perpendicular diameters twice per week using a caliper. The tumor volume was calculated using the formula: volume = 1/2 × (length × width × width). Mice were euthanized at the indicated time points, and tumors were collected for further analysis.
Statistics and reproducibility
Statistical analyses were performed using GraphPad Prism software. Unpaired two-tailed Student’s t-tests were used for two-group comparisons, one-way ANOVA for comparisons among multiple groups, and multiple t-tests for body weight analyses. Data are presented as mean ± s.d. P < 0.05 was considered statistically significant. Age- and sex-matched mice were randomly assigned to experimental groups. Blinding was not performed in mouse experiments because treatment administration required knowledge of the group allocation. No statistical method was used to predetermine sample size. No animals or data points were excluded from the analyses.
Reporting summary
Further information on research design is available in the Nature Portfolio Reporting Summary linked to this article.
Data availability
The sequencing data generated in this study have been deposited in the Gene Expression Omnibus (GEO) under accession code GSE267873.The DIP-C data used in this study are available in the Sequence Read Archive (SRA) under accession number: SRR7226668, SRR7226679, SRR7226683, SRR7226684, SRR7226685, SRR7226700, SRR7226702, SRR7226703, SRR7226704, and SRR7226706. The HiRES data used in this study are available in the SRA under accession codes: SRR22581791, SRR22581800, SRR22581894, SRR22581901, SRR22581981, SRR22581998, SRR22582009, SRR22582029, SRR22582058, and SRR22582089. Source data are provided with this paper.
References
-
Dixon, J. R. et al. Integrative detection and analysis of structural variation in cancer genomes. Nat. Genet 50, 1388–1398 (2018).
-
Choi, H. & Na, K. J. Pan-cancer analysis of tumor metabolic landscape associated with genomic alterations. Mol. Cancer 17, 150 (2018).
-
Qian, Y. et al. Molecular alterations and targeted therapy in pancreatic ductal adenocarcinoma. J. Hematol. Oncol. 13, 130 (2020).
-
Lin, D. et al. Circulating tumor cells: biology and clinical significance. Signal Transduct. Target Ther. 6, 404 (2021).
-
Zhang, Y. W., Gvozdenovic, A. & Aceto, N. A molecular voyage: Multiomics insights into circulating tumor cells. Cancer Discov. 14, 920–933 (2024).
-
Gu, X., Wei, S. & Lv, X. Circulating tumor cells: From new biological insights to clinical practice. Signal Transduct. Target Ther. 9, 226 (2024).
-
Dutta, A. K. et al. MinimuMM-seq: Genome sequencing of circulating tumor cells for minimally invasive molecular characterization of multiple myeloma pathology. Cancer Discov. 13, 348–363 (2023).
-
Ahn, J. C. et al. Detection of circulating tumor cells and their implications as a biomarker for diagnosis, prognostication, and therapeutic monitoring in hepatocellular carcinoma. Hepatology 73, 422–436 (2021).
-
Chen, Y. et al. Functionalized tetrahedral DNA frameworks for the capture of circulating tumor cells. Nat. Protoc. 19, 985–1014 (2024).
-
Xie, Z. et al. Circulating tumor cells with increasing aneuploidy predict inferior prognosis and therapeutic resistance in small cell lung cancer. Drug Resist Updat 76, 101117 (2024).
-
Koeppel, J., Weller, J., Vanderstichele, T. & Parts, L. Engineering structural variants to interrogate genome function. Nat. Genet 56, 2623–2635 (2024).
-
Alkan, C., Coe, B. P. & Eichler, E. E. Genome structural variation discovery and genotyping. Nat. Rev. Genet 12, 363–376 (2011).
-
Bailey, C. et al. Origins and impact of extrachromosomal DNA. Nature 635, 193–200 (2024).
-
Hung, K. L. et al. Coordinated inheritance of extrachromosomal DNAs in cancer cells. Nature 635, 201–209 (2024).
-
Deshpande, V. et al. Exploring the landscape of focal amplifications in cancer using AmpliconArchitect. Nat. Commun. 10, 392 (2019).
-
Dean, F. B. et al. Comprehensive human genome amplification using multiple displacement amplification. Proc. Natl. Acad. Sci. USA 99, 5261–5266 (2002).
-
Zong, C., Lu, S., Chapman, A. R. & Xie, X. S. Genome-wide detection of single-nucleotide and copy-number variations of a single human cell. Science 338, 1622–1626 (2012).
-
Tan, L., Xing, D., Chang, C. H., Li, H. & Xie, X. S. Three-dimensional genome structures of single diploid human cells. Science 361, 924–928 (2018).
-
Xing, D., Tan, L., Chang, C. H., Li, H. & Xie, X. S. Accurate SNV detection in single cells by transposon-based whole-genome amplification of complementary strands. Proc. Natl. Acad. Sci. USA 118, https://doi.org/10.1073/pnas.2013106118 (2021).
-
Gonzalez-Pena, V. et al. Accurate genomic variant detection in single cells with primary template-directed amplification. Proc. Natl. Acad. Sci. USA 118, https://doi.org/10.1073/pnas.2024176118 (2021).
-
Lin, D. et al. Digestion-ligation-only Hi-C is an efficient and cost-effective method for chromosome conformation capture. Nat. Genet 50, 754–763 (2018).
-
Wang, X. et al. Genome-wide detection of enhancer-hijacking events from chromatin interaction data in rearranged genomes. Nat. Methods 18, 661–668 (2021).
-
Rao, S. S. et al. A 3D map of the human genome at kilobase resolution reveals principles of chromatin looping. Cell 159, 1665–1680 (2014).
-
Lieberman-Aiden, E. et al. Comprehensive mapping of long-range interactions reveals folding principles of the human genome. Science 326, 289–293 (2009).
-
Nagano, T. et al. Cell-cycle dynamics of chromosomal organization at single-cell resolution. Nature 547, 61–67 (2017).
-
Flyamer, I. M. et al. Single-nucleus Hi-C reveals unique chromatin reorganization at oocyte-to-zygote transition. Nature 544, 110–114 (2017).
-
Lin, D. et al. Decoding the spatial chromatin organization and dynamic epigenetic landscapes of macrophage cells during differentiation and immune activation. Nat. Commun. 13, 5857 (2022).
-
Liu, Z. et al. Linking genome structures to functions by simultaneous single-cell Hi-C and RNA-seq. Science 380, 1070–1076 (2023).
-
Picelli, S. et al. Tn5 transposase and tagmentation procedures for massively scaled sequencing projects. Genome Res. 24, 2033–2040 (2014).
-
Rosenberg, A. B. et al. Single-cell profiling of the developing mouse brain and spinal cord with split-pool barcoding. Science 360, 176–182 (2018).
-
Akgol Oksuz, B. et al. Systematic evaluation of chromosome conformation capture assays. Nat. Methods 18, 1046–1055 (2021).
-
Stepanauskas, R. et al. Improved genome recovery and integrated cell-size analyses of individual uncultured microbial cells and viral particles. Nat. Commun. 8, 84 (2017).
-
Lin, D. et al. MGA-seq: robust identification of extrachromosomal DNA and genetic variants using multiple genetic abnormality sequencing. Genome Biol. 24, 247 (2023).
-
McKenna, A. et al. The Genome Analysis Toolkit: A MapReduce framework for analyzing next-generation DNA sequencing data. Genome Res. 20, 1297–1303 (2010).
-
Wang, X., Luan, Y. & Yue, F. EagleC: A deep-learning framework for detecting a full range of structural variations from bulk and single-cell contact maps. Sci. Adv. 8, eabn9215 (2022).
-
Wang, S. et al. HiNT: a computational method for detecting copy number variations and translocations from Hi-C data. Genome Biol. 21, 73 (2020).
-
Li, J., Gao, L. & Ye, Y. HiSV: A control-free method for structural variation detection from Hi-C data. PLoS Comput Biol. 19, e1010760 (2023).
-
Gao, G. et al. The NFIB/CARM1 partnership is a driver in preclinical models of small cell lung cancer. Nat. Commun. 14, 363 (2023).
-
Mitter, M. et al. Conformation of sister chromatids in the replicated human genome. Nature 586, 139–144 (2020).
-
McLaren, W. et al. The ensembl variant effect predictor. Genome Biol. 17, 122 (2016).
-
Mayakonda, A., Lin, D. C., Assenov, Y., Plass, C. & Koeffler, H. P. Maftools: efficient and comprehensive analysis of somatic variants in cancer. Genome Res. 28, 1747–1756 (2018).
-
Chaturvedi, P., Singh, A. P. & Batra, S. K. Structure, evolution, and biology of the MUC4 mucin. FASEB J. 22, 966–981 (2008).
-
Bafna, S., Kaur, S. & Batra, S. K. Membrane-bound mucins: the mechanistic basis for alterations in the growth and survival of cancer cells. Oncogene 29, 2893–2904 (2010).
-
Hu, H. F. et al. Mutations in key driver genes of pancreatic cancer: molecularly targeted therapies and other clinical implications. Acta Pharm. Sin. 42, 1725–1741 (2021).
-
Martínez-Jiménez, F. et al. A compendium of mutational cancer driver genes. Nat. Rev. Cancer 20, 555–572 (2020).
-
Baretti, M. & Le, D. T. DNA mismatch repair in cancer. Pharm. Ther. 189, 45–62 (2018).
-
Hundal, J. et al. pVACtools: A computational toolkit to identify and visualize cancer neoantigens. Cancer Immunol. Res. 8, 409–420 (2020).
-
Barretina, J. et al. The Cancer Cell Line Encyclopedia enables predictive modelling of anticancer drug sensitivity. Nature 483, 603–607 (2012).
-
Yamamoto, K. et al. Autophagy promotes immune evasion of pancreatic cancer by degrading MHC-I. Nature 581, 100–105 (2020).
-
Wu, S., Bafna, V., Chang, H. Y. & Mischel, P. S. Extrachromosomal DNA: AN Emerging Hallmark In Human Cancer. Annu Rev. Pathol. 17, 367–386 (2022).
-
Turner, K. M. et al. Extrachromosomal oncogene amplification drives tumour evolution and genetic heterogeneity. Nature 543, 122–125 (2017).
-
Ling, X. et al. Small extrachromosomal circular DNA (eccDNA): major functions in evolution and cancer. Mol. Cancer 20, 113 (2021).
-
Logsdon, G. A., Vollger, M. R. & Eichler, E. E. Long-read human genome sequencing and its applications. Nat. Rev. Genet 21, 597–614 (2020).
-
Gerlinger, M. et al. Intratumor heterogeneity and branched evolution revealed by multiregion sequencing. N. Engl. J. Med. 366, 883–892 (2012).
-
Wang, D. et al. Multiregion sequencing reveals the genetic heterogeneity and evolutionary history of osteosarcoma and matched pulmonary metastases. Cancer Res. 79, 7–20 (2019).
-
Bakker, B. et al. Single-cell sequencing reveals karyotype heterogeneity in murine and human malignancies. Genome Biol. 17, 115 (2016).
-
Guo, Q. et al. Antigen/adjuvant-free liposome induces adjuvant effects for enhancing cancer immunotherapy. Exploration 5, 20230115 (2024).
Acknowledgements
This work was supported by the National Natural Science Foundation of China (32370685 to D.L., 82400191 to X.Y.L.) and the Liaoning Provincial Science and Technology Project (2023-MS-162 to X.Y.L.). DNA hybridization probes were provided by Spatial FISH Co. Ltd., and high-throughput sequencing services were provided by Wuhan Benagen Technology Co., Ltd. This work was also partially supported by the Science and Technology Planning Project of Guangdong Province, China (2023B1212060050). We also thank Professor Junil Kim at Soongsil University for his helpful suggestions on data analysis and manuscript writing.
Ethics declarations
Competing interests
The authors declare no competing interests.
Peer review
Peer review information
Nature Communications thanks Anthony Zamora, who co-reviewed with Jessica Schmeling; Tatiana Popova, Malte Spielmann, and the other, anonymous, reviewer(s) for their contribution to the peer review of this work. A peer review file is available.
Additional information
Publisher’s note Springer Nature remains neutral with regard to jurisdictional claims in published maps and institutional affiliations.
Supplementary information
Source data
Rights and permissions
Open Access This article is licensed under a Creative Commons Attribution-NonCommercial-NoDerivatives 4.0 International License, which permits any non-commercial use, sharing, distribution and reproduction in any medium or format, as long as you give appropriate credit to the original author(s) and the source, provide a link to the Creative Commons licence, and indicate if you modified the licensed material. You do not have permission under this licence to share adapted material derived from this article or parts of it. The images or other third party material in this article are included in the article’s Creative Commons licence, unless indicated otherwise in a credit line to the material. If material is not included in the article’s Creative Commons licence and your intended use is not permitted by statutory regulation or exceeds the permitted use, you will need to obtain permission directly from the copyright holder. To view a copy of this licence, visit http://creativecommons.org/licenses/by-nc-nd/4.0/.
About this article

Cite this article
Gao, X., Li, X., Xu, W. et al. Identification of multiple genomic alterations and prediction of neoantigens from circulating tumor cells at the single-cell level. Nat Commun 16, 6901 (2025). https://doi.org/10.1038/s41467-025-62215-w
-
Received:
-
Accepted:
-
Published:
-
DOI: https://doi.org/10.1038/s41467-025-62215-w