Main
Hematopoietic stem and progenitor cells (HSPCs) can sustain lifelong production of a diverse range of blood cell types through a hierarchically organized continuum of cell states1,2. Over the past two decades, ex vivo HSPC gene therapy (GT) has become an established treatment for various hematological and metabolic diseases3,4,5,6,7,8,9,10 but faces challenges related to the high cost and complexity of autologous gene-modified cell manufacturing, as well as safety concerns regarding conditioning regimens before transplantation9,11,12,13,14,15,16,17,18. A systemic injection of a vector delivering in vivo HSPC GT directly to the natural cellular niche would overcome many limitations by eliminating the need for complex cell manufacturing, prolonged hospitalization and bone marrow (BM) conditioning. An ideal in vivo delivery system should be capable of efficiently reaching long-term multipotent HSPCs in their natural BM while avoiding off-target cells in main filter organs such as the liver.
A recent study described the delivery of genetic payloads in vivo into murine hematopoietic stem cells (HSCs) by a lipid nanoparticle (LNP) encapsulating an mRNA targeted to CD117, a stem cell factor receptor expressed on murine HSPCs19. However, the in vivo studies were limited to mRNA delivery to induce Cre-lox recombination in reporter mice and underscored that current retargeted LNP delivery systems20 retain substantial biodistribution in off-target filter organs such as the spleen and the liver. This was also seen in another study using a nontargeted LNPs in nonhuman primates21. LNPs are also currently limited in their capacity to incorporate complex gene-editing protein cargos.
In contrast, virus-like particles (VLPs), an envelope-based delivery system lacking a viral genome, can package and deliver complex gene-editing payloads through linkage to the viral capsid protein (gag)22,23,24. These particles offer specific advantages over other delivery systems. First, VLPs can accommodate large ribonucleoproteins (RNPs), which, because of their shorter half-life compared to mRNA-encoded editors, can potentially reduce the chances of off-target editing in vivo23. Additionally, delivering RNP instead of mRNA makes editing independent of the transcriptional activation state of target cells, which is especially important when targeting quiescent long-term multipotent HSPCs25. Retargeting of VLPs can be achieved through the engineering of envelope glycoproteins, as achieved for lentiviral vector (LV) constructs26,27,28. To our knowledge, VLPs envelopes have not been engineered for efficient in vivo gene editing of human HSPCs. In this study, we tested two VLP designs.
We first chose the modified Baboon endogenous viral envelope glycoprotein (BaEVTR) because it has a 20-fold higher propensity than the most commonly used vesicular stomatitis virus G protein (VSV-G) to transduce human HSPCs in vitro under conditions of low cytokine activation24,29,30,31,32. BaEVTR is resistant to human complement inactivation and there is no prior exposure to the Baboon endogenous virus in the general human population, which reduces the chances of strong immunogenicity upon the first systemic administration31. We implemented several modifications to BaEVTR. Further engineering the protease site of the BaEVTR cytoplasmic domain could enable a more efficient removal of the R peptide sequence that normally inhibits virus-to-cell fusion31. Because RetroNectin enhances viral-mediated gene transfer to target cells expressing the integrin receptors VLA-4/5 such as human HSPCs33, designing moieties that bind the same integrins could further enhance BaEVTR affinity for human HSPCs. We designed and tested such modifications and demonstrated higher on-target potency in vitro and in vivo.
However, because BaEVTR binds to the widely expressed ASCT1/2 solute carriers, it also transduces mature peripheral blood (PB) cells. To increase specificity to HSPCs by redirecting VLP tropism to a receptor of interest26,34,35, we leveraged Nipah virus (NiV) envelopes because of the modular structure of their fusogen complex36. Engineering of the NiV receptor binding complex to recognize specific cell-surface molecules has been used to target LVs to HSPCs35 but comprehensive in vitro and in vivo validation of this retargeting system is still lacking. We, therefore, equipped VLPs with a newly designed NiV fusion complex, retargeted with custom-engineered binders to the CD133 molecule, and tested this envelope extensively in vitro and in vivo, demonstrating enhanced specificity for human HSPCs compared to BaEVTR.
Lastly, we showed that both engineered envelopes avoid human hepatocytes upon systemic administration in vivo in a humanized liver mouse model, a feature that would be beneficial in clinical application.
Results
Engineering BaEVTR for enhancing in vivo transduction of long-term HSPCs
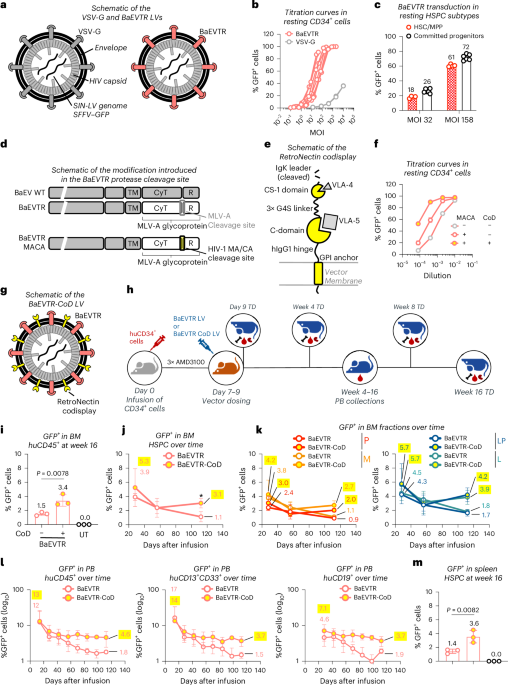
For our initial tests, we leveraged LV constructs carrying the green fluorescent protein (GFP) reporter gene under the control of a spleen focus-forming virus (SFFV) promoter and pseudotyped with two envelope proteins commonly used to transduce ex vivo human HSPCs: VSV-G and BaEVTR (Fig. 1a). To best simulate in vivo delivery scenarios, we used an in vitro protocol designed to test transduction of human HSPCs without cytokine stimulation (Supplementary Information and Extended Data Fig. 1a–f). We performed transductions with varying dilutions of VSV-G LV or BaEVTR LV co-delivered with the Vectofusin-1 (VF1) adjuvant37 for 24 h. In line with previous findings in low cytokine stimulation conditions37, the BaEVTR LV demonstrated significantly higher potency on transducing resting CD34+ cells as compared to the VSV-G LV (Fig. 1b and Extended Data Fig. 2a). To show that BaEVTR can access all HSPC subtypes in resting conditions, we sorted five distinct progenitors using fluorescence-activated cell sorting (FACS) (Supplementary Information Fig. 1) and exposed each HSPC subpopulation to BaEVTR LV using the same transduction conditions used for the bulk CD34+ population. As shown in Fig. 1c and Extended Data Fig. 2b, we achieved equivalent levels of transduction in all progenitor subtypes at multiplicities of infection (MOIs) 32 and 158, respectively, including HSCs and multipotent progenitors (MPPs) (average: 18% and 61%). This result demonstrates the potential of BaEVTR to access a population of cells endowed with long-term multilineage potential in their resting state.

a, Schematic representation of the VSV-G and BaEVTR LV vectors. b, Percentage of GFP+ cells measured in CD34+ cells upon BaEVTR or VSV-G LV transduction without CC110 prestimulation (resting condition) at different vector MOIs. Each curve shows the results of a different vector batch. c, Average percentage of GFP+ cells measured upon transduction of FACS-sorted HSC and MPP versus the remaining committed progenitors in resting condition at MOI 32 or MOI 158 (Extended Data Fig. 2b). d, Schematic representation depicting the introduction of an HIV-derived protease cleavage site (MACA) between the cytoplasmic (CyT) and regulatory (R) domains of the BaEVTR. WT, wild type. e, Schematic representation of the RetroNectin CoD. The VLA-4 and VLA-5 ligands interacting with the CS-1 and C-domain, respectively, are also depicted. GPI, glycosylphosphatidylinositol; hIgG1, human Immunoglobulin G1. f, Representative titration curves in resting CD34+ cells using a BaEVTR LV (gray dots), BaEVTR LV with protease modification (MACA) (red dots) or BaEVTR LV MACA with additional CoD modification (yellow-filled dots). g, Schematic representation of the BaEVTR LV vector constructs with RetroNectin CoD. h, Overview of an in vivo study for testing the CoD construct. LV pseudotyped with BaEVTR-CoD or BaEVTR alone was infused in NBSGW mice at days 7–9 after humanization (3.04 × 10⁸ TU per mouse per dose for both LVs). AMD3100 was infused 2 h before each vector dosing. i, Percentage of GFP+ cells on BM huCD45+ cells at week 16 after dosing of a BaEVTR LV without CoD. j, Percentage of GFP+ cells on BM HSPCs measured over time after dosing of a BaEVTR LV without CoD reported as the mean ± s.d. (n = 9 treated with BaEVTR LV, n = 8 treated with BaEVTR-CoD LV). k, Percentage of GFP+ cells on P and M populations (left) or LP and L populations (right) measured over time in the BM after dosing of a BaEVTR LV without CoD (mean ± s.d.). l, Percentage of GFP+ cells on PB huCD45+ cells (left), M cells (middle) or B cells (right) measured over time after dosing of a BaEVTR LV without CoD (mean ± s.d.). m, Percentage of GFP+ cells on splenic HSPCs at week 16 after dosing of a BaEVTR LV without CoD. Numbers on curves or bars show the average values measured for given experimental conditions or time points. Data are presented as the mean values ± s.d. For bars, statistical significance was measured using a one-way ANOVA with Tukey’s multiple-comparison test and the exact P value is reported; for curves, statistical significance was measured using a two-tailed unpaired t-test with Welch’s correction and reported using asterisks (*P < 0.05). Symbols represent biological replicates unless otherwise stated.
We next sought to develop BaEVTR envelope variants with increased in vivo potency and affinity for human HSPCs. Firstly, we swapped the cleavage site used by the murine leukemia virus (MLV) protease to cleave the cytoplasmic tail of the BaEVTR molecule with a MA/CA (MACA) cleavage site, which is recognized by a human immunodeficiency virus (HIV) protease38 (Fig. 1d). Furthermore, we added a custom-designed surface molecule encompassing the VLA-4-binding and VLA-5-binding domains from the C-domain and CS-1 site, respectively, of the RetroNectin recombinant fibronectin fragment39,40 (Fig. 1e). We tested this construct, called codisplay (CoD), in LV vectors. As shown in Fig. 1f and Extended Data Fig. 2e, we could measure increasingly higher titers in vitro in resting CD34+ cells, adding the MACA cleavage site first and then the CoD construct to our BaEVTR LV. Overall, the resulting BaEVTR-CoD LV (defined from this point on as including both MACA and CoD modifications; Fig. 1g) showed higher on-target potency in vitro versus the standard BaEVTR LV construct.
We next aimed to validate the potency these envelopes in vivo using NOD.Cg-Kit−41JTyr+PrkdcscidIl2rgtm1Wjl/ThomJ (NBSGW) mice41 humanized with mobilized PB CD34+ cells. In this short-term humanized experimental design (Supplementary Text and Supplementary Fig. 2) human HSPCs reside almost exclusively in the BM and are not yet heavily skewed toward lymphoid progenitors (LPs). In this scenario, we observed that administering AMD3100 before particle dosing did not induce HSPC egress to the PB but enhanced transduction of HSPCs within the BM niche (Supplementary Text, Extended Data Fig. 3a–c and Supplementary Fig. 2). Addressing the volumetric limitations of intravenous (IV) dosing in mice, we tested a dosing schedule over three consecutive days achieving 7.5% transduction of BM human CD45+ (huCD45+) cells with a BaEVTR LV 5 days after the last dose (Supplementary Text and Extended Data Fig. 3d,e).
To compare the performance of our vector designs in vivo, we then administered three consecutive doses of a BaEVTR LV or BaEVTR-CoD LV in short-term humanized NBSGW mice (Fig. 1h) and followed up treated animals for 16 weeks. To monitor BM engraftment dynamics over the course of the study, we characterized the changes in relative contribution of four populations enriched in primitive (P, CD34+CD13/CD33+), myeloid (M, CD34−CD13/CD33+), LP (CD34−CD13/CD33−) and L (CD34−CD13/CD33−) cells (Supplementary Text and Supplementary Fig. 3). Confirming the in vitro results, we detected a significantly higher percentage of GFP+ cells at week 16 in the BM huCD45+ cell compartment of mice treated with the BaEVTR-CoD LV versus the standard BaEVTR LV (Fig. 1i). Over time, we observed a higher percentage of transduced HSPCs in the BaEVTR-CoD LV group (Fig. 1j). Similar dynamics were detected measuring the percentage of GFP+ cells in the four BM fractions described above, particularly concerning the LP and L cell populations (Fig. 1k). Accordingly, the BaEVTR-CoD LV displayed higher long-term transduction levels in the PB not only in the long-lived mature CD19+ lymphocytes but also in the PB CD13+CD33+ M cell population (Fig. 1l), reflecting the output of gene-modified long-term multipotent stem cells. These transduction levels were also confirmed molecularly by vector copy number (VCN) evaluation (Extended Data Fig. 3f). A similar percentage of GFP+ cells was observed in the spleen-resident huCD45+ cell progeny again showing superior long-term transduction using the BaEVTR-CoD LV over the BaEVTR LV (Fig. 1m). Histology performed on sterna collected from treated animals at different time points after infusion showed colocalization of human nuclei and GFP signals both in proximity of sinusoidal vessels and in the endosteum, confirming the stable transduction by both vectors not only of committed progenitors but also of long-term HSCs, which are more likely to reside in the endosteal niche (Supplementary Fig. 4). Overall, these data support the use of the MACA and CoD modification in combination with the BaEVTR envelope in an LV construct.
Design and testing of BaEVTR VLPs for in vivo delivery of genome editing payloads to long-term human HSPCs
To incorporate these envelopes into VLP constructs, we first generated a BaEVTR VLP carrying a β2 microglobulin (B2M) guide RNA (gRNA) (Supplementary Information Table 1) and a CRISPR–Cas9 editor covalently fused with a MLV capsid22(Fig. 2a). We chose to target the B2M locus because it provides a surrogate flow cytometry (FC) readout for gene editing, as exemplified in Fig. 2b. In vitro on resting HSPCs (same protocol as described in Extended Data Fig. 1a), the efficiency was 75% B2M− cells as measured by FC, corresponding to up to 93% of edited alleles, as measured by high-throughput sequencing (HTS) of the B2M locus (Fig. 2c and Supplementary Table 2). We next isolated five HSPC fractions and exposed them individually in resting conditions to the BaEVTR VLP. This particle was capable of efficiently editing all HSPC subtypes including HSC (6.7% and 38% editing at MOI 16 and 28% and 61% at MOI 83 as measured by FC and HTS, respectively; Fig. 2d and Extended Data Fig. 4a). These results underscored that the FC assessment of B2M− cells tends to underestimate the editing efficiency of our VLP, particularly in the more quiescent HSPC subtypes such as HSCs and MPPs. When measuring the relative proportion of editing variants in each HSPC subtype, we could observe that the predominant fraction was constituted by deletions. Notably, the granulocyte/macrophage progenitor fraction hosted a substantially higher number of insertion events as compared to the other subpopulations, suggesting that more committed progenitors may be biased toward resolving edits by insertion (Extended Data Fig. 4b). Once dosed in vivo in a pilot short-term study, our BaEVTR VLP achieved 20% and 47% B2M− cells (as measured by FC) corresponding to 47% and 71% B2M editing, as measured by HTS, 5 days after one dose and three doses, respectively (Fig. 2e, Supplementary Text and Extended Data Fig. 5a–d). Repeating the single-dose arm of this study in an NBSGW mouse at 9 weeks after humanization, where BM is fully humanized (~85% huCD45+), yielded comparable levels of B2M− HSPCs (Supplementary Text and Extended Data Fig. 5e–g).

a, Schematic representation of a BaEVTR VLP carrying a Cas9 and a B2M gRNA payload. b, Representative FACS plot showing the percentage of B2M− cells induced through disruption of the B2M locus in vitro in resting huCD34+ cells using a BaEVTR VLP at MOI 16 versus the untransduced control (UT). c, Titration curves of two BaEVTR VLP batches upon transduction of CD34+ cells at different vector dilutions as the percentage of B2M− cells measured by FC or percentage of B2M edited alleles measured by HTS. d, Editing efficiency measured by FC or HTS in the resting HSPC bulk population and in FACS-sorted resting HSPC subtypes using a BaEVTR VLP at MOI 16. e, Comparison of B2M− cells versus B2M edited alleles measured by FC versus HTS, respectively, in BM huCD45+ cells days after VLP dosing in vivo (Extended Data Fig. 5a–d). Statistical analyses were performed comparing the editing efficiency of VLP versus VLP-CoD using FC or HTS readouts. f, Overview of an in vivo delivery study where NBSGW mice were humanized by infusion of CD34+ cells and then treated on days 7–9 with three IV doses of BaEVTR VLP. AMD3100 was infused 2 h before each vector dosing. g, Percentage of B2M− cells on huCD45+ cells measured by FC at week 16 after BaEVTR VLP dosing. h, Percentage of B2M− cells on BM HSPCs measured by FC over time after BaEVTR VLP dosing. i, Percentage of B2M− cells on BM HSPC subtypes measured by FC at week 16 after BaEVTR VLP dosing. j, Percentage of B2M− cells on P, M, LP and L populations measured over time by FC in the BM after BaEVTR VLP dosing. k, Percentage of B2M− cells on PB huCD45+ cells (left), M cells (middle) or B L cells (right) measured by FC over time after BaEVTR VLP dosing. l, Percentage of B2M− cells on splenic HSPCs measured by FC at week 16 after BaEVTR VLP dosing. m, Comparison of B2M− cells versus B2M edited alleles measured over time by FC versus HTS, respectively, in BM huCD45+ cells after BaEVTR VLP dosing. n, Comparison of B2M− cells versus B2M edited alleles measured over time by FC versus HTS, respectively, in BM fractions after BaEVTR VLP dosing. o, Comparison of B2M− cells versus B2M edited alleles in BM huCD45+ cells measured by FC versus HTS, respectively, at week 16 after BaEVTR VLP dosing. Statistical significance was measured using a two-tailed unpaired t-test with Welch’s correction. p, Relative contribution of editing variants of the B2M locus measured in PB huCD45+ cells over time by HTS after BaEVTR VLP dosing. Numbers on curves or bars show the average values measured for given experimental conditions or time points. Data are presented as the mean values ± s.d. Symbols represent biological replicates unless otherwise stated.
Next, we conducted a comprehensive long-term study to assess permanent editing of long-term human HSPCs, with a terminal readout at week 16 (Fig. 2f). Firstly, we could confirm that 6.4% of edited huCD45+ cells could still be detected by FC readout in the BM of the treated animals 16 weeks after dosing (Fig. 2g). Over time, we noticed a substantially higher initial fraction of B2M− cells (48%), dropping from week 4 to week 8, which may have resulted from the exhaustion of edited short-living progenitors. This level remained stable at ~8% from week 8 through the end of the study (Fig. 2h). These data were reflected by similar editing levels at week 16 in several HSPC subtypes including the HSC and MPP population (Fig. 2i). Examining the editing levels in the four main human BM cell fractions over time, the largest drop in B2M− cells between week 4 and week 8 was indeed observed in the L and LP subpopulations (Fig. 2j), representing the most active progenitors during this phase of human cell engraftment in the mouse BM. We observed comparable dynamics in the mature human PB progeny over time with final readouts at week 16 showing an average of 3.5%, 2.5% and 3.9% B2M− cells in the huCD45+, huCD13+CD33+ and huCD19+ fractions, respectively (Fig. 2k). The spleen displayed a similar level of HSPC edited cells at week 16 as compared to the BM (Fig. 2l).
Because we showed that the FC readout tends to underestimate the level of B2M editing, we next performed a comprehensive analysis of molecular editing at all time points by HTS. Results showed a discrepancy with the FC readout in the PB, whereby the editing efficiency measured by HTS at week 4 was 71% (versus the 45% measured by FC) and, at week 16, the percentage of edited alleles was still 27% (versus the 3.5% measured by FC) (Fig. 2m). Comparable results were observed from HTS conducted on the four BM fractions reflecting the dynamics measured by FC but highlighting higher levels of editing (Fig. 2n). This was mirrored by the preservation of 28% edited alleles in the least differentiated MPP fraction, which overall resulted in the maintenance of 29% editing of the total huCD45+ cell population measured by HTS at the end of the study (versus the 6.4% measured by FC) (Fig. 2o). The discrepancy between FC and HTS data suggested that the most differentiated cells could carry monoallelic edits or editing variants whose effect on B2M expression is not easily identifiable by FC. Looking at the selection of editing variants in PB cells over time, we noticed that, while the percentage of deletions remained relatively stable over time (21% at week 4 versus 17% at week 16), the relative fraction of insertions dropped from 43% at week 4 to 7.4% at the end of the study (Fig. 2p). We observed a similar negative selection for insertions events over time across all BM fractions (Supplementary Fig. 5). Overall, these data showed that the BaEVTR VLP achieved high editing in resting human HSPCs in vitro and in long-term BM HSPCs in vivo, which was maintained for at least 16 weeks after vector dosing.
Engineering a BaEVTR-CoD VLP for in vivo delivery of therapeutic payloads to human HSPCs
Next, we designed and produced a BaEVTR-CoD VLP (Fig. 3a) and tested it in vitro on resting huCD34+ cells. The data show progressively higher titers in vitro in resting HSPCs adding the MACA cleavage site and the CoD as compared to the original BaEVTR VLP construct (Extended Data Fig. 6a,b), similarly to what was shown for the LV constructs. For an 8-week in vivo study in mice, we administered three consecutive IV doses of a BaEVTR VLP carrying the MACA cleavage site, with or without CoD, on days 7–9 after humanization to overcome single-bolus dosing volume limitations (Extended Data Fig. 6c). In line with the results obtained in vitro, we detected a significantly higher percentage of B2M− cells, measured by FC on BM huCD45+ cells at week 8, in the group treated with the BaEVTR-CoD VLP versus the BaEVTR VLP design (Fig. 3b). A similar trend was observed when looking at the B2M− cell contribution in the BM HSPC compartment (Fig. 3c), in all BM fractions (Fig. 3d), over time in all main PB populations (Fig. 3e) and in the BM progeny found in the spleen on the day of takedown (Fig. 3f). We could confirm the superior in vivo performance of our BaEVTR-CoD VLP construct when measuring the levels of molecular edits by HTS in the PB over time (Fig. 3g) and in the BM at takedown (Fig. 3h,i). We also show that the introduction of the CoD did not alter the in vivo detection of the editing variants observed in the B2M locus with respect to what was observed with the BaEVTR VLP design (Extended Data Fig. 6d).

a, Schematic representation of a BaEVTR VLP with RetroNectin CoD carrying Cas9 and a B2M gRNA payload. b, Percentage of B2M− cells on huCD45+ cells measured by FC at week 8 after dosing of a BaEVTR VLP with or without CoD (1.1 × 10⁸ EU per mouse per dose and 1.8 × 10⁷ EU per mouse per dose, respectively) (in vivo experimental design in Extended Data Fig. 6c). c, Percentage of B2M− cells on BM HSPCs measured by FC at week 8 after dosing of a BaEVTR VLP without CoD. d, Percentage of B2M− cells on BM P, M, LP and L populations measured by FC at week 8 after dosing of a BaEVTR VLP without CoD. e, Percentage of B2M− cells on PB huCD45+ cells (left), M cells (middle) or B L cells (right) measured by FC over time after dosing of a BaEVTR VLP without CoD reported as the mean ± s.d. (n = 6 treated with BaEVTR VLP, n = 6 treated with BaEVTR-CoD VLP). f, Percentage of B2M− cells on splenic HSPCs measured by FC at week 8 after dosing of a BaEVTR VLP without CoD. g, Comparison of B2M− cells versus B2M edited alleles measured over time by FC versus HTS, respectively, in BM huCD45+ cells after VLP (left) or VLP-CoD (right) dosing (mean ± s.d.). h, Comparison of B2M− cells versus B2M edited alleles in BM huCD45+ cells measured by FC versus HTS, respectively, at week 8 after VLP or VLP-CoD dosing (VLP versus VLP-CoD, P = 0.0029). i, B2M edited alleles measured by FC versus HTS in BM fractions at week 8 after VLP or VLP-CoD dosing. j, Schematic representation of BaEVTR-CoD VLPs designed to carry an ABE and BCL11A gRNA or a Cas9 editor and HBG1/2 gRNA. k, Schematic representation of the gRNA designs and the relative targeted human loci (more details in Supplementary Table 1). Top, the two nucleotides targeted for conversion from A to G by the ABE are highlighted for the BCL11A guide. The directional arrows inside the gRNA boxes pointing toward the right or the left indicate the guide designs on the positive or the negative strands, respectively. E-box, enhancer box; HPFH, hereditary persistence of HbF. l, Percentage of BCL11A or HBG1/2 edited alleles measured on day 12 by HTS in BM huCD45+ cells after VLP-CoD dosing. m, Stacked bar showing the relative contribution of editing variants measured on day 12 within the edited BM huCD45+ cell population upon delivery of the BCL11A ABE (left) or the HBG1/2 (right) Cas9 cargo. n, Representative histogram plot showing HbF expression in CFU generated from CD34+ cells isolated ex vivo from mice on day 12 after VLP-CoD dosing. FMO Ctrl, fluorescence minus one control. o, Bar plots showing the percentage of HbF+ cells and HbF MFI in each CFU plate (two technical replicates per sample) generated from seeding BM CD34+ cells isolated ex vivo on day 12 from each mouse. Numbers on curves or bars show the average values measured for given experimental conditions or time points. Data are presented as the mean values ± s.d. For bars, statistical significance was measured using a one-way ANOVA with Tukey’s multiple-comparison test and the exact P value is reported; for curves, statistical significance was measured using a two-tailed unpaired t-test with Welch’s correction and reported using asterisks (*P < 0.05 and **P < 0.01). Symbols represent biological replicates unless otherwise stated.
Next, we studied editing at loci of therapeutic relevance for human hemoglobinopathies (Fig. 3j). One BaEVTR-CoD VLP was designed to carry a cargo composed by an ABE8e adenine base editor (ABE)42 fused to the MLV gag protein and gRNA for editing the GATA1-binding site of the human BCL11A gene. A second BaEVTR-CoD VLP was produced to deliver a CRISPR–Cas9 nuclease and a gRNA for disrupting the BCL11A-binding site in the HBG1/2 promoter region. An overview of guide targets and designs is provided in Fig. 3k and Supplementary Table 1. Upon in vitro titration in resting CD34+ cells, we confirmed by HTS the ability of these two cargos to either induce an A>T to G>C conversion in the GATA-binding site of the BCL11A locus (average titer of 4.4 × 10⁵ with 82% editing at top dose) or to disrupt the BCL11A-binding site of the HGB1/2 locus (average titer of 4.9 × 10⁴ with 26% editing at top dose), although the efficiency of editing was lower than that achieved with an identical construct targeting the B2M locus. We next tested these two VLPs in short-term humanized NBSGW mice and measured by HTS the editing efficiencies in the human BM fraction at the two loci 5 days after vector dosing (Extended Data Fig. 6e). We obtained, in BM huCD45+ cells, 26% A>G base conversion in the BCL11A target site and 7.5% editing of the HBG1/2 locus (Fig. 3l). When looking at the editing variants obtained with the ABE cargo, we observed 59% conversion of A>G at both target nucleotides and 40% conversion of the A nucleotide immediately downstream of the GATA-binding site (Fig. 3m, left). On the other hand, the relative contribution of the editing variants introduced by the CRISPR–Cas9 editor in the HBG1/2 locus was in line with that observed for the B2M gene (Fig. 3m, right).
Lastly, we assessed effects of the edits on inducing fetal hemoglobin (HbF) upon erythroid differentiation of the gene-edited HSPCs. We isolated CD34+ cells from the BM of the mice dosed in vivo with our VLPs and performed a colony assay in a semisolid medium containing cytokines promoting erythroid differentiation. We observed similar proportions of granulocyte/macrophage (GM) colony-forming units (CFU) and erythroid cell burst-forming units (BFU) in all treated animals as compared to the untreated group (Extended Data Fig. 6f). However, when looking at the HbF expression in our colonies by FC, we detected a higher percentage of HbF+ cells and a higher HbF mean fluorescence intensity (MFI) in the mice dosed with our VLPs, as compared to the untreated animals (used as controls for the expected background HbF induction resulting from this in vitro assay) (Fig. 3n,o). Overall, these data demonstrate that our BaEVTR-CoD VLP is effective with different editors and gRNAs and in loci of therapeutic relevance.
Assessing in vitro potency and specificity of CD133-targeted constructs
To restrict tropism to HSPCs by targeting HSPC-specific receptors, we also explored the potential of engineering the binder component of the NiV fusogen (Fig. 4a) to recognize the CD133 molecule expressed on human HSPCs. We chose CD133 as target because this receptor is absent from the surface of mature blood cell lineages43 while it is expressed on HSPCs at higher density than CD117 (Extended Data Fig. 7a).

a, Schematic representation of the NiV fusogenic complex (left) and NiV-CD133-retargeted LV with RetroNectin CoD (right). b, Percentage of GFP+ cells measured in CD34+ cells upon BaEVTR, VSV-G, NiV-CD133 or NiV-CD133-CoD LV transduction without CC110 prestimulation (resting condition) at different vector MOIs. Each curve represents a different vector batch. c, Titration curves of NiV-CD133 LV without CoD on CD34+ cells or CD3+ T cells in resting (R) or stimulated (S) conditions. Right, histograms and relative numeric labels show the expression of CD133 and percentage of CD133+ cells in each population at the time of transduction as measured by FC. d, Heat map showing, on a color gradient from white to red, the titers obtained by transducing different human primary cells (rows) using different LVs (columns) dose-matched on the basis of TU per resting CD34+ cells (Supplementary Figs. 7–9). BLOD, titer below limit of detection. e, Overview of an in vivo delivery study where BaEVTR or NiV-CD133-CoD LVs were dosed immediately after infusion of either huCD34+ cells or a mixture of huCD34+ cells and PBMCs from the same donor. f, Percentage of M (CD13+CD33+), B (CD19+) or T (CD3+) L cells on PB huCD45+ on day 7 or day 12 after infusion of CD34+ cells alone or CD34+ PBMCs. g, Percentage of GFP+ cells on BM HSPCs 12 days after BaEVTR and NiV-CD133-CoD LV vector dosing upon infusion of CD34+ cells alone or CD34+ PBMCs. h, Percentage of GFP+ cells on BM CD133+ measured 12 days after BaEVTR and NiV-CD133-CoD LV vector dosing upon infusion of CD34+ cells alone or CD34+ PBMCs. i, Stacked bars showing the relative contribution of huCD133+ cells on huBM or GFP+ cells in all mice after BaEVTR or NiV-CD133-CoD LV dosing in the CD34+ PBMC condition (NiV-CD133-COD versus BaEVTR on GFP+, P = 0.0049) (results relative to the CD34+ only condition in Extended Data Fig. 9a). j, Relative frequency of P, M, LP and L populations within the huBM or the GFP+ compartment on day 12 in the CD34+ PBMC condition. k, Percentage of GFP+ cells on PB huCD45+ cells measured 12 days after BaEVTR and NiV-CD133-CoD LV vector dosing upon infusion of CD34+ cells alone or CD34+ PBMCs. Numbers on curves or bars show the average values measured for given experimental conditions or time points. Data are presented as the mean values ± s.d. For bars, statistical significance was measured using a one-way ANOVA with Tukey’s multiple-comparison test and the exact P value is reported. Symbols represent biological replicates unless otherwise stated.
We tested the system first with LV vectors. We generated two CD133-targeted LV constructs (NiV-CD133) carrying the engineered fusogen alone or in combination with a CoD (Fig. 4a and Supplementary Material). In human HSPCs in vitro in the same conditions used above for the BaEVTR LV, we found that NiV-CD133 LV and BaEVTR LV showed similar titers on resting CD34+ cells (Fig. 4b). Comparing CD34+ cells (expected to express the CD133 target molecule) and CD3+ T cells (which are instead CD133−) to the broadly tropic VSV-G LV and BaEVTR LV as controls, we found that NiV-CD133 vectors efficiently transduced CD34+ HSPCs in both stimulated and resting conditions while exhibiting negligible levels of T cell transduction even upon cytokine activation. These results were obtained using NiV-CD133 at a higher physical particle concentration compared to the VSV-G LV or the BaEVTR LV (Extended Data Fig. 7b). Testing NiV-CD133 LV against HSPCs or T cells in vitro at different dilutions, we confirmed that the specificity for CD133+ HSPCs was maintained at all doses, irrespective of the presence of the CoD (Fig. 4c). In vitro tests in immortalized cell lines confirmed the tropism of our NiV-CD133 construct for CD133+ cells (Supplementary Text and Supplementary Fig. 6). The addition of CoD preserved the behavior of the engineered particles while increasing on-target titers with respect to the NiV-CD133 construct without CoD (Supplementary Fig. 6).
We next expanded our specificity analysis to a broader set of human primary cells, including endothelial cells, epithelial cells and primary human hepatocytes (PHHs). All vectors were equivalently tolerated at all doses by the primary cell lines (Supplementary Fig. 7). The results highlighted again the high selectivity of the NiV-CD133 LV for CD34+ cells relative to other CD133− cell types (Fig. 4d and Supplementary Figs. 8 and 9). Importantly, while enhancing transduction, the introduction of VF1 did not alter the overall tropism of the NiV-CD133 constructs (Supplementary Information Fig. 7). Across the remaining test panel, varying degrees of transduction were observed. The RNA-seq analysis underscores the correlation of these results with the expression levels of genes encoding known target receptors for VSV-G (LDLR) and BaEVTR (ASCT1/2), as well as CD133 and the CoD target molecules VLA-4 and VLA-5 (Supplementary Text, Supplementary Fig. 9 and Supplementary Data 2–4). Taken together, these data show the specific tropism of our NiV-CD133-CoD construct for human HSPCs.
Assessing in vivo potency and specificity of NiV-CD133-CoD LV
We next compared NiV-CD133-CoD LV and BaEVTR LV in the NBSGW model. Both the density of CD133 and the frequency of CD133+ cells change rapidly during early human engraftment (Supplementary Text and Extended Data Fig. 8a,b), making this experimental setting suboptimal for testing CD133-targeted particles. Therefore, we dosed our NiV-CD133-CoD LVs immediately after the infusion of CD34+ cells when the surface expression of the CD133 marker in huCD34+ cells would still be at physiological levels (Fig. 4e). To test specificity for HSPCs over mature blood cells, we infused a group of mice with a mix of 5.0 × 10⁵ CD34+ cells diluted in 1.0 × 10⁷ huCD133− human PB mononuclear cells (PBMCs) from the same donor. This was immediately followed by dosing of BaEVTR LV or NiV-CD133-CoD LV at 3.3 × 10⁸ transduction units (TU) per mouse and 7.8 × 10⁷ TU per mouse, respectively. We then measured transduction efficiency on day 12, comparing the results to the group of mice infused only with huCD34+ cells.
As expected, on day 7 and day 12 after infusion, the mice dosed with CD34+ PBMCs showed a substantially higher fraction of mature PB blood cells, including CD3+ T cells, acting as a potential off-target cell population compared to the mice dosed with CD34+ cells only (Fig. 4f and Extended Data Fig. 8c). The BaEVTR LV showed higher transduction of total huCD45+ cells in the CD34+ PBMC-infused group (24%) as compared to the NiV-CD133-CoD LV-treated mice (19%), although this difference was not significant (Extended Data Fig. 8d). Conversely, in the same group, we observed a significantly higher transduction of HSPCs in animals dosed with the NiV-CD133-CoD LV (20%) versus the BaEVTR LV (14%) (Fig. 4g). The NiV-CD133-CoD LV also showed higher specificity for BM CD133+ cells compared to the BaEVTR LV, regardless of the presence of human PBMC at the time of dosing (Fig. 4h,i). Concordantly, we detected more GFP+ cells in the P and LP cell fractions of animals receiving the NiV-CD133-CoD LV as compared to BaEVTR LV, which instead transduced the more mature M and L cell populations with higher efficiency (Fig. 4j and Extended Data Fig. 8e). Moreover, in the CD34+ PBMC-infused group, the NiV-CD133-CoD LV displayed significantly lower transduction of mature PB cells on day 12 compared to the BaEVTR LV (Fig. 4k). We further discuss the results obtained in this experimental setting and in a related experiment using short-term humanized mice in the Supplementary Text (Extended Data Fig. 9a–c). Overall, these data show the higher in vivo specificity of the NiV-CD133-CoD construct for human HSPCs compared to a broadly tropic vector.
Design and in vivo testing of NiV-CD133-CoD VLPs
We next explored whether this engineered envelope could be efficiently incorporated in a VLP. We tested multiple versions of an NiV-CD133 VLP (Fig. 5a), combining this envelope design with the CoD construct and an MLV or HIV capsid. All NiV-CD133 VLPs were able to efficiently edit resting CD34+ in vitro, although their titers were substantially lower than what was observed with the BaEVTR VLP design (Fig. 5b). The VLP showing the highest editing potency at higher dilutions was the NiV-CD133-CoD VLP combined with HIV gag. Therefore, we assessed the on-target potency of this construct in vivo. We used the same experimental conditions described above, dosing a BaEVTR VLP (at 1.8 × 10⁷ editing units (EU) per mouse) or the NiV-CD133-CoD VLP (at 5.7 × 10⁶ EU per mouse) immediately after CD34+ cell infusion (Fig. 5c).

a, Schematic representation of a NiV-CD133 VLP with RetroNectin CoD carrying Cas9 and B2M gRNA payload. b, Comparison of titration curves in resting CD34+ cells using BaEVTR VLP and different iterations of a NiV-CD133 VLP without CoD encompassing an MLV-derived or HIV-derived capsid gag. c, Schematic diagram of in vivo experiment based on single dosing of BaEVTR or NiV-CD133-CoD VLPs immediately after infusion of CD34+ cells. d, Percentage of B2M− cells measured by FC on PB huCD45+ cells over time upon dosing a BaEVTR or a NiV-CD133 VLP reported as the mean ± s.d. (n = 4 treated with BaEVTR VLP, n = 4 treated with NiV-CD133-CoD VLP). e, Percentage of B2M− cells measured by FC on PB huCD45+ cells (left), BM huCD45+ cells (middle) and BM huCD133+ cells (right) at week 8 after CD34+ cell infusion. f, Stacked bars showing the relative contribution of huCD133+ cells on human BM or GFP+ cells in all mice after BaEVTR or NiV-CD133-CoD VLP dosing. g, Comparison of B2M− cells versus B2M edited alleles in BM huCD45+ cells measured by FC versus HTS, respectively, at week 8 after BaEVTR VLP (left) or NiV-CD133-CoD VLP (right) dosing (mean ± s.d.). h, Comparison of B2M− cells versus B2M edited alleles in BM huCD45+ cells measured by FC versus HTS, respectively, at week 8 after BaEVTR VLP or NiV-CD133-CoD VLP dosing. i, Schematic diagrams of the vectors used (top) and the design of an in vivo experiment (bottom) based on IV dosing different LVs in FRG mice humanized with human hepatocytes. j, Heat map showing, on a color gradient from white to red, the percentage of GFP+ cells measured 12 days after LV dosing in each mouse or experimental group (rows) on human hepatocytes or NPCs (columns). The total dose delivered is reported as the TU per mouse for each LV. Numbers on curves or bars show the average values measured at given experimental conditions or time points. Data are presented as the mean values ± s.d. For bars, statistical significance was measured using a one-way ANOVA with Tukey’s multiple-comparison test and the exact P value is reported. Symbols represent biological replicates unless otherwise stated.
Despite having dosed the NiV-CD133-CoD VLP at a threefold lower functional dose as compared to the BaEVTR VLP, we achieved similar levels of editing in PB huCD45+ cells in both groups over time up to week 8 after dosing (Fig. 5d). While we did not observe significant differences in the percentage of PB edited huCD45+ cells at the end of the study (Fig. 5e, left), in the BM, we detected almost twofold higher editing with the BaEVTR VLP formulation (Fig. 5e, middle). However, when gating on the few CD133+ cells detectable in the BM at week 8 after humanization, the percentage of edited cells was comparable in the two treated groups (Fig. 5e, right). This was the result of a significantly higher enrichment of CD133+ cells within the B2M− cells generated with the NiV-CD133-CoD VLP versus the BaEVTR VLP (Fig. 5f), underscoring that the CD133-retargeted VLP displays a higher specificity for CD133+ cells as compared to BaEVTR. Measuring the editing efficiency by HTS, we could again highlight that the FC readout tends to underestimate the actual editing levels obtained over time with the two VLPs (Fig. 5g). The HTS data obtained on BM huCD45+ cells at week 8 confirmed that the two constructs reached a comparable editing efficiency (5.6% with the BaEVTR VLP versus 5.5% with the NiV-CD133-CoD VLP; Fig. 5h). Overall, these data demonstrate that our NiV-CD133-CoD VLP enables sustained in vivo gene editing in human hematopoietic cells, reflecting efficient delivery of gene-editing cargos to long-term HSPCs, even at low doses, because of its specificity for CD133+ cells.
In vivo avoidance of human hepatocytes by BaEVTR-CoD and NiV-CD133 particles
Both BaEVTR-CoD and NiV-CD133-CoD LVs showed a potential to transduce PHHs in vitro (Fig. 4d and Supplementary Fig. 7). To investigate this aspect, we exploited the Fah−/−Rag2−/−Il2rg−/− (FRG) mouse model, which can host a liver humanized with PHH44,45. At 84 days after liver humanization, we injected FRG mice with three IV doses of BaEVTR LV (1.3 × 10⁹ TU per mouse per dose), BaEVTR-CoD LV (1.3 × 10⁹ TU per mouse per dose), NiV-CD133-LV (7.3 × 10⁸ TU per mouse per dose) or NiV-CD133-CoD LV (2.2 × 10⁸ TU per mouse per dose), resembling the dosing schedule and levels used in the NBSGW mice (Fig. 5i). As a positive control, we dosed a group of animals with one single dose of a VSV-G LV (2.7 × 10⁹ TU per mouse per dose), which is known to transduce human hepatocytes. Unlike the in vitro measurements, we observed negligible transduction of both human hepatocytes and mouse nonparenchymal cells (NPCs; including Kupffer cells) in the humanized liver of the FRG mice 14 days after treatment with either the BaEVTR or the NiV-CD133 LVs with or without CoD compared to the transduction observed in the VSV-G LV-treated group (Fig. 5j).
These data were confirmed by liver histology for measuring colocalization of human nuclei and GFP signal (Extended Data Fig. 10). The contrasting findings with the in vitro titration experiment described above arise from the artificial perturbation of the physiological expression profile of the ASCT2 gene in PHH upon in vitro culture (Supplementary Text and Extended Data Fig. 8f–h). Thus, both BaEVTR-CoD and NiV-CD133-CoD envelopes avoid human hepatocytes upon systemic administration.
Discussion
We developed and tested envelope-engineered particles that enable efficient, specific gene editing in HSPCs both in vitro and in vivo while avoiding human hepatocytes.
To assess the potency and tropism of our engineered envelopes, we used LV vectors, which allowed for easy measurement of GFP expression using FC and histology, with the latter providing detailed insights into biodistribution in the BM (Supplementary Fig. 4) and liver (Extended Data Fig. 10). We first engineered BaEVTR, modifying the protease site and adding the CoD surface molecule. These modifications were tested in vitro and in vivo resulting in unaltered tropism but improved on-target potency. In this regard, the in vivo data shown in Fig. 1 indicate that the CoD construct may enhance access to long-term HSCs, as evidenced by higher transduction at late time points in all compartments in the BaEVTR-CoD LV-treated group.
The observation that AMD3100 boosts transduction even without relying on HSPC egress into the PB (Extended Data Fig. 3a–c) opens possibilities for further research. Potential mechanisms include enhanced HSPC proliferation, alterations in the BM microenvironment facilitating vector penetration, increased receptor expression on HSPCs or temporary disruption of the adhesion of HSPCs to their niche46,47.
After validating BaEVTR constructs in vitro and in vivo with LV vectors, we incorporated the envelope moieties into VLPs carrying gene-editing cargo. To our knowledge, no published study has assessed baboon-derived envelopes for in vivo gene editing in human HSPCs. The introduction of CoD in the BaEVTR VLP improved in vitro and in vivo potency similarly to the LV design. The results in Fig. 3e show an almost twofold higher editing efficiency in the PB CD13+CD33+ population 1 week after vector dosing using the BaEVTR-CoD VLP versus the BaEVTR VLP (47% versus 25%, respectively). At the same time point, the two VLP configurations displayed similar editing levels in the early PB L population (61% versus 60%, respectively). This suggests that CoD might have facilitated gene editing of M progenitors or multipotent stem cells during the early phases of BM engraftment.
To improve specificity for human HSPCs, we also engineered NiV fusogens to recognize the CD133 molecule. When paired with the CoD modification and tested in vivo in the presence of PB mature cell sinks, the retargeted NiV-CD133-CoD LV displayed significantly higher specificity for HSPCs as compared to BaEVTR vectors. The NiV-CD133-CoD VLPs exhibited lower in vitro potency than BaEVTR VLP, suggesting that further optimization is needed. Nonetheless, the lower in vitro titers were balanced in vivo by the higher specificity for HSPCs of the NiV-CD133-CoD VLP, resulting in editing efficacy similar to that of the BaEVTR VLP.
Upon systemic delivery in FRG mice hosting human hepatocytes, we observed minimal transduction of this key population by both engineered envelopes compared to the results obtained using a standard VSV-G formulation. To our knowledge, no previous data on the uptake of BaEVTR or Nipah particles by human hepatocytes in vivo have been published.
By studying two different envelope configurations, we demonstrated the modularity of VLPs for in vivo HSPC GT, showing that the CoD modification enhances particle potency across different envelope architectures and that hepatocyte avoidance can be achieved with multiple envelope designs. Accumulation in the liver is a limitation of current LNP systems. Moreover, using information available in Li et al.48, we estimate that LNP doses targeting HSPCs are typically much higher than the particle doses used in our study (~2.0 × 10¹⁶–2.0 × 10¹⁷ LNPs versus ~3.0 × 10¹² VLPs). Further studies are needed to compare VLPs and LNPs, given their differences in biodistribution, cellular uptake and gene delivery efficiency.
Another important topic for future research is the immunogenicity of our modified vectors. Pseudotypes and other viral components have been assessed for compatibility with in vivo delivery on the basis of the expected human immune recognition of these particles. For instance, while measles virus and NiV share similar glycoprotein subunits, NiV components have minimal neutralizing antibodies in the human population, in contrast to measles35,49. Additionally, LV vectors have been dosed systemically in immunocompetent nonhuman primate studies without adverse events, although immunosuppressants were sometimes used50. We anticipate that the human immune system could respond to BaEVTR-derived or NiV-derived envelopes, potentially limiting on-target bioavailability and redosing possibilities. Both BaEVTR-derived and NiV-derived envelopes appear resistant to human complement inactivation31,35,51.
Lastly, from a translational standpoint, our finding of stable gene editing in 27% of long-term HSCs achieved with VLPs may provide a basis for developing a gene-editing system for treating sickle cell disease52 and other hemoglobinopathies. In this regard, we demonstrated that VLPs are versatile and capable of carrying base editors and/or delivering gRNA for editing clinically relevant loci in human HSPCs.
Methods
Cloning of constructs
Amino acid sequences for VSV-G, BaEVTR31 and BaEVTR_MACA variant were codon-optimized, synthesized (ATUM or Twist) and cloned into pcDNA3.1 (VSV-G) or pTwist-CMV-β-globin (BaEVTR) plasmid backbones. Nipah G and F amino acid sequences were similarly codon-optimized and cloned into pCAGGS backbone. Blinded Nipah G protein (four point mutations in head) was engineered with binders through a flexible 3×G4S linker at the C terminus. G and F proteins also incorporated cytoplasmic tail modifications to enable pseudotyping35. Single-domain antibodies targeting huCD133 were obtained from the literature. Anti-CD133 scFv sequences were obtained from the literature and cloned into the blinded Nipah G protein C terminus (ATUM). The RetroNectin CoD sequence was determined by screening a library of constructs with combinatorial optimizations of the retronectin CS-1 and C-domains, transmembrane anchor domains and linkers between the different segments. These amino acid sequences were codon-optimized and cloned into pTwist-CMV-β-globin plasmid backbone. The lead sequence was selected on the basis of the highest titers on resting CD34+ cells. When Nipah G and F proteins were used in the context of retargeting to the huCD133 receptor, additional G cytoplasmic tail and linker modifications and F modifications were screened for improved on-target titers with this composition. Briefly, for the Nipah G modifications, cytoplasmic tails from related paramyxoviruses or from unrelated viruses that were identified to pseudotype retroviral vectors with high titers were synthesized and cloned into the G protein along with diversification of the linker between the G head and the binder (ATUM). Linker length and flexibility were varied according to sequences in the literature. The Nipah G variant library was screened for improvements in on-target versus off-target cell line titers. The top 20 variants were then screened in combination with the top Nipah F variants that were separately screened in the same manner. Lead G and F combinations were then made at larger scale and concentrated, followed by testing on primary CD34+ cells in vitro.
Cell cultures
HEK-293T Lenti-X cells were obtained from Takara (632180) and maintained in DMEM (Thermo Fisher Scientific, 10569-044) with 10% FBS (Thermo Fisher Scientific, 10437028). Suspension HEK-293T clones were generated and screened for highest titer production of BaEVTR LV vectors or MLV Gag–Cas9 VLP vectors. Briefly, the parental HEK-293T clone was obtained from the American Type Culture Collection (ATCC; CRL-3216). After adaptation to suspension culture and growth in serum-free medium, the top clones were tested for the production of LV vectors. The top ten clones with the highest p24 concentration in pg ml−1 and functional titer were then furthered screened for the highest functional titer of BaEVTR LV vectors or BaEVTR MLV VLP vectors. The top clone (SCC4180) was then further used for production and maintained in LV-MAX medium (Thermo Fisher Scientific, A4124004) when culturing. HEK-293T Lenti-X cells were engineered to overexpress huCD133 by standard LV transduction. Briefly, transfer plasmids were constructed to express full-length codon-optimized huCD133 (NP_006008.1) coding sequences, followed by an IRES–puromycin cassette. VSV-G-pseudotyped LV vectors were produced with transfer plasmid and HEK-293T Lenti-X cells were transduced at multiple vector doses. Then, 3 days after transduction, cells were treated with 1 μg ml−1 puromycin and assessed for huCD133 expression by FC after ten more days. Conditions with the appropriate expression levels were expanded and clonally sorted into 96-well plates. Clones were grown for 2–3 weeks and checked for expression stability by FC. Clones that maintained a high and tight expression level (HEK CD133 overexpression), with minimal silencing, were chosen for future experiments.
LV and VLP production
For LV vectors produced from adherent 293T Lenti-X cells, fusogen plasmids were combined with psPAX2 and a transgene vector containing enhanced GFP under the control of an SFFV promoter in the pSF backbone at a 0.2:0.3:0.5 ratio of fusogen, packaging and transgene, respectively. Plasmids were complexed with TransIT-293 transfection reagent (Mirus Bio, MIR 2706) and added to producer cells that were seeded the day prior, reaching 60–80% confluency at the time of transfection. The next day, a full medium exchange was performed. On the second day after transfection, the cell supernatant was collected and centrifuged at 1,000g for 10 min to pellet any producer cells. After passing through a 0.45-µm filter, crude material was aliquoted and frozen at −80 °C. For 100× or 300× concentrations, vectors were concentrated by 90-min ultracentrifugation over a sucrose cushion, followed by resuspension in formulation buffer. Concentrated LV vectors were aliquoted and frozen at −80 °C for later use. For LV vectors produced from suspension 293T clones, fusogen plasmids were combined with pALD-GagPol and pALD-Rev packaging plasmids (Aldevron), along with the pSF-SFFV-GFP transgene plasmid, at a 0.16:0.21:0.11:0.52 ratio of fusogen, Rev, GagPol and transgene, respectively. Plasmids were complexed with PEIpro transfection reagent (Polyplus/Sartorius) and added to producer cells that were seeded at 2.5 × 10⁶ cells per ml 1–2 h before transfection. For Nipah fusogens, the G and F plasmid ratio was optimized for the highest titer depending on the targeting binder. The next day, 5 mM sodium butyrate was added to the culture. On the second day after transfection, cell supernatant was harvested as described above and crude or concentrated LV vectors were obtained. For VLPs produced from suspension 293T clones, fusogen plasmids were combined with MLV-based or HIV-based GagPol and Gag–Cas9 plasmids, along with the gRNA plasmid at a 0.475:0.36:0.115:0.05 ratio of gRNA, MLV GagPol, MLV Gag–Cas9 and BaEVTR, respectively, or 0.364:0.238:0.238:0.128:0.032 ratio of gRNA, HIV GagPol, HIV Gag–Cas9, Nipah F and Nipah G, respectively. The Gag–Cas9 fusion strategy was adapted from a previously described protocol22,24. For 100× or 300× concentrations of LV or VLP vectors, freshly harvested crude supernatant was concentrated by 90-min ultracentrifugation or overnight (20–24 h) centrifugation at 4,100g over a sucrose cushion, followed by resuspension in formulation buffer. Concentrated LV vectors were aliquoted and frozen at −80 °C for later use. All absolute particle calculations reported in the manuscript for LVs and VLPs were performed on the basis of the results of ELISA assays for p24 (QuickTiter lentivirus titer kit, lentivirus-associated HIV p24) and p30 (QuickTiter MuLV core antigen ELISA kit), respectively.
Titer determination on cell lines and MOI calculation
To determine functional titer (TU per ml for LVs or EU per ml for VLPs), cell lines were seeded in 96-well tissue culture-treated plates (30,000 cells per well for all HEK-293T lines) and then crude or concentrated vectors were serial diluted onto the cells 2–4 h after cell seeding. In the case of NiV-CD133 constructs, titers were determined on the HEK CD133 overexpression cell line (generated as described above) because of the low permissiveness for transduction by CD133-targeted vectors of the parental HEK-293T cell line, which expresses low endogenous levels of huCD133. For LVs, cells were analyzed for GFP 3–4 days after vector addition. For VLPs, cells were analyzed for B2M knockout 6–7 days after vector addition. GFP and B2M were both analyzed by FC. Cells were harvested from the 96-well plates, washed and incubated with Draq7 viability dye to determine live cells before assessing GFP expression. For B2M readout, cells were blocked in cell stain buffer (Biolegend, 420201) and stained with anti-B2M antibody (1:100; Biolegend, 316306). After washing, cells were incubated with Draq7 and analyzed by FC. Functional titers were calculated from the vector dilution at which the percentage GFP+ or B2M− values were in the 5–20% range. When LVs or VLPs were dosed on the basis of MOI, specific calculations were used. The cell line titer that was determined above was used to calculate the total number of TUs in the given volumetric dose of vector to the cells in vitro. The total number of TUs applied was divided by the number of cells in the well at the time of vector delivery to determine the MOI.
In vitro transductions experiments
Cryopreserved granulocyte colony-stimulating factor (G-CSF) and Plerixafor-mobilized PB-derived CD34+ cells (Allcells) were thawed in StemSpan SFEM II medium (StemCell Technologies, 09065) supplemented with Glutamax (Thermo Fisher, 35050061) and penicillin–streptomycin (PS; Thermo Fisher, 15140122). Then, 100 μl of cells were plated in a round-bottom 96-well plate at 2 × 10⁵ viable cells per mL. After overnight rest in a 37 °C incubator, 100 μl of diluted vector + vectofusin (Miltenyi Biotec, 130-111-163) was added at a final concentration of 12 μg ml−1. After 24 h of transduction, StemSpan SFEM II medium containing 2× CC110 cytokine cocktail (StemCell Technologies, 02697) was added. After 6–7 days in culture with cytokines, we assessed the degree of transduction by GFP expression on a BD Fortessa instrument. The CC110 cytokine cocktail was excluded from media in the experimental groups described in Fig. 1c,d. To assess the off-target risk, cells were seeded at 100 µl according to the number from Supplementary Table 1 in flat-bottom 96-well plates before transduction. The vectors were normalized to receive 1 TU per cell on the basis of their titers on CD34+ primary cells. Vectors were prediluted on culture medium and vectofusin (Milteny Biotec, 130-111-163) was added to them to a final concentration of 12 µg ml−1. Then, 100 µl of the vector–vectofusin mix was added to the cells. Human PB pan-T (StemCell Technologies, 70024) and CD34+ cells were tested for transduction efficiency on their activated versus unactivated (resting) phase. The activated pan-T cells received interleukin 2 (IL-2) cytokine (StemCell Technologies, 78036.2) and CD3/CD28 activator beads (StemCell Technologies, 10991), whereas the activated CD34+ cells received a CC110 cytokine cocktail (StemCell Technologies, 02697) before transduction. The resting arms were activated 24 h after transduction with the same activation cocktail. A medium change was performed on day 4. The analysis of the transduction efficiency was performed by FC and VCN assay on day 7 after transduction. SupT1 (ATCC, CRL-1942), Raji (ATCC, CCL-86) and KG1A (ATCC, CCL-246.1) cell lines were cultured in RPMI medium + 10% FBS. HEK-293 Lenti-X cell lines were cultured in DMEM + 10% FBS. Caco-2 cell lines (ATCC, HTB-37) were cultured in EMEM + 10% FBS. Hulec-5a cell lines (ATCC, CRL-3244) were cultured in MCDB131 medium, without L-glutamine, supplemented with 10 ng ml−1 epidermal growth factor, 1 μg ml−1 hydrocortisone, 10 mM glutamine and 10% FBS. Human umbilical vein endothelial cells (HUVECs; ATCC, CRL-1730) were cultured in Vasculife medium + vasculife supplement. For primary cell culture, activated and resting pan-T cells were cultured in Immunocult supplemented with 10 ng ml−1 IL-2 and PS. Human pulmonary alveolar epithelial cells (ScienCell, 3200) were cultured on lysine-coated plates in alveolar (AEpiCM) medium supplemented with FBS, endothelial cell growth supplement (ECGS) and PS. Human renal epithelial cells (ScienCell, 4120) were cultured on lysine-coated plates in EpiCM medium supplemented with FBS, ECGS and PS. Human lymphatic endothelial cells were cultured on fibronectin-coated plates in endothelial cell medium supplemented with FBS, ECGS and PS. Human aortic endothelial cells (ATCC, PCS-100-011), human pulmonary artery endothelial cells (ATCC, PCS-100-022) and human coronary artery endothelial cells (ATCC, PCS-100-020) were cultured in Vasculife medium + supplement. PHHs (Lonza, HUCPI) were cultured in hepatocyte basal medium + supplement.
FC and FACS sorting
For in vivo studies, we used two FC panels. For the lineage-positive panel, cells were washed in PBS, incubated with Human TruStain FcX receptor block (Biolegend, 422302; 1:20 in BSA stain buffer (BD Biosciences, 554657)) and stained with an antibody cocktail consisting of CD34 PE (BD Biosciences, 348057), CD15 AF700 (Biolegend, 323026), CD14 APC (Biolegend, 367118), CD3 BV421 (Biolegend, 344834), CD19 PE/Cy7 (Biolegend, 302216), CD33 BV650 (Biolegend, 303430), CD13 BV650 (BD Biosciences, 740567), huCD45 BV711 (Biolegend, 304050), msCD45 BV605 (Biolegend, 103140) and CD41 PE/Dazzle 594 (Biolegend, 303732). Immediately before running the samples on FC, cells were stained with 7-AAD (Biolegend 420404). For the lineage-negative panel, cells were washed in PBS and stained with live–dead fixable near-infrared dead cell stain kit for 633-nm or 635-nm excitation (Invitrogen, L10119). Subsequently, cells were incubated with Human TruStain FcX receptor block (Biolegend, 422302; 1:20 in BSA stain buffer (BD Biosciences, 554657)). The lineage-negative antibody cocktail consisted of the following fluorescent antibodies: huCD45 PE/Cy7 (Biolegend, 304016), msCD45 BV605 (Biolegend, 103140), CD34 APC (BD Biosciences, 345804), CD38 PE/Cy5 (Biolegend, 103149), Pacific Blue anti-human lineage cocktail (CD3, CD14, CD16, CD19, CD20 and CD56; Biolegend, 348805), CD15 Pacific Blue (Biolegend, 980504), CD90 PE/CF594 (BD Biosciences, 562385), CD45RA BV711 (BD Biosciences, 740806), CD7 AF700 (BD Biosciences, 561603), CD10 BV785 (Biolegend, 312238), CD133 PE (Biolegend, 372804) and CD117 BV650 (Biolegend, 313222). For the detection of B2M− cells upon in vitro titration experiments, we used a B2M PE antibody (Biolegend, 316306). For in vivo readouts, we added to both panels a B2M FITC antibody (Biolegend, 316304). For FACS sorting of CD34+ cell subtypes, approximately 106 total CD34+ cells (StemCell Technologies, 70008) were stained in an antibody cocktail containing CD34 APC (BD Biosciences, 340441), lineage cocktail Pacific Blue (Biolegend, 348805), CD15 Pacific Blue (Biolegend, 980504), CD38 PE/Cy5 (Biolegend, 303508), CD90 PE/CF594 (BD Biosciences, 562385), CD45RA BV711 (BD Biosciences, 740806), CD7 AF700 (BD Biosciences, 561603), CD10 BV605 (Biolegend, 312222), CD135 PE (Biolegend, 313306) and DAPI (Thermo Fisher, D1306). Cells were sorted into various HSPC subpopulations using a BD Symphony S6 cell sorter.
In vivo experiments in NBSGW mice
All husbandry and experimental procedures were approved by the Institutional Animal Care and Use Committee of the Charles River Accelerator and Development Lab. NBSGW mice (Jackson Labs, strain 026622) were used. Mouse age at the time of study start was 6–9 weeks. On the day of cell dosing, huCD34+ cells (double-mobilized by 100 μg ml−1 G-CSF and 5 mg kg−1 AMD3100) were thawed from cryovials stored in liquid nitrogen, washed with sterile PBS and resuspended at 300,000–500,000 cells in 200 μl of PBS. For the PBMC spike-in study, 500,000 CD34+ cells and 107 PBMCs from the same donor were mixed in 200 μl of PBS and dosed IV. On the day of LV or VLP dosing, LV or VLP was thawed and kept on ice. LV or VLP was premixed with vectofusin (Miltenyi Biotec, 130-111-163) at a final concentration of 12 µg ml−1 exactly 10 min before dosing in vivo. At study completion, mice were anesthetized using CO2 and organs were collected for processing and downstream FC and histopathology analysis. Tissues were processed as follows. For PB, 75–100 µl of whole mouse blood was added to a V-bottom 96-well plate. Then, 75–100 µl of PBS (Gibco, 10010-023; 1:1 ratio with the blood) was added to the wells containing blood samples. Samples were pipetted up and down to mix the blood and PBS. The 96-well plate containing the blood–PBS mixture was spun at 1,000g for 2 min and the supernatant was discarded. Next, 200 µl of ACK lysis buffer (Gibco, A10492-01) was added to each well that contained a blood pellet. The pellets were mixed well in the ACK buffer by pipetting and incubated at room temperature for 3 min. Cells were spun again at 1,000g for 2 min and the supernatant was discarded. Next, 200 µl of 1× PBS (Gibco, 10010-023) was added to each well. Cells were spun again at 1,000g for 2 min and the supernatant was discarded. Then, 200 µl of ACK lysis buffer (Gibco, A10492-01) was added to each well a second time. The pellets were mixed well in the ACK buffer by pipetting and incubated at room temperature for 3 min. Cells were spun again at 1,000g for 2 min and the supernatant was discarded. Next, 200 µl of 1× PBS (Gibco, 10010-023) was added to each well. Cells were spun again at 1,000g for 2 min, the supernatant was discarded and cells were resuspended in 1× PBS (Gibco, 10010-023) and transferred over to a 96-well U-bottom plate for staining for FC. For BM, muscle and residue tissue was removed from the femur and tibia with sterile forceps and scissors. Bones were transferred into a sterile mortar containing 5 ml of ice-cold 1× PBS (Gibco, 10010-023) and smashed with a pestle. The crushed bones were filtered through a 40-µm nylon cell strainer to remove solid fragments, the volume of the filtrate was brought up to 10 ml of PBS (Gibco, 10010-023) and the filtrate was centrifuged at 300g for 10 min. Following centrifugation, the supernatant was removed, the cell pellet was resuspended in 10 ml of 1× PBS (Gibco, 10010-023) and filtered through a 40-µm nylon cell strainer. The filtrate was centrifuged for 5 min at 350g (4 °C). Following centrifugation, the supernatant was removed and cells were resuspended in 1× PBS for staining for FC. Spleens were isolated from mice and stored on ice in 1× PBS (Gibco, 10010-023). To start tissue processing, spleens were placed into 2 ml of ACK lysis buffer (Gibco, A10492-01). Spleens were dissociated by repeatedly crushing between two frosted sides of a glass microscope slide. The dissociated splenic tissue was incubated at room temperature in 2 ml of ACK lysis buffer (Gibco, A10492-01) for 10 min. The dissociated splenic tissues were then filtered through a 40-µm nylon cell strainer to remove solid fragments, the volume of the filtrate was brought up to 10 ml in PBS (Gibco, 10010-023) and the filtrate was centrifuged at 350g for 5 min. Following centrifugation, the supernatant was removed and the cell pellet was resuspended in 10 ml of 1× PBS (Gibco, 10010-023) and filtered through a 40-µm nylon cell strainer. The filtrate was centrifuged for 5 min at 350g (at 4 °C). Following centrifugation, the supernatant was removed and cells were resuspended in 1× PBS for staining for FC.
In vivo experiment in FRG mice
The FRG humanized liver mouse model was used to assess vector potential to transduce human hepatocytes in vivo. Mice were maintained and the study was conducted by Yecuris. FRG mice have an FAH−/− mutation, which enables ablation of the murine hepatocytes, creating a niche for engraftment of donor hepatocytes. They also have Rag2−/−Il2rg−/− immunodeficiency mutations, which allow persistence and expansion of engrafted human hepatocytes. The NPCs of the liver (Kupffer cells and endothelial cells) remained of murine origin. After confirmation of >80% humanization by human albumin levels (>3.5 mg ml−1), mice were dosed with ~300× concentrated vector at a 5 ml kg−1 dose. Unless otherwise noted, mice were killed 14 days after injection and livers were isolated for tissue dissociation and FC analysis of the human and murine cell populations. For FC analysis, hepatocytes were stained using hASGR1 AF647 (R&D Systems, FAB43941R, clone 950203), mCD81 PE (Biolegend, 104906, clone Eat-2) and eBioscience eFluor780 viability dye (Thermo Fisher). NPCs were stained with F40/80 PE (Biolegend, 123110, clone BM8), CD31 APC (Biolegend, 102410, clone 390) and eBioscience eFluor780 viability dye (Thermo Fisher).
VCN analysis
Cells were washed with PBS once to get rid of the media. Suspension cells were centrifuged at 500g for 5 min and the supernatant was discarded before washing. DNA was extracted using QuickExtract DNA extraction solution (BioSearch Technologies, QE0905T) by incubating the cells with solution at 65 °C for 6 min, followed by 98 °C for 2 min. They were then diluted at least threefold with ultrapure water to avoid the inhibition of PCR because of the abundant presence of the extraction solution. A PCR master mix was prepared at a final volume of 20 µl containing ddPCR Supermix for Probes, no UTP (Bio-Rad, 186-3024), delU3 primer/probe mix (DelU3 forward primer, 5′-GGAAGGGCTAATTCACTCCC-3′; DelU3 reverse primer, 5′-GGTTTCCCTTTCGCTTTCAGG-3′; DelU3 probe, 5′-/56-FAM/TGCCCGTCTGTTGTGTGACTCTG/3IABxFQ/-3′) and ArX primer/probe mix (ArX forward primer, 5′-TATGTTCAGATGCCCATTAGGG-3′; ArX reverse primer, 5′-CTTGCTCAAAGGACTGTGATTTC-3′; ArX probe, 5HEX/AGTGCCTTT/ZEN/CAGATGGAAACGGGT/3IABkFQ/). Then, 5 µl of the diluted DNA was added to the PCR master mix. A Bio-Rad QX200 AutoDG droplet generator was used to generate droplets. The droplets were then subjected to PCR at 95 °C for 10 min, with 40 cycles at 95 °C for 10 s, followed by 60 °C for 60 s and 98 °C for 10 min. The PCR-amplified material was then read on the droplet reader.
HTS analysis of genome editing
Genomic DNA was purified using QIAamp DNA micro kit (Qiagen, 56304) according to the manufacturer’s manual. Purified genomic DNA was first amplified with primer pairs spanning around 200–300 bp at the target edited regions using Q5 hot start high-fidelity 2× master mix (Qiagen, M0494L) for 35 cycles (98 °C for 60 s, followed by 35 cycles of 98 °C for 10 s, 66 °C for 20 s and 72 °C for 30 s, with a final step of 72 °C for 2 min, before holding at 4 °C). Second amplifications were performed with indexed primer pairs using Q5® hot start high-fidelity 2× master mix (Qiagen, M0494L) for 12 cycles (98 °C for 60 s, followed by 12 cycles of 98 °C for 10 s, 65 °C for 20 s and 72 °C for 30 s, with a final step of 72 °C for 2 min, before holding at 4 °C). Pooled indexed libraries were cleaned up by AMPure XP solid-phase reversible immobilization reagent (Beckman Coulter, A63881) and measured with a 4150 Tapstation system (Agilent) using D5000 DNA ScreenTape assays (5067-5588/89, Agilent) for size range and a Qubit 4 fluorometer (Thermo Fisher Scientific) with high-sensitivity dsDNA assays (Thermo Fisher Scientific, Q33231) for quantification before clustering on Illumina sequencers. Forward and reverse primers complementary to sequences upstream and downstream of the region of interest were designed with 5′–3′ overhang adaptors. A subsequent limited-cycle amplification step was performed to add multiplexing indices and Illumina sequencing adaptors. An amplicon of ~200 bp was amplified by the primer pair. Libraries were normalized, pooled and sequenced on an Illumina MiSeq or NextSeq depending on throughput required and availability: forward overhang, 5′ CTCTTTCCCTACACGACGCTCTTCCGATCT-[locus-specific seq]; reverse overhang, 5′ CTGGAGTTCAGACGTGTGCTCTTCCGATCT-[locus-specific seq] (additional details in Supplementary Information Table 2). The amplicon sequencing data were used to characterize and quantify the nuclease editing activity at the intended, on-target genomic target loci. The paired-end FASTQ files were trimmed for readthrough of the Illumina TruSeq adaptor and amplicon primers using Cutadapt version 2.10. Quality filtering (≥Q30) and quality control were performed with fastp version 0.20.0. FASTQ files were aligned to the human genome reference (GRCh38) using Minimap2 version 2.24. Reads that had a mate overlap a 15-bp window around the target site were included. The R version 4.0.3 package CrispRVariants version 1.18.0 was used to characterize and quantify editing. Read pairs were classified as follows: wild-type reads, reads identical to the reference genome; single-nucleotide variants (SNVs), reads that only included mismatches to the reference; indel-containing reads, reads that included single contiguous insertions or deletions; complex variant, reads containing complex variants, multiple indels and/or SNVs; other, reads containing more complex structural rare variants. Percentage editing served as an estimate of overall measure of nuclease activity at a given target and was calculated as ((total reads – SNV-only reads – wild-type reads)/total reads) × 100. Similarly, the percentage of editing variants was calculated as (total reads carrying a given editing variant/total reads) × 100. For the samples dosed with the BCL11A ABE cargo, reads that contained an exact match to the 7 bp upstream and downstream of the guide were quantified for the presence of the two A>G mutations in and directly after the GATA1-binding site. Read counts for each of the motif variants (TTTATCG, TTTGTCA and TTTGTCG) were obtained for the four BCL11A ABE-edited samples.
RNA-seq analyses
For RNA-seq analyses of PHH and FRG-derived PHH cells (Extended Data Fig. 8), samples were sent to GENEWIZ (Azenta Life Sciences) where total RNA was extracted from each sample, followed by library prep according to Illumina specifications and sequencing with 150-bp paired-end reads on an Illumina HiSeq platform. The resulting raw sequencing reads were checked with MultiQC version 1.14 and trimmed with Cutadapt version 4.4 and fastp version 0.23.2. The trimmed reads were mapped to the human genome reference (GENCODE GRCh38 v43) using the STAR version 2.7.10b aligner and quantified with salmon version 1.9.0. The PHH FRG samples were mapped to the human genome reference and the mouse genome reference (GENCODE GRCm39 v32) and only the human genes were used in subsequent analyses for these samples. Genes with ≤2 counts in <3 samples were filtered from subsequent analyses. Differential expression analyses for pairwise comparisons were processed using DESeq2 version 1.40.2. Differently expressed genes were defined with |log2FC| > 2 and adjusted P value < 0.01. Multiple groups were compared using a one-way analysis of variance (ANOVA) and Bonferroni correction with α = 0.05. Genes that passed the correction threshold were visualized in R version 4.3.0 with pheatmap version 1.0.12.
For the HEK-293 Lenti-X, Hulec-5a, HUVEC, Raji, SupT1 and human primary cells (Supplementary Fig. 9b), sample processing and sequencing for RNA-seq were completed by GENEWIZ (Azenta Life Sciences) with 150-bp paired-end reads on an Illumina HiSeq platform. The RNA-seq reads were processed by GENEWIZ, where the reads were mapped to the human genome reference (GRCh38) using STAR aligner. A single representative sample was chosen from publicly available data for each of the Caco-2 and KG1A cell lines and is indicated in the legend information in Supplementary Table 3 (refs. 53,54). The log2-transformed CPM normalized counts (edgeR version 3.42.4) were visualized in R version 4.3.0 with pheatmap version 1.0.12 for the immortalized and primary cell lines with the six genes of interest (LDLR, ASCT1, ASCT2, CD133, VLA-4 and VLA-5). No statistical analyses were conducted in this context.
Insertion site analysis
The insertion site analysis shown in Extended Data Fig. 1e,f was performed as previously described55. Briefly, the protocol was based on the fragmentation by sonication of genomic DNA isolated from CD34+ cells, followed by ligation of a linker cassette (LC) containing a known sequence and a unique molecular identifier (UMI) for abundance estimation. Each ligation product underwent two rounds of exponential PCR amplification using long terminal repeat-specific and LC-specific primers. An additional PCR step was carried to introduce into each sample Illumina adaptor sequences and a known sample index sequence for multiplexing. A pooled sample library was then loaded on a MiSeq System (Illumina) and the sequence analysis was performed using the IS-Seq computational pipeline55. For the bubble plot generation and the Shannon diversity index calculation reported in Extended Data Fig. 1e,f, we used UMI counts as the insertion site abundance quantification method.
Histology
All immunohistochemistry was performed on the Leica Bond RX fully automated staining instrument running Bond 6.0 software. Antibodies were all diluted in SignalStain antibody diluent (Cell Signaling Technology, 8112). Dual chromogenic staining of human nucleoli (Abcam, 190710, clone NM95) at 1:4,000 dilution was performed using the bond polymer refine detection system (Leica Biosystems, DS9800) with EDTA antigen retrieval using bond epitope retrieval 2 (Leica Biosystems, AR9640) for 20 min at 90 °C. Staining of GFP (Cell Signaling Technology, 2956, clone D5.1) at 1:50 dilution was performed using the bond polymer refine red detection system (Leica Biosytems, DS9390) with EDTA antigen retrieval using bond epitope retrieval 2 (Leica Biosystems, AR9640) for 20 min at 90 °C. Counterstaining was performed using hematoxylin from the bond polymer refine red detection system (Leica Biosytems, DS9390). Slides were air-dried, submerged in xylene and cover-slipped using CV mountant (Leica Biosystems, 14070936261). Whole-slide imaging was performed on the Leica Versa 200 microscope at ×40 magnification. TIF files were extracted from the Leica SVS scan files using Leica Aperio Imagescope version 12.4.6.5003. Sternum and liver samples were fixed in 10% neutral buffered formalin (Epredia, 534801) for 48 h at room temperature. Following fixation, sternum samples were decalcified overnight using Formical-2000 decalcifier (StatLab, 1314). Both sternum and liver samples were processed on the Leica Pearl tissue processor through a graded ethanol series (Fisher, A962P4) as follows: 70%, 80%, 90%, 100%, 100% and 100%. This was followed by three xylene solvent steps (Fisher, X3P) and three paraffin steps (Paraplast, Leica, 39601006) using the default 12-h protocol. Samples were embedded using the Leica HistoCore Arcadia embedding center and sectioned at 5 µm on the Leica HistoCore Multicut microtome.
Assessment of HbF induction in CFU
CD34+ sorted human HSPCs harvested from mouse BM were seeded at 5 × 10² cells per tube in Methocult classic (StemCell Technologies, 04444, lot 1000138489). Two plates were seeded per animal from the same Methocult tube. Cells were incubated in StemSpan SFEM II medium with PS (Gibco). On day 14, cells were removed from the incubator and counted for BFU/CFU and GMs. Flow analysis was performed using antibodies CD71 BB700 (BD Biosciences, 746082, clone M-A712), HbF PE (BD Biosciences, 560041, clone 2D12) and CD235a PE/Cy7 (BD Biosciences, 563666, clone HIR2).
Reporting summary
Further information on research design is available in the Nature Portfolio Reporting Summary linked to this article.
Data availability
RNA-seq data are available from the Gene Expression Omnibus under accession number GSE267423. Source data are provided with this paper.
References
-
Pellin, D. et al. A comprehensive single cell transcriptional landscape of human hematopoietic progenitors. Nat. Commun. 10, 2395 (2019).
-
Anjos-Afonso, F. & Bonnet, D. Human CD34+ hematopoietic stem cell hierarchy: how far are we with its delineation at the most primitive level? Blood 142, 509–518 (2023).
-
Thompson, A. A. et al. Gene therapy in patients with transfusion-dependent β-thalassemia. N. Engl. J. Med. 378, 1479–1493 (2018).
-
Kanter, J. et al. Biologic and clinical efficacy of LentiGlobin for sickle cell disease. N. Engl. J. Med. 386, 617–628 (2022).
-
Biffi, A. et al. Lentiviral hematopoietic stem cell gene therapy benefits metachromatic leukodystrophy. Science 341, 1233158 (2013).
-
Frangoul, H. et al. CRISPR–Cas9 gene editing for sickle cell disease and β-thalassemia. N. Engl. J. Med. 384, 252–260 (2021).
-
Ferrari, G., Thrasher, A. J. & Aiuti, A. Gene therapy using haematopoietic stem and progenitor cells. Nat. Rev. Genet. 22, 216–234 (2021).
-
Kohn, D. B. Gene therapy for blood diseases. Curr. Opin. Biotechnol. 60, 39–45 (2019).
-
Al-Saif, A. M. Gene therapy of hematological disorders: current challenges. Gene Ther. 26, 296–307 (2019).
-
Tucci, F., Galimberti, S., Naldini, L., Valsecchi, M. G. & Aiuti, A. A systematic review and meta-analysis of gene therapy with hematopoietic stem and progenitor cells for monogenic disorders. Nat. Commun. 13, 1315 (2022).
-
Goyal, S. et al. Acute myeloid leukemia case after gene therapy for sickle cell disease. N. Engl. J. Med. 386, 138–147 (2022).
-
Hsieh, M. M. et al. Myelodysplastic syndrome unrelated to lentiviral vector in a patient treated with gene therapy for sickle cell disease. Blood Adv. 4, 2058–2063 (2020).
-
Jones, R. J. & DeBaun, M. R. Leukemia after gene therapy for sickle cell disease: insertional mutagenesis, busulfan, both, or neither. Blood 138, 942–947 (2021).
-
Kanter, J. et al. Lovo-cel gene therapy for sickle cell disease: treatment process evolution and outcomes in the initial groups of the HGB-206 study. Am. J. Hematol. 98, 11–22 (2023).
-
Uchida, N. et al. Fertility-preserving myeloablative conditioning using single-dose CD117 antibody–drug conjugate in a rhesus gene therapy model. Nat. Commun. 14, 6291 (2023).
-
Griffin, J. M., Healy, F. M., Dahal, L. N., Floisand, Y. & Woolley, J. F. Worked to the bone: antibody-based conditioning as the future of transplant biology. J. Hematol. Oncol. 15, 65 (2022).
-
Bernardo, M. E. & Aiuti, A. The role of conditioning in hematopoietic stem-cell gene therapy. Hum. Gene Ther. 27, 741–748 (2016).
-
Bearman, S. I. et al. Regimen-related toxicity in patients undergoing bone marrow transplantation. J. Clin. Oncol. 6, 1562–1568 (1988).
-
Breda, L. et al. In vivo hematopoietic stem cell modification by mRNA delivery. Science 381, 436–443 (2023).
-
Algarni, A. et al. In vivo delivery of plasmid DNA by lipid nanoparticles: the influence of ionizable cationic lipids on organ-selective gene expression. Biomater. Sci. 10, 2940–2952 (2022).
-
Kim, H. et al. Lipid nanoparticle-mediated mRNA delivery to CD34+ cells in rhesus monkeys. Nat. Biotechnol. https://doi.org/10.1038/s41587-024-02470-2 (2024).
-
Banskota, S. et al. Engineered virus-like particles for efficient in vivo delivery of therapeutic proteins. Cell 185, 250–265 (2022).
-
Raguram, A., Banskota, S. & Liu, D. R. Therapeutic in vivo delivery of gene editing agents. Cell 185, 2806–2827 (2022).
-
Mangeot, P. E. et al. Genome editing in primary cells and in vivo using viral-derived Nanoblades loaded with Cas9–sgRNA ribonucleoproteins. Nat. Commun. 10, 45 (2019).
-
Tang, X. et al. Functions and regulatory mechanisms of resting hematopoietic stem cells: a promising targeted therapeutic strategy. Stem Cell Res. Ther. 14, 73 (2023).
-
Lév, C., Verhoeyen, E. & Cosset, F. L. Surface engineering of lentiviral vectors for gene transfer into gene therapy target cells. Curr. Opin. Pharmacol. 24, 79–85 (2015).
-
Sinn, P. L. et al. Gene transfer to respiratory epithelia with lentivirus pseudotyped with Jaagsiekte sheep retrovirus envelope glycoprotein. Hum. Gene Ther. 16, 479–488 (2005).
-
Takano, K. A. et al. Envelope protein-specific B cell receptors direct lentiviral vector tropism in vivo. Mol. Ther. 32, 1311–1327 (2024).
-
Levy, C. et al. Baboon envelope pseudotyped lentiviral vectors efficiently transduce human B cells and allow active factor IX B cell secretion in vivo in NOD/SCIDγc−/− mice. J. Thromb. Haemost. 14, 2478–2492 (2016).
-
Bernadin, O. et al. Baboon envelope LVs efficiently transduced human adult, fetal, and progenitor T cells and corrected SCID-X1 T-cell deficiency. Blood Adv. 3, 461–475 (2019).
-
Girard-Gagnepain, A. et al. Baboon envelope pseudotyped LVs outperform VSV-G-LVs for gene transfer into early-cytokine-stimulated and resting HSCs. Blood 124, 1221–1231 (2014).
-
Colamartino, A. B. L. et al. Efficient and robust NK-cell transduction with baboon envelope pseudotyped lentivector. Front. Immunol. 10, 2873 (2019).
-
Tsukamoto, T. & Okada, S. The use of RetroNectin in studies requiring in vitro HIV-1 infection of human hematopoietic stem/progenitor cells. J. Virol. Methods 248, 234–237 (2017).
-
Frank, A. M. & Buchholz, C. J. Surface-engineered lentiviral vectors for selective gene transfer into subtypes of lymphocytes. Mol. Ther. Methods Clin. Dev. 12, 19–31 (2018).
-
Bender, R. R. et al. Receptor-targeted Nipah virus glycoproteins improve cell-type selective gene delivery and reveal a preference for membrane-proximal cell attachment. PLoS Pathog. 12, e1005641 (2016).
-
Singh, R. K. et al. Nipah virus: epidemiology, pathology, immunobiology and advances in diagnosis, vaccine designing and control strategies—a comprehensive review. Vet. Q. 39, 26–55 (2019).
-
Radek, C. et al. Effective retroviral transduction of primary T cells and hematopoietic stem cells using the soluble transduction enhancer: vectofusin-1. Mol. Ther. 25, 220–221 (2017).
-
Tomás, H. A. et al. Improved GaLV-TR glycoproteins to pseudotype lentiviral vectors: impact of viral protease activity in the production of LV pseudotypes. Mol. Ther. Methods Clin. Dev. 15, 1–8 (2019).
-
Hanenberg, H. et al. Optimization of fibronectin-assisted retroviral gene transfer into human CD34+ hematopoietic cells. Hum. Gene Ther. 8, 2193–2206 (1997).
-
Lee, H. J. et al. Retronectin enhances lentivirus-mediated gene delivery into hematopoietic progenitor cells. Biologicals 37, 203–209 (2009).
-
McIntosh, B. E. et al. Nonirradiated NOD,B6.SCID Il2rγ−/−KitW41/W41 (NBSGW) mice support multilineage engraftment of human hematopoietic cells. Stem Cell Rep. 4, 171–180 (2015).
-
Richter, M. F. et al. Phage-assisted evolution of an adenine base editor with improved Cas domain compatibility and activity. Nat. Biotechnol. 38, 883–891 (2020).
-
Yin, A. H. et al. AC133, a novel marker for human hematopoietic stem and progenitor cells. Blood 90, 5002–5012 (1997).
-
Lisowski, L. et al. Selection and evaluation of clinically relevant AAV variants in a xenograft liver model. Nature 506, 382–386 (2014).
-
Hatit, M. Z. C. et al. Species-dependent in vivo mRNA delivery and cellular responses to nanoparticles. Nat. Nanotechnol. 17, 310–318 (2022).
-
Samuelson, C. et al. AMD3100 redosing fails to repeatedly mobilize hematopoietic stem cells in the nonhuman primate and humanized mouse. Exp. Hematol. 93, 52–60 (2021).
-
Wang, H. et al. In vivo HSC transduction in rhesus macaques with an HDAd5/31 vector targeting desmoglein 2 and transiently overexpressing cxcr4. Blood Adv. 6, 4360–4372 (2022).
-
Li, S. et al. Payload distribution and capacity of mRNA lipid nanoparticles. Nat. Commun. 13, 5561 (2022).
-
Palomares, K. et al. Nipah virus envelope-pseudotyped lentiviruses efficiently target ephrinB2-positive stem cell populations in vitro and bypass the liver sink when administered in vivo. J. Virol. 87, 4794–4794 (2013).
-
Milani, M. et al. Phagocytosis-shielded lentiviral vectors improve liver gene therapy in nonhuman primates. Sci. Transl. Med. 11, eaav7325 (2019).
-
Johnson, J. B., Borisevich, V., Rockx, B. & Parks, G. D. A novel factor I activity in Nipah virus inhibits human complement pathways through cleavage of C3b. J. Virol. 89, 989–998 (2015).
-
Fitzhugh, C. D. et al. At least 20% donor myeloid chimerism is necessary to reverse the sickle phenotype after allogeneic HSCT. Blood 130, 1946–1948 (2017).
-
Zhao, Z. et al. Therapeutic targeting of metabolic vulnerabilities in cancers with MLL3/4-COMPASS epigenetic regulator mutations. J. Clin. Invest. 133, e169993 (2023).
-
Wang, H. et al. Disruption of dNTP homeostasis by ribonucleotide reductase hyperactivation overcomes AML differentiation blockade. Blood 139, 3752–3770 (2022).
-
Yan, A. et al. IS-Seq: a bioinformatics pipeline for integration sites analysis with comprehensive abundance quantification methods. BMC Bioinformatics 24, 286 (2023).
Acknowledgements
We would like to acknowledge E. Verhoeyen, C. Dunbar and J. Tisdale for their scientific input and consultancy. We are also grateful for the support of the leadership team at Sana Biotechnology including chief executive officer S. Harr and former chief strategy officer D. Williams. Lastly, we are indebted to the many scientists, people managers, technical support and administrators at our locations in Cambridge, South San Francisco and Seattle for their great assistance and collaboration.
Ethics declarations
Competing interests
All authors are or have been employees of Sana Biotechnology.
Peer review
Peer review information
Nature Biotechnology thanks the anonymous reviewers for their contribution to the peer review of this work.
Additional information
Publisher’s note Springer Nature remains neutral with regard to jurisdictional claims in published maps and institutional affiliations.
Extended data
Extended Data Fig. 1 Characterization of the in vitro culture conditions for transducing human HSPCs.
(a) Experimental scheme of the in vitro transduction protocol with or without (w/o) CC110 pre-stimulation (CC110 = StemSpan™ CC110 cytokine cocktail). (b) in vitro cell counts (left panel) and viability (right panel) of CD34+ cells from two donors (D1 and D2) w/o CC110 pre-stimulation over the 8 days of culture. Statistical analysis performed at end of culture on + CC110 vs – CC110 pre-stimulation conditions (3 technical replicates per donor). (c) Highest transduction achieved with a VSV-G or BaEVTR LV. Each dot represents a different vector batch. (d) Highest MOI employed for each LVs. Each dot represents a different vector batch. (e) Bubble plots showing insertion sites contributing >0.01% of the insertion site pool upon transduction of CD34+ cells in resting or stimulated conditions with a BaEVTR LV at MOI 25. The dimension of the bubble is proportional to the size of the clone. The name of the gene closest to each insertion site is reported inside the bubble. (f) Shannon Diversity Index of the insertional repertoire (white bars) and percent of GFP+ cells (colored bars) from the same transduction experiment of panel f. (Notes: numbers on curves or bars show average values measured at given experimental conditions or timepoints; Data are presented as mean values +/- SD; for curves statistical significance was measured using two-tailed unpaired t-test with Welch’s correction and reported as **P < 0.01; symbols represent biological replicates unless otherwise stated).
Extended Data Fig. 2 In vitro transduction of resting CD34+ cells.
(a) Transduction of resting CD34+ cells using a VSV-G or a BaEVTR LV at different MOIs. (b) Transduction of individual HSPC subtypes in resting conditions with a BaEVTR LV at two different MOIs. (HSC = Hematopoietic Stem Cells, MPP = Multipotent Progenitors, CMP = Common Myeloid Progenitors, GMP = Granulocytes/Macrophage Progenitors, MEP = Megakaryo/Erythroid Progenitors) (c) Transduction of CD34+ cells in resting vs stimulated conditions measured at day 8 (D8) using a BaEVTR LV at MOI 25. (d) Average Vector Copy Number (VCN) measured in CD34+ cells in resting vs stimulated conditions at day 8 (D8) using a BaEVTR LV at MOI 25. (e) Titers obtained in resting CD34+ cells with a BaEVTR LV (grey dots), BaEVTR LV with the protease modification (MACA) (red dots), or the BaEVTR LV MACA with the additional co-display modification (CoD) (yellow-filled dots). (Notes: numbers on curves or bars show average values measured at given experimental conditions or timepoints; Data are presented as mean values +/- SD; symbols represent biological replicates unless otherwise stated).
Extended Data Fig. 3 Pilot in vivo studies dosing LVs in the short-term humanization experimental setting.
(a) Overview of a pilot in vivo delivery study where NBSGW mice were humanized via infusion of CD34+ cells and then treated on D7 with a saline solution or AMD3100, followed by IV dosing of BaEVTR or VSV-G LVs. (b) Percent of GFP+ cells on BM huCD45+ cells, HSPCs, or hematopoietic stem cells (HSC) measured at D12 after LV dosing following saline or AMD3100 treatment (UT = untransduced control group). (c) Percent of huCD45+ cells measured in the BM, PB or spleen (SPL) at day of LVs dosing (AMD = AMD3100). (d) Overview of an in vivo delivery study where NBSGW mice were humanized via infusion of CD34+ cells and then treated at D(day)7 or D7-9 with 1 or 3 IV doses of BaEVTR LV respectively. AMD3100 was infused 2 hours prior to each vector dosing. (e) Percent of GFP+ cells on huCD45+ cells (left panel) or HSPC subtypes (right panel) at day 12-15 of humanization (5 days after last LV dose) following 1 or 3 BaEVTR LV dose(s). (f) Average Vector Copy Number (VCN) measured in the PB of the NBSGW mice receiving a standard BaEVTR LV or a BaEVTR-CoD LV dosed at day 7 of humanization (experiment described in Fig. 1h). (Notes: numbers on curves or bars show average values measured at given experimental conditions or timepoints; Data are presented as mean values +/- SD; for bars statistical significance was measured using one-way ANOVA with Tukey’s multiple comparison test and the exact p-value is reported; symbols represent biological replicates unless otherwise stated).
Extended Data Fig. 4 In vitro editing of HSPC subtypes and assessment of editing variants.
(a) Editing efficiency measured by FC or HTS in the resting HSPC bulk population and in FACS-sorted resting HSPC subtypes using a BaEVTR VLP at MOI 83. (b) Stacked bar showing the relative contribution of editing variants in the resting HSPC bulk population and in FACS-sorted resting HSPC subtypes using a BaEVTR VLP at MOI 16 (left panel) or at MOI 83 (right panel) (SNV = single nucleotide variants). (Notes: numbers on curves or bars show average values measured at given experimental conditions or timepoints; Data are presented as mean values +/- SD; symbols represent biological replicates unless otherwise stated).
Extended Data Fig. 5 Assessment of in vivo editing in short-term and long-term humanized mice using a BaEVTR VLP.
(a) Overview of an in vivo delivery study where NBSGW mice were humanized via infusion of CD34+ cells and then treated at D7 or D7-9 with 1 or 3 IV doses of BaEVTR VLP respectively. AMD3100 was infused 2 hours prior to each vector dosing (b) Percent of B2M- cells on huCD45+ cells measured by FC in the BM 5 days after last VLP dose. (1x = 1 dose of VLP 2 h after 1 dose of AMD3100 at D7 post-humanization; 3x = 3 doses of VLP, 1 per day over 3 days at D7-D9 post-humanization, each dose 2 h after 1 dose of AMD3100). (c) Percent of B2M- cells on HSPC subtypes measured by FC in the BM 5 days after last VLP dose. (d) Stacked bar showing the relative contribution of editing variants measured in vivo at D12 after 1 or 3 doses of a BaEVTR VLP. (e) Overview of an in vivo delivery study where NBSGW mice were humanized via infusion of CD34+ cells and then treated at Week 9 with 3 doses of AMD3100 followed by a single infusion of BaEVTR VLP. (f) Percent of huCD45+ cells observed in the BM and PB at time of vector dosing (Week 9). (g) Percent of B2M- cells on huCD45+ cells and HSPCs measured by FC in the BM or PB of NBSGW mice at Wk11 after humanization (Week 2 after vector dosing). (Notes: numbers on curves or bars show average values measured at given experimental conditions or timepoints; Data are presented as mean values +/- SD; for bars statistical significance was measured using one-way ANOVA with Tukey’s multiple comparison test and the exact p-value is reported; symbols represent biological replicates unless otherwise stated).
Extended Data Fig. 6 In vitro potency of the BaEVTR-CoD VLP, in vivo experimental schemes, in vivo editing variants and colony assay results from the experiment of Fig. 3j-o.
(a) Titers obtained in resting CD34+ cells with a BaEVTR VLP (grey squares), BaEVTR VLP with the protease modification (MACA) (red squares), or the BaEVTR VLP MACA with the additional co-display modification (CoD) (yellow-filled squares). (b) Representative titration curves in resting CD34+ cells using a BaEVTR VLP with the protease modification (MACA) (red squares) or the BaEVTR VLP MACA with the additional co-display modification (CoD) (yellow-filled squares). (c) Schematic diagram of an in vivo experiment based on IV dosing of a BaEVTR VLP or a BaEVTR-CoD VLP (both vectors carrying the MACA modification) over three consecutive days at day 7-9 post-humanization in mice treated with AMD3100 prior to each vector infusion. (d) Stacked bar showing the relative contribution of editing variants measured in BM huCD45+ cells at Week 8 after BaEVTR VLP or a BaEVTR-CoD VLP dosing. (e) Overview of an in vivo delivery study where NBSGW mice were humanized via infusion of CD34+ cells and, at D7-9 post-humanization, dosed IV with a BaEVTR-CoD VLP carrying the payloads described in Fig. 3j,k. AMD3100 was infused 2 hours prior to each vector dosing. (f) Percent of CFU-GM (Colony Forming Unit -Granulocytes Macrophages) or BFU-E (Burst Forming Units- erythroid cells) over the total Colonies Forming Units (CFU) generated from CD34+ cells isolated from the BM of treated mice from the experiment described in panel (e) and in Fig. 3j-o. (Notes: numbers on curves or bars show average values measured at given experimental conditions or timepoints; Data are presented as mean values +/- SD; symbols represent biological replicates unless otherwise stated).
Extended Data Fig. 7 CD133 receptor density and in vitro on-target specificity using a NiV-CD133 LV.
(a) Histogram plots showing the expression of CD117 (top panels) or CD133 (bottom panels) in CD34+ vs CD34- human mobilized peripheral blood cells from two separate donors. (b) Transduction achieved in CD34+ or CD3+ cells in Resting (R) or Stimulated (S) conditions using a VSV-G, BaEVTR, or NiV-CD133 LV, each vector used at two different doses. The percentage of GFP+ cells is reported inside each gate, while the physical particles per well (each well containing 2.0E + 04 cells in 200ul) are shown at the top of each column.
Extended Data Fig. 8 Changes in CD133 expression in vivo in NBSGW mice, transduction of BM cells from the experiment of Fig. 4j, and transcriptional analyses on primary human hepatocytes.
(a) Representative histogram plot (top panel) and summary curves (bottom panel) showing the changes in percent CD133 + cells and CD133 MFI (calculated within the CD133+ population) over the first 12 days of NBSGW humanization after CD34+ cells infusion. (b) Percent of phenotypically defined HSPCs (Lin-CD34+ cells) within the CD133+ vs CD133- population over the first 12 days of NBSGW humanization after CD34+ cells infusion. (c) Percent of huCD45+ cells measured in the PB over the course of the study after infusion of CD34+ cells alone or CD34 + PBMC (see experiment described in Fig. 4e). (d) Percent of GFP+ cells on BM huCD45+ cells measured 12 days after BaEVTR and NiV-CD133-CoD LV vector dosing upon infusion of CD34+ cells alone or CD34 + PBMC (see experiment described in Fig. 4e). (e) Percent of GFP+ cells on the main human BM cell fractions measured 12 days after BaEVTR and NiV-CD133-CoD LV vector dosing upon of CD34 + PBMC infusion (see experiment described in Fig. 4e). (f) Heatmap showing the differentially expressed genes among three differently treated human primary hepatocytes (PHH): freshly thawed after cryopreservation (CRYO), thawed, and cultured for 24 h at time of vector dosing for in vitro titration experiments (24 h), and isolated from FRG mice at time of vector dosing for in vivo experiments (FRG). Each group is comprised of three samples, and the differentially expressed genes are the results of the analysis of variance (ANOVA) among the three groups. Expression values are displayed as log2 normalized counts plotted on a color gradient from blue to white to red as per legend on the right. The legend on the left of the heatmap displays additional information for each sample or gene. Unsupervised clustering based on this set of genes was performed among groups and displayed through the dendrogram at the top of the heatmap. (g) Dendrogram with corresponding scale (number of genes) displaying the results of the ANOVA in panel e. (h) Expression of genes encoding for different cell receptors important for the binding and fusion of the VSV-G (LDLR), BaEVTR (ASCT1, ASCT2), or NiV-CD133 (CD133) LVs as well as for the interaction with the CoD construct (VLA-4, VLA-5) as measured by RNA-seq in the three groups. Genes are reported with their relative aliases. Normalized expression values are plotted as log2 normalized counts on a color gradient from blue to white to red as per legend on the right. (Notes: numbers on curves or bars show average values measured at given experimental conditions or timepoints; Data are presented as mean values +/- SD; for bars statistical significance was measured using one-way ANOVA with Tukey’s multiple comparison test and the exact p-value is reported, n.s.= not significant; symbols represent biological replicates unless otherwise stated).
Extended Data Fig. 9 In vivo on-target transduction enrichment for CD133+ cells.
(a) Stacked bars showing the relative contribution of huCD133+ cells on huBM or GFP+ cells in all mice after BaEVTR or NiV-CD133-CoD LV dosing in the CD34only condition relative to the in vivo experiment described in Fig. 4e. (***BaEVTR vs NiV-CD133-CoD LV P = 0.0049) (b) Overview of an in vivo delivery study where BaEVTR or NiV-CD133-CoD LVs were dosed at D7-9 (each day 2 h after AMD3100 administration) after infusion of either CD34+ cells or a mixture of CD34+ cells and PBMC from the same donor. (c) Stacked bars showing the relative contribution of CD133+ cells on huBM or GFP+ cells in all mice after BaEVTR or NiV-CD133-CoD LV dosing in the CD34 + PBMC condition relative to the in vivo experiment described in panel (b). Statistical analysis performed comparing mice treated with BaEVTR LV vs NiV-CD133-CoD LV. (Notes: numbers on curves or bars show average values measured at given experimental conditions or timepoints; Data are presented as mean values +/- SD; for bars statistical significance was measured using one-way ANOVA with Tukey’s multiple comparison test and the exact p-value is reported; symbols represent biological replicates unless otherwise stated).
Extended Data Fig. 10 Histology on liver sections from FRG humanized mice dosed with LVs.
Dual Chromogenic staining of Human Nucleoli (brown signal) and GFP (red signal) on representative liver sections isolated from VSV-G, BaEVTR, BaEVTR-CoD, NiV-CD133, and NiV-CD133-CoD LV dosed FRG mice at 14 days after vector dosing (see experimental scheme described in Fig. 5i). This experiment was repeated on liver sections from one additional mice per each treatment group and generated similar results. The magnification used to generate each panel is shown at the top of the figure. The scale bar relative to each magnification is reported on the top panels.
Supplementary information
Source data
Rights and permissions
Open Access This article is licensed under a Creative Commons Attribution-NonCommercial-NoDerivatives 4.0 International License, which permits any non-commercial use, sharing, distribution and reproduction in any medium or format, as long as you give appropriate credit to the original author(s) and the source, provide a link to the Creative Commons licence, and indicate if you modified the licensed material. You do not have permission under this licence to share adapted material derived from this article or parts of it. The images or other third party material in this article are included in the article’s Creative Commons licence, unless indicated otherwise in a credit line to the material. If material is not included in the article’s Creative Commons licence and your intended use is not permitted by statutory regulation or exceeds the permitted use, you will need to obtain permission directly from the copyright holder. To view a copy of this licence, visit http://creativecommons.org/licenses/by-nc-nd/4.0/.
About this article

Cite this article
Botchkarev, V.V., Harrington, S., Stoppato, M. et al. In vivo gene editing of human hematopoietic stem and progenitor cells using envelope-engineered virus-like particles. Nat Biotechnol (2025). https://doi.org/10.1038/s41587-025-02915-2
-
Received:
-
Accepted:
-
Published:
-
Version of record:
-
DOI: https://doi.org/10.1038/s41587-025-02915-2