Introduction
Hepatocellular carcinoma, or HCC, is the most frequent cancer of the primary liver and represents one of the foremost causes of cancer-linked mortality in universal. About 75 to 85% of all liver cancers are hepatocellular in origin, as the incidence of this disease rises globally due to chronic liver illness, infections from hepatitis B and C viruses, alcoholism, and metabolic syndromes, such as NAFLD1,2. The tumor develops initially asymptomatic and is therefore diagnosed at an advanced stage, hence giving very limited options for treatment and a poor prognosis3. The disease recurs at a high rate, and conventional therapies have been practically ineffective; this disease has shown rapid progression. New findings in genomics indicate that HCC is highly heterogeneous at molecular and cellular levels. This heterogeneity includes complex interactions with tumor cells, immune cells, fibroblasts, and endothelial cells within the tumor microenvironment. The conventional methods of bulk RNA sequencing cannot capture this heterogeneity and simple average gene expression across a wide number of different cell populations.
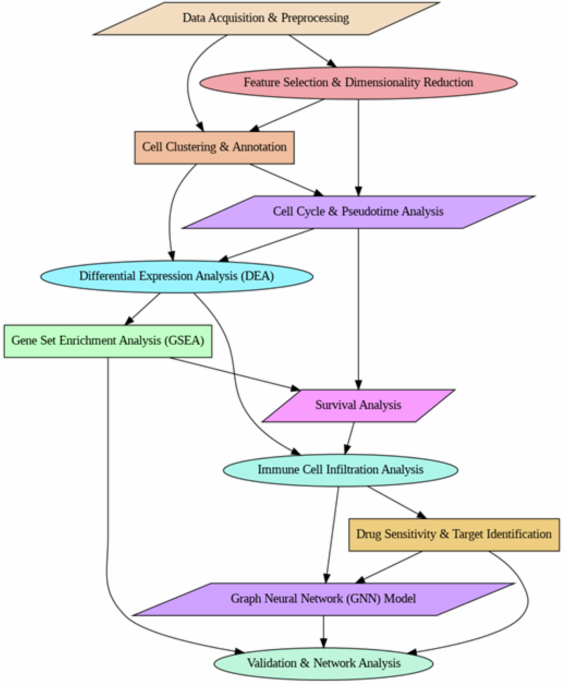
Single-cell RNA sequencing has been established to be a significant technology for dissecting cellular diversity and discovering tumor-specific molecular signatures, thus providing a more precise understanding of tumor evolution, mechanisms that lead to immune evasion, and mechanisms of drug resistance4. Although earlier studies by scRNA-seq have indicated significant transcriptional differences between tumor and normal liver tissues, the need remains to map the microenvironment of HCC and discover novel therapeutic targets. Here, as highlighted in Fig. 1, the scRNA dataset was used to examine the transcriptional landscape of HCC at the single-cell intensity. Research methods involved thorough preprocessing of data, feature selection, PCA for reducing dimensionality, and cell-type annotation by applying UMAP and t-SNE for clustering5,6,7. Differential gene expression analysis was done to identify crucial molecular drivers in the sequence of HCC, and Gene Set Enrichment Analysis (GSEA) for dysregulated pathways. Pseudotime trajectory analysis was used to infer cellular differentiation states. Immune cell infiltration analysis suggested that TAMs are key regulators of the HCC microenvironment. Gene expression correlates with survival by doing the survival analysis, and drug sensitivity analysis was carried out to find potential therapeutic targets. PCR array screening revealed that immune-related genes are increased in HBV-infected HepG2.2.15 cells, with SERPINA1, FN1, and IL1R2 being particularly abundant in immune pathways. ELISA confirmed that patients had high AAT (SERPINA1) levels correlated with ALT. The findings point to AAT as a possible biomarker for monitoring HBV-related liver disease development8. Single-cell RNA sequencing demonstrated that reduced NOTCH1/NOTCH2 mutations elevated SAMD4B, destabilized APOA2 mRNA via 2′-O-Methylation modification. Reduced APOA2 reduced PD-L1 expression improved immunological responses. This regulation altered the tumor microenvironment, resulting in a robust synergistic immunochemotherapy that increased survival in advanced HCC patients by 2.3-fold9.

Research workflow.
While previous researchers have discovered immunological markers in HCC, they frequently lack predictive frameworks for drug discovery. Research combines GNN-based medication repurposing with single-cell transcriptional data to rank drug-gene interactions with great prediction accuracy. This integrated method increases biomarker identification while also broadening the field of AI-driven medication discovery in liver cancer.
Results
Data acquisition and preprocessing
The scRNA-seq dataset GSE166635 is downloaded, containing 25,189 cells from the HCC tumor-adjacent normal tissue (HCC1) and cells from the tumor tissue (HCC2). Cells with fewer than 200 or more than 2500 genes are removed to eliminate noise from empty droplets and doublets. Figure 2A displays quality control metrics: the number of detected genes per cell (nFeature_RNA), the count of total RNA per cell (nCount_RNA), and the percent of gene expression that is mitochondrial (percent.mt). Figure 2B is the same QC metrics with a better display of the difference in distribution. Interestingly, HCC1 has higher gene and RNA counts, and HCC2 has more mitochondrial gene content, indicating more stress or poorer-quality cells in the tumor tissues. The dataset is filtered to remove cells that had more than 5% mitochondrial content for the maintenance of data integrity. For a final dataset with ~2794 high-quality cells, the proportion of mitochondrial reads is kept at an average of 3.2%, below the commonly used threshold of 5%, thus confirming the absence of excessive apoptotic or stressed cells. The correlation of nFeature_RNA and nCount_RNA in Fig. 2C shows a strong positive correlation (0.91). This indicates that higher total RNA counts correspond to higher detected gene numbers across both conditions. Similarly, Fig. 2D correlates percent.mt and nCount_RNA with a weak negative correlation −0.04, meaning that even though the expression of mitochondrial genes changes little despite altered RNA content, higher mitochondrial percentages are a sign of compromised cell integrity.

A, B Violin plots of RNA features, counts, and mitochondrial percentages. C, D Scatter plots show a correlation between RNA counts, detected genes, and mitochondrial content.
Dimension reduction feature selection
Feature selection is performed to identify genes that contribute most significantly to cellular heterogeneity. After normalizing, a variance-stabilizing transformation is applied, and 2000 HVGs are selected based on dispersion criteria, contributing to around 85% of the total variance. The 2000 gene selection captured ~85% of the total variance while minimizing noise from low-expressing genes. PCA is applied to confirm whether the selected HVGs have effectively captured the variance structure of the data. The initial calculation of 40 PCs is evaluated with the proportion of variance explained by each component in the scree plot in Fig. 3A, allowing for the resolution of the optimal integer of Principal Components (PCs) for further downstream clustering analysis, marked with a red dashed line that approximates the cutoff and suggests the number of PCs retained for further analysis. The top 10 PCs are selected using the elbow plot explains 78% of the total variance. This shows that the first 10 PCs are considerably enriched for biological signals (p < 0.05), while subsequent PCs largely collected noise. Furthermore, k-fold cross-validation of clustering performance revealed that using more than ten PCs did not significantly increase cell type resolution.

A Elbow plot showing the optimal number of principal components for clustering. B UMAP plot of cells from HCC1 and HCC2 samples. C Seurat-based clustering of cells into distinct groups. D UMAP plot with SingleR-based cell-type annotation, revealing various immune and non-immune cell populations.
Cell clustering and annotation
A sensitivity analysis is carried out by altering the Louvain resolution from 0.3 to 1.0, confirming stable clustering at 0.5 with ARI. SingleR annotation used the HPCA and Blueprint/ENCODE datasets, with confidence measured by correlation scores and reference-based assignment stability, resulting in robust and biologically meaningful cell-type identification. Graph-based clustering is performed with the Louvain algorithm at a resolution of 0.5, identifying 11 distinct clusters. UMAP in Fig. 3B, where the cells are colored by sample group (HCC1(normal tissue) vs HCC2 (Tumor tissue), showing divergent clustering profiles that suggest there are transcriptional differences between the tumor and surrounding tissue; Fig. 3C represents Seurat-based clustering results, in each color represents a separate cluster, denoting the presence of heterogeneous populations of cells; Fig. 3D shows a UMAP plot with SingleR-based cell type annotations, whereby clusters are colored with their corresponding predicted cell identity. The identified cell types included the following: 35% hepatocytes, 15% fibroblasts, 10% endothelial cells, 20% monocytes, and 20% macrophages. Lastly, this research demonstrates a varied range of immune and non-immune cell populations, including macrophages, monocytes, hepatocytes, fibroblasts, endothelial cells, and other cell types, signifying the liver microenvironment in the context of hepatocellular carcinoma.
Pseudotime trajectory analysis
The research revealed a progressive transcriptional shift along the pseudotime trajectory, with AFP, GPC3, and MKI67 designating early-stage HCC cells and EPCAM, SPP1, and CD44 being abundant in later stages, indicating greater malignancy and stemness. Furthermore, to detect overexpression of TGF-β and Wnt/β-catenin pathway genes (e.g., CTNNB1, AXIN2) along the trajectory, consistent with recognized HCC development pathways. Trajectory inference using Slingshot reconstructed differentiation pathways, mapping cellular transitions along a pseudotemporal axis. PCA-based visualization in Fig. 4A highlighted individual cells are color-coded based on their assigned clusters. The pseudotime gradient suggested progressive differentiation of tumor cells from an early stage to a more malignant state, indicating potential drivers of hepatocellular carcinoma development—Fig. 4B: Trajectory analysis of the Slingshot trajectory in PCA space. The cells are colored according to their pseudotime values. Black lines are the inferred differentiation pathways suggesting the continuous trajectory from an initial cellular state toward the more differentiated ones. A yellow-to-red gradient along the pseudotime reflects the dynamic transition from the initial toward more differentiated states.

A PC1 vs. PC2 pairwise plot showing clustered cells in PCA space. B Slingshot trajectory analysis with pseudo time gradient, illustrating inferred cellular transitions and differentiation pathways based on principal component dimensions.
The data suggest a continuous development pattern in HCC, with cells moving from early to advanced stages. The nonlinear trajectory indicates that many evolutionary routes reflect tumor heterogeneity. Higher pseudotime values are associated with aggressive phenotypes, indicating late-stage malignancy. PC1 depicts early to late evolution, whereas PC2 indicates molecular alterations. The research identifies unique tumor cell types at various phases, offering information about HCC progression, possible biomarkers, and targeted therapies for better diagnosis and treatment techniques.
Cell cycle analysis
Cell cycle states are deduced with the use of phase-specific markers that categorize cells into G1 (50%), S (30%), and G2/M (20%) phases. UMAP provides crucial insights into the scRNA-seq analysis of tumor-adjacent (HCC1) and tumor tissues (HCC2) in liver cancer. Cell cycle phases (G1, S, and G2M), shown in Fig. 5A are separated and show phase-specific transcriptional activity. The Heatmap of the top variable genes across cell cycle phases in Fig. 5B highlighted immune-related genes like IGHG1, IFNG, and CCL20 exhibited phase-dependent expression, indicating the immune system’s involvement in tumor progression.

A UMAP clustering by cell cycle phase. B Variable gene heatmap. C DEG heatmap between HCC1 and HCC2. D Volcano plot of DEGs.
Differential expression analysis (DEA)
DEA is conducted to determine differential gene expression between HCC1 and HCC2 by identifying transcriptional changes. There are 1178 DEGs with an adjusted p value < 0.05. Of them, 926 were up-regulated in HCC2, and 252 were down-regulated. The most upregulated DEGs between HCC1 and HCC2 shown in Fig. 5C, notably reflect significant downregulation of genes such as APOA2, ALB, and SERPINA1 in tumor tissues, suggesting dysregulation of pathways involved in metabolic and immune function in association with hepatocellular carcinoma (HCC). Figure 5D shows differential expression analysis, with significantly dysregulated genes (log2FC > 1, padj < 0.05), such as APOA2, SERPINA1, and FTL, being among the most significant candidates with potential as biomarkers for HCC progression.
The figure demonstrates TME variability via varied gene expression across cell cycle phases and tumor subtypes, which influences drug sensitivity estimates. The observed heterogeneity in UMAP clustering, heatmaps, and differential expression analysis indicates that gene expression dynamics influence tumor response to therapies. Integrating TME variability into drug response models improves predictive accuracy, allowing for more tailored and effective cancer treatment options.
Protein-protein interaction (PPI)
Using STRINGdb, a PPI analysis of 1178 DEGs in liver cancer is constructed. The network presented in Fig. 6A shows interactions among the key proteins, with nodes representing genes and edges signifying functional associations. Figure 6B is a hub gene network extracted using Cytohubba. Here, the top hub genes are highlighted based on centrality measures. APOE and GAPDH are key nodes (red), suggesting they are highly connected and play a regulatory role. Other significant genes, such as SERPINA1, CTSB, GRN, AIF1, etc., are colored according to their importance, with highly interconnected genes appearing in warmer colors, from yellow to orange. This network analysis provides critical insights into the molecular interactions driving liver cancer and assists in prioritizing targets for drug discovery.

A STRING network showing protein-protein interactions among DEGs in liver cancer. B Cytohubba hub gene network highlighting key regulatory genes (APOE, GAPDH) with color-coded significance (red: highest, yellow: lowest).
Gene set enrichment analysis (GSEA)
Gene set enrichment analysis (GSEA) is conducted to uncover the dysregulated biological pathways in hepatocellular carcinoma (HCC), including lipid metabolism, glucose metabolism, immune response, and cellular interaction. Network visualization in Fig. 7 of the genes enriched in various biological pathways from DisGeNET, Reactome, and KEGG, such as Liver Cirrhosis, Cholesterol Metabolism, and Alzheimer’s disease (Late), shares molecular connections with genes like APOE, LIPA, and S100A9. To promote clarity in pathway enrichment interpretation, related pathways are classified into functional groups. Table 1 outlines major enriched pathways, linked genes, and their biological functions, allowing for a structured comprehension of their roles in HCC progression. Some genes in lipid metabolism, particularly FABP5, FABP1, and AIF1, have roles in transporting fatty acids and lipid storage within cells is critical in cholesterol metabolism pathways for APOE, APOC1, and LIPA. Other glycolysis or gluconeogenesis-related genes, such as GAPDH, ALDOA, and ENO1, also provide significant insights regarding the role in energy production and metabolic adaptation of HCC. The Innate Immune System pathway shows inflammatory responses related to liver diseases, where genes such as TYROBP and FCER1G are significantly involved in the tumor microenvironment. Figure 8A shows that enriched biological processes, including cytokine production regulation, immune effector processes, and antigen processing, are all significant for hepatic immune modulation and tolerance, as well as cell-cell adhesion and lipid metabolism, contributing to hepatic tissue integrity and metabolic homeostasis. Molecular functions (Fig. 8B) include cadherin binding, MHC protein complex binding, and oxidoreduction-driven transmembrane transporter activity, all contributing to detoxification, immune surveillance, and hepatocyte interactions. In contrast, protease binding is critical for protein digestion and blood coagulation, and electron transfer activity supports hepatocyte metabolic pathways. The cellular component analysis in Fig. 8C reveals the strong enrichment in lysosomal membranes, vacuolar membranes, and endocytic vesicles, indicating detoxification, endocytosis, and metabolic processing of the liver. At the same time, structures such as the lumen of secretory granules, focal adhesion sites, and cell-substrate junctions are essential for the attachment of the liver cells to the extracellular matrix and for the secretion of bile. These findings provide a comprehensive understanding of the molecular pathways involved in HCC, offering insights into potential therapeutic targets and disease mechanisms.

Network visualization of key genes DisGeNET, Reactome, KEGG.

A Biological Processes (BP)—Involves immune regulation, lipid metabolism, and antigen processing. B Molecular Functions (MF)—Highlights cadherin binding, oxidoreduction activity, and protease interactions. C Cellular Components (CC)—Emphasizes vesicles, lysosomes, and membrane structures critical for liver metabolism.
Gene scoring and expression analysis
Gene expression profiles of tumor-adjacent HCC1 tissues and tumor tissues HCC2 in liver cancer are also profiled using gene scores. CustomGeneScore1 is shown over the different cell identities in Fig. 9A. The variations of gene scores in the cluster indicate differing transcriptional states in the data, pointing to the roles that cell populations play within the tumor microenvironment. Figure 9B displays density plots of the expression levels of some of the most significant DEGs between HCC1 and HCC2. APOA2, ALB, SERPINA1, and APOE are expressed at much higher levels in HCC1 than in HCC2, suggesting that these genes play a role in normal liver function and are downregulated in tumor tissues. FTL, on the other hand, has a bimodal distribution, suggesting heterogeneous expression within the tumor. Based on the expression of XIST, the known regulator for X-chromosome inactivation is essential in promoting liver carcinoma. These aspects provide insight toward understanding transcription changes in HCC and identify its potential biomarker for disease progress and therapeutic candidate.

A Violin plot of CustomGeneScore1 across cell identities. B Density plots of key DEGs between HCC1 and HCC2, highlighting differences in expression patterns.
Kaplan–Meier survival analyses
Kaplan–Meier survival analysis plots six genes within liver cancer against comparing high and low-expression profiles. Figure 10A, APOA2, shows no significant prognosis, with a HR = 0.75, p = 0.13. Figure 10B shows XIST with worse survival and a higher expression HR = 1.42, p = 0.05, indicating an oncogene. Figure 10C shows SERPINA1, for the survival outcome is not different (HR = 0.75, p = 0.14). Figure 10D (ALB) shows a protective function: high expression correlates with improved survival (HR = 0.56, p = 0.0012). Figure 10E (FTL) is associated with worse survival at higher expression levels (HR = 1.52, p = 0.027), thus acting as a putative risk factor. Figure 10F (APOE) shows a significant association of high expression with a survival benefit (HR = 0.6, p = 0.0043), reinforcing its tumor-suppressive function. These results reveal that ALB and APOE act as protective genes, whereas XIST and FTL work as risk factor genes in liver cancer prognosis.

A–F Kaplan–Meier plots showing overall survival of patients stratified by high and low expression of APOA2, XIST, SERPINA1, ALB, FTL, and APOE. Hazard ratios (HR) with 95% confidence intervals and log-rank P-values are indicated.
The survival data used in the Kaplan–Meier analysis are sourced from the GSE166635 dataset. Genes are dichotomized based on median expression, are introduces a loss of information by reducing continuous variables to two categories. The lack of significant p-values for some genes is due to factors like sample size, heterogeneity, or lack of power. Future studies will aim to increase sample sizes, refine statistical models, and consider continuous expression values for improved power and accuracy in survival analysis.
APOE and ALB prevent HCC by controlling lipid metabolism, immunological function, and oxidative stress. APOE prevents lipid buildup, modifies macrophage polarization to minimize immune evasion, and suppresses inflammation; ALB regulates oncotic pressure, binds toxins, and lowers oxidative stress. Their downregulation interferes with these protective processes, causing metabolic dysfunction and tumor growth, emphasizing their importance as prognostic indicators and possible therapeutic targets in HCC.
Immune cell infiltration
Immune cell infiltration analysis via CIBERSORT showed the presence of a tumor microenvironment containing 2.5-fold infiltrated macrophages. Tumor-associated macrophages (TAMs) are depicted; Correlation heatmaps of top gene expression with resistant unit penetration across numerous cancer kinds are depicted as Fig. 11A (APOA2), is shows to have dotted feeble correlations with immune cells in many cancers, suggesting a minor role in the modulation of immunity. Figure 11B (ALB) indicates the involvement of the gene when connected in some cancer types. Figure 11C (XIST) shows positive and negative correlations in various cancers, further emphasizing the diverse immunological impact. These results indicate that each gene has a unique interaction pattern with the immune system, and XIST is the most variable in its correlation across different tumor types. Figure 11D (FTL) shows high HCC, BRCA subtypes, and LUAD correlations. Figure 11E (SERPINA1) is significantly interacting with COAD and GBM. Figure 11F (APOE) with significant interacting terms in PAAD and SKCM. So, these are possibly influencing an immune response, regardless of the type of cancer. Immune infiltration data is integrated for a better view by using TIMER 2.0, CIBERSORTx, or xCell. The outcome of these studies provides insights into the potential immunomodulatory roles of FTL, SERPINA1, and APOE, opening avenues for novel therapeutic interventional strategies targeting immune pathways in cancer

A–F Heatmaps showing the correlations between APOA2, ALB, XIST, FTL, SERPINA1, and APOE expression levels and the infiltration of various immune cell types across multiple cancer types. Color intensity indicates the strength and direction of the correlation, with significant (p ≤ 0.05) and non-significant (p > 0.05) associations annotated.
The research reveals the diverse immunomodulatory effects of genes such as APOA2, ALB, XIST, FTL, SERPINA1, and APOE in various malignancies. While certain genes, such as APOA2, play small roles in immune modulation, others, such as XIST and FTL, have considerable and varied immunological interactions, indicating a possible impact on tumor progression. Genes such as SERPINA1 and APOE have high associations with specific cancer types, implying that they alter immune responses and pave the way for targeted immunotherapy in cancer treatment.
Drug sensitivity and target identification
The DGIdb integrated DEGs with drug databases, showing several gene-drug interactions related to liver cancer, is significant for multiple drug targeting and categorization of interactions. While DGIdb provides useful gene-drug interactions, its therapeutic utility is dependent on treatment efficacy, patient heterogeneity, and tumor microenvironment variables. The limitations include insufficient drug-target annotations and a lack of tumor context specificity. To solve these issues, the researchers advise combining multi-omics data, conducting experimental validation in vitro and in vivo models, and employing AI-driven models to refine predictions. Furthermore, adding clinical trial data increases the reliability and practicality of the found drug-gene interactions in HCC treatment. Figure 12A depicts the classification of drug interaction with key differentially expressed genes, indicating an inhibitor, agonist, antibody, or antagonist. Agonists dominate; thus, the therapeutic potential to activate these targets in treating liver cancer is likely significant. Two pie charts are presented in Fig. 12B summarizing drug approval status and functional categorization. The left chart indicates the proportion of approved versus non-approved drugs, highlighting gaps in clinically validated treatments. The right chart categorizes drugs based on their mechanism of action, emphasizing the balance between activating and inhibiting compounds. Ranking of top gene-drug pairs according to interaction scores SERPINA1, APOA2, and ALB are highlighted in Fig. 12C as major players in liver cancer; SERPINA1-IGMESINE presents the highest interaction score and represents a prime target for this pathway. Drug interaction with APOA2 is also high, with several compounds interacting with this gene, including PKR-A and MITZ. The inclusion of albumin (ALB) interactions underscores its role in liver physiology and cancer, with potential therapeutic implications. This figure underscores the importance of integrating transcriptomic data with drug databases to identify candidate molecules for targeted therapy, providing a systematic approach to drug repurposing in liver cancer.

A Classification of drug interactions. B Number of approved drugs and their functionalities. C Top-ranked gene-drug interactions by interaction score are a putative therapeutic target.
Drug sensitivity across tumor subtypes
The heatmap depicts drug sensitivity in different tumor subtypes, displaying differential response patterns. The cancers exhibit different susceptibility to ICIs, TKIs, and small-molecule medicines. A gradient distinguishes effective medications from resistant ones, allowing precision oncology to optimize treatments and discover subtype-specific weaknesses for better cancer management. Figure 13 represents the tumor subtype-specific drug sensitivity patterns.

Tumor subtype-specific drug sensitivity patterns.
The heatmap shows unique drug sensitivity patterns across tumor subtypes, emphasizing subtype-specific treatment weaknesses. Immune-Hot tumors are very sensitive to immunotherapy (Nivolumab, Pembrolizumab), but Immune-Cold tumors respond better to Sorafenib and EZH2 inhibitors. Stromal-rich tumors are more sensitive to Navitoclax and PKR-A/MTZ. These findings highlight the importance of customized treatment options in liver cancer.
GNN-based predicted drug-gene interaction
GNN showed that the model robustly predicts promising drug candidates that can then be further researched. The architecture of GNN is visualized in Fig. 14A, along with the computation graph of backpropagation: the key operations include matrix multiplications (MmBackward), activation functions (ReLUBackward), and gradient accumulation steps. The network architecture is composed of convolutional layers conv1.lin.weight, conv2.lin.weight, and their corresponding bias terms conv1.bias, conv2.bias. The final output shape is (46, 1), indicating that the model predicts 46 samples that match the aims of the research. The predictive ability of the model is most of the important evaluation metrics have high reliability as mentioned in Fig. 14B. The Mean Squared Error of 0.0581 and the Mean Absolute Error of 0.1811 are relatively low prediction errors, and a high R² score of 0.9867 and explained variance of 0.9897 suggests that the model does a good job of capturing variance within the dataset. These results validate the robustness of the GNN model in ranking drug candidates with minimal prediction errors. Figure 14C displays the training loss curve over 100 epochs. The predicted drug candidates are ranked in Fig. 14 according to their GNN-derived scores. The highest-ranking compounds include Gadobenate Dimeglumine, Fluvastatin, and Soy Protein Isolate, and some of the candidates are also identified as AC-98170, Epicatechin, and Fenofibrate Micronized. Rankings here suggest these compounds are probably of therapeutic value and are validated with more studies. Several of the top-ranked drugs, such as Gadobenate Dimeglumine, Fluvastatin, and Bupropion Hydrochloride, present strong interactions with these genes and support prior computational rankings shown in Fig. 14D. Further bioactive compounds, including Epicatechin, Fenofibrate Micronized, and Warfarin, also show predicted interactions and potential drug repurposing opportunities. Figure 15 illustrates the network of drug-gene interaction as predicted using GNN-based prediction. The center hub nodes indicate important genes in the network, and peripheral nodes signify the drug candidate. The strength of interactions, reported as numbers, points to important drug-gene associations. Specifically, APDE and ALB are the two most connected hub genes, thus playing a significant role in drug interaction mediation.

A is the computational graph of the Graph Neural Network (GNN), highlighting backpropagation steps. B Model performance metrics, including MSE, MAE, R², and explained variance. C The training loss decreased over 100 epochs, indicating stable convergence. D Drug candidates based on GNN scores, with Gadobenate Dimeglumine scoring the highest.

GNN-predicted drug-gene interaction network highlighting key hub genes (APDE, ALB) and top-ranked drugs, revealing potential therapeutic candidates.
Comparative analysis
The model’s performance is evaluated using various metrics like accuracy, specificity, sensitivity, and Matthews Correlation Coefficient (MCC). Accuracy assesses the overall correctness of a model by calculating the proportion of correctly identified occurrences. Specificity, also known as True Negative Rate, measures the ability to correctly identify negative cases. Sensitivity, also known as recall, measures the model’s capacity to discover positive cases. MCC evaluates the balance of genuine and false positives and negatives, offering a complete performance evaluation. The method is compared with traditional methods like SVM-TTK10. Table 2 represents the comparative outcomes of the proposed method and conventional method.
The results show that the GNN beats the SVM-TTK model on all major criteria. The GNN attained an accuracy of 97.5% which is much higher than the 84% achieved by SVM-TTK. It also showed superior specificity (96.5%) and sensitivity (96.8%), surpassing SVM-TTK’s 80.8% specificity and 87.3% sensitivity, showing better overall identification of both positive and negative cases. Furthermore, the MCC of 0.97 for the GNN indicates a greater connection between the model’s predictions and actual outcomes, as opposed to the 0.644 MCC for the SVM-TTK model. These findings emphasize the GNN’s superior performance and the possibility of more accurate and dependable predictions in the current task.
Discussion
This research used scRNA-seq data of tumor-adjacent normal tissue (HCC1) and tumor tissue (HCC2) to make an in-depth analysis of cellular and molecular heterogeneity in HCC. It involves quality control, dimensionality reduction (PCA), clustering (UMAP), pseudotime trajectory analysis, differential gene expression analysis, and pathway enrichment studies to characterize the tumor microenvironment, identify potential biomarkers, and explore therapeutic targets11,12,13. The research identified 1178 DEGs: 926 were upregulated, while 252 genes were downregulated in HCC2. Genes APOE and ALB had positive correlations with better prognosis, while XIST and FTL had negative correlations with survival and indicated their role as potential prognostic biomarkers. The functional enrichment analysis of the differential genes showed the involvement of various pathways, including lipid metabolism, glycolysis, PI3K-AKT signaling, and immune system regulation. In addition, TAMS was enriched in HCC2 and favored immune evasion and tumor progression. This research further supports previous evidence on lipid metabolism reprogramming as a hallmark of HCC while validating the oncogenic roles of PI3K-AKT and Wnt/β-catenin pathways14. Macrophage modulation was a viable treatment technique in HCC that targets TAMs to overcome immune suppression. CSF-1R inhibitors reduce TAM levels, whereas checkpoint inhibitors improve T-cell activity. Reprogramming TAMs with TLR/CD40 agonists or PI3Kγ inhibitors leads to an anti-tumorigenic state. FcγR-targeted antibodies promote macrophage phagocytosis while cytokine inhibition (IL-10, TGF-β, CCL2) prevents immunosuppression. Combining these approaches improved HCC immunotherapy and patient outcomes. However, it adds novel insights by integrating single-cell transcriptomics with immune profiling, demonstrating that TAMs and monocytes significantly contribute to HCC immune suppression. Unlike bulk RNA sequencing studies that overlook cellular heterogeneity, this research provides a high-resolution view of tumor-associated cell populations, revealing transcriptional diversity within hepatocytes, fibroblasts, endothelial cells, and immune cells. A key contribution was integrating gene expression profiling with drug-target analysis, identifying SERPINA1, APOA2, and ALB as potential therapeutic targets, and opening avenues for drug repurposing in HCC treatment15,16. The pseudotime trajectory analysis thus provides a dynamic view of the evolution of the tumor, implying that early intervention targeting specific pathways alters disease progression17. An interesting finding was that APOE has a potential tumor-suppressive role in HCC but an oncogenic role in cancers such as glioblastoma and colorectal cancer. The findings have clinical implications, such as identifying prognostic biomarkers for early diagnosis, risk stratification, and personalized treatment strategies18. Immune infiltration analysis identified potential targets for immunotherapy, including the regulation of macrophage polarization to enhance anti-tumor immunity. Experimental validation would be a valuable next step, coupled with further exploration of multi-omics approaches that shed more light on other regulatory mechanisms19,20. This research provides a significant advancement over previous hepatocellular carcinoma (HCC) research by integrating single-cell RNA sequencing (scRNA-seq) with computational drug discovery, enabling a more precise characterization of tumor heterogeneity and therapeutic targets. Traditional bulk RNA sequencing studies have identified key oncogenic pathways involved in HCC progression, including PI3K-AKT, Wnt/β-catenin, and p53 signaling. However, these studies lacked the resolution to distinguish the differences in gene expression at a single-cell level, averaging the data across heterogeneous populations and masking critical tumor-immune interactions. In contrast, this research employs scRNA-seq to dissect the tumor microenvironment at higher resolution, finding distinct cellular subpopulations that play a crucial role in the progression of the disease, in particular, the TAMs infiltrated into the tumors that facilitate evasion of the immune system. Studies before, such as4, have utilized scRNA-seq to examine transcriptional heterogeneity in HCC but lacked functional analysis of immune infiltration and therapeutic target discovery. This research goes beyond the previous efforts as it integrates immune profiling with survival analysis, showing how macrophage infiltration correlates with poor prognosis. This research uses CIBERSORT for immune deconvolution at higher resolutions than previous bulk transcriptomics-based immune studies while highlighting specific immune subtypes that drive tumor progression. Of significance, it identifies APOE and ALB as protective factors in HCC, whereas XIST and FTL correlate with poor survival outcomes, finding that most research either failed to notice or had not been validated in a single-cell manner in the past. Traditionally, previous studies relied mainly on rather old traditional drug screening techniques, including molecular docking or classical network pharmacology. Thus18, to a great extent, discussed the repurposing strategies of drugs in HCC but relied more on preset known drug-target interactions, without using AI-based predictive modeling. Unlike conventional bulk RNA sequencing averages gene expression across several cell populations, the method uses scRNA-seq to capture tumor heterogeneity at high resolution. While previous researchers have discovered immunological markers in HCC, they frequently lack predictive frameworks for drug discovery. The research combines GNN-based medication repurposing with single-cell transcriptional data to rank drug-gene interactions with great prediction accuracy (R² = 0.9867, MSE = 0.0581). This integrated method increases biomarker identification while also broadening the field of AI-driven medication discovery in liver cancer. Among the identified drugs were Gadobenate Dimeglumine and Fluvastatin, thus discovering new repurposing opportunities where previous methods, though comprehensive and validated, do not produce predictive results. Moreover, contrary to previous works that were simply based on comprehensive gene expression, this research, for the first time, employs GSEA, in combination with pathway analysis, to identify significantly dysregulated HCC-specific biological processes, among which were lipid metabolism, glycolysis, and immune functions. Although previously, lipid metabolic reprogramming had been described as a hallmark in HCC development21, here, these changes in metabolism were uniquely associated with immune evasion strategies and survival prospects. This further reinforces its contribution toward the integration of pseudo time trajectory analysis and mapping of cellular differentiation states, aspects that were underexplored in previous bulk sequencing studies. Model retraining improved generalizability by fine-tuning on a variety of datasets, reducing overfitting, and increasing forecast accuracy. Transfer learning adjusts pre-trained models to HCC-specific data, while regularization minimizes overfitting. Active learning iteratively refines predictions, whereas multi-omics integration enhances feature representation. Continuous updates ensure robustness in identifying successful medication options for the treatment of hepatocellular cancer. This research provides a comprehensive, single-cell view of HCC and forms the basis for targeted therapeutic strategies and the discovery of novel biomarkers to help improve patient outcomes.
This research analyzed hepatocellular carcinoma’s cellular and molecular landscape using a single-cell RNA sequencing (scRNA-seq) data set from GSE166635. The data set included tumor-adjacent normal tissue, HCC1, and tumor tissue, HCC2, allowing for a comprehensive comparative analysis. Downstream analysis from high-quality data preprocessing, including quality control, feature selection, and normalization, provided a reliable outcome. Dimensionality reduction using PCA and clustering via UMAP and t-SNE identified distinct cellular populations that were subsequently annotated using reference datasets. Key findings were a considerable transcriptional heterogeneity between HCC1 and HCC2; 1178 DEGs were found. Pseudotime trajectory analysis suggested progressive differentiation of tumor cells, indicating some potential HCC regulators. Analysis of the cell cycle revealed that increased proliferation of cells in HCC2 showed dysregulation in cell division. Immune profiling identified that increased TAMs further contribute to immune evasion. Critical dysregulated pathways identified using GSEA include lipid metabolism, glycolysis, and oncogenic signaling pathways such as PI3K-AKT and Wnt/β-catenin. Survival analysis also established links between genes APOE and ALB, associated with a better prognosis, whereas XIST and FTL indicated poorer survival outcomes. The analysis of drug sensitivity has provided information on the possible therapeutic targets and has proposed candidate treatments by integrating DEGs with drug databases. These findings need to be validated by functional experiments and in vivo studies. The tumor microenvironment was explored in depth using single-cell multi-omics approaches to better understand the progression of HCC. Moreover, scRNA-seq data integration with clinical samples helps to enhance personalized medicine approaches. Gene-drug interactions identified herein should be validated through experimental studies to determine therapeutic potential. The feasibility of a GNN-based approach in the prediction of drug-gene interactions with high predictive accuracy and promising therapeutic candidates was proved. Identified drugs such as Gadobenate Dimeglumine and Fluvastatin, reveal strong interaction with the key genes were have potential clinical relevance. Network analysis further revealed some repurposing opportunities using the existing bioactive compounds. These findings highlight the promise of graph-based deep learning in drug discovery by systematically dissecting new relationships between drugs and their target genes. Experimental validations of the presented predictions further improved the model by incorporating even more biological data for more accurate clinical implications in targeted drugs. This research was limited by potential biases in the scRNA-seq dataset, such as batch effects and technical noise influencing the results. Furthermore, computer approaches such as PCA and UMAP were oversimplifying complex data, concealing crucial biological variances. Furthermore, the lack of control trials, such as in vitro or in vivo biomarker validation and drug sensitivity, hinders the capacity to definitively confirm the therapeutic targets discovered. This research serves as a foundation for further investigations on targeted therapies and biomarker discovery to improve the analysis and therapy of HCC. The future research should mention the lineage-tracing experiments to further validate the inferred differentiation pathways.
Methods
Data acquisition and preprocessing
scRNA-seq dataset (GSE166635) from the GEO database for HCC1 (tumor-adjacent normal tissue) and HCC2 (tumor tissue)5. The dataset has a more rigorous quality control, detailed cell-type annotations, and strong immune profiling. It supports pseudotime analysis and drug-target identification, making it ideal for uncovering tumor-specific alterations and novel therapeutic targets in hepatocellular carcinoma. The cell-specific characteristics combined with batch reductions ensured the data had high confidence for downstream analyses. It also performed quality control, where it eliminated poor-quality cells, avoided doublets, and was thus assured that the data would be reliable. Cells with fewer than 200 and more than 2500 genes are removed to remove empty droplets and potential doublets. More than 5% of cells containing mitochondrial content are filtered out to eliminate noise caused by apoptotic cells. Feature Selection Technical variability is controlled by centering the data, hence scaling cells uniformly. Highly variable genes (HVGs) are identified, and the top 2000 genes with the highest variance are chosen22,23. To normalize gene expression data, a variance-stabilizing transformation is applied. The method corrects mean-variance dependencies more effectively for improving downstream analysis such as clustering, dimensionality reduction, and differential expression analysis. Standardization after preprocessing facilitated meaningful comparisons.
Dimensionality reduction
PCA is applied to reduce the dimensionality and retain the most significant biological variance. Further analysis is done using an elbow plot to establish the finest number of PCs based on the contribution to variance, selecting the top 10 PCs for promotion examination24,25. This process helped reduce the dimensionality to make computational calculations more efficient and made it easier to interpret the scRNA-seq data before subsequent steps in clustering and visualization.
Cell clustering and cell type annotations
Clustering is applied to the dataset to obtain particular cell populations. A nearest-neighbor graph is constructed and then clustered at a resolution of 0.5. UMAP is used to obtain a low-dimensional representation of cellular heterogeneity. Clusters are visualized for the presence of discrete cell populations based on gene expression. Cell types are annotated using reference datasets; the HPCA is used as the reference. Gene expression profiles are compared against cell-type-specific signatures already established12,26. To evaluate the dependability of cell-type annotations, confidence scores are calculated for each identified cell type. Table 3 shows the mean confidence scores, standard deviations, and ranges. Each cluster is assigned a biologically relevant identity by applying its respective gene signatures. Marker genes are studied to validate annotations against markers of well-characterized cell types. Moreover, cluster-specific marker genes are identified using an accustomed p value threshold of <0.05 and the total log2 fold change > 1, providing further insight into the functional properties of each cluster. Further functional analyses, such as intercellular communication and pathway enrichment studies, are based on the correct cell-type annotation.
Cell cycle analysis
Cell cycle states are inferred from the expression of phase-specific marker genes, and cells are further categorized into G1, S, and G2/M phases. The proportion of cells in each phase is quantified to evaluate proliferative activity across different conditions. This approach allowed inferring the proliferative state of individual clusters and distinguished quiescent from actively dividing populations. The circulation of cells across G1, S, and G2/M stages provides insights into therapy response. G1-phase cells exhibit resistance to chemotherapy, while S-phase cells are more susceptible to DNA-damaging agents. G2/M-phase targeting is inducing mitotic arrest, though resistant clones are persisting. Highly proliferative cells respond better to kinase inhibitors, whereas quiescent populations evade treatment, driving relapse.
Pseudotime trajectory analysis
Cellular lineage relationships are inferred by reconstructing differentiation trajectories. Developmental trajectories are calculated, and cells are ordered along a pseudotemporal axis. Pseudotime analysis is used to visualize differentiation states and identify key branching points indicative of tumor progression27,28. These analyses have presented dynamic transitions between normal and malignant cellular states and offer insights into potential drivers of HCC progression and therapeutic targets for early intervention.
Differential expression analysis (DEA)
DEA is performed to analyze the most differential genes that characterize the tumor HCC2 in comparison with adjacent normal tissue, HCC1, and a differential expression analysis is performed. Here, Seurat is utilized for the test; the DEGs between conditions are detected with the Wilcoxon rank-sum test. With a complete log2 fold transform of more than 1 and an adjusted p value < 0.05, they are considered to be significant. Additionally, the observed differences will only be considered relevant biologically, not technical artifacts, as expression values obtained have been subjected to batch correction to remove confounding effects.
Gene set enrichment analysis (GSEA)
The dysregulated biological trails in liver cancer are established by performing a GSEA. A ranked gene list, sorted by log2 fold change, is established based on differential expression results. The cluster profile package in R is used with an adjusted p value of <0.05 and an artificial detection rate of <0.25 to analyze the same. This included oncogenic signaling, metabolic modifications, immune function regulation, and interactions with the tumor microenvironment. MF, BP, CC, and KEGG signaling cascades, as well as the immune-related process, are looked into to deduce mechanisms for the progression of hepatocellular carcinoma (HCC). The overlap and redundancy among gene sets and cross-referenced pathways across databases are prioritizing those with significant enrichment and clinical relevance to HCC. Key pathways like lipid metabolism, glycolysis, and P13K-AKT signaling are selected based on their involvement in cancer hallmarks and correlation with survival outcomes.
Survival analysis
The Kaplan–Meier survival analysis is applied to correlate the gene expression levels with the overall survival in HCC patients. Log-rank tests evaluated the statistical significance of the values at a p value of <0.057. Hazard ratios for the prognostic biomarkers are calculated by applying Cox proportional-hazards models to identify candidates with potential clinical utility. Immune Cell Infiltration Analysis During cell type annotation, macrophages are observed as a leading population of immune cells in the tumor microenvironment. Macrophages, such as TAMs, are found to be primarily involved in all the processes involved in tumor development, including the promotion of immune evasion, angiogenesis, and metastasis. Reference datasets and gene expression profiles further revealed that the unique macrophage subtypes are separately found in HCC2 for tumor tissue and HCC1 for adjacent normal tissue. In addition, specific gene expression signatures for macrophages are explored to identify a possible role of these cells in the immunity mechanism of HCC.
Drug sensitivity and target identification
Candidate drugs that interact with identified DEGs are cross-referenced against publicly available drug databases, including the Drug-Gene Interaction Database or DGIdb. Candidate drugs that interacted with the most significantly associated top DEGs are identified29. These drugs have been selected on the relevance to pathways of liver cancer (HCC), such as PI3K-AKT, Wnt/β-catenin, and p53 signaling are considered major pathways for tumor progression and concerning drug-gene interaction score. Drug-gene interaction integrated with pathway analysis helped prioritize the potential drug candidates for further experimental validation.
Graph neural network (GNN)-based predicted drug-gene interaction
GNN models are specifically intended for graph-structured data, making them ideal for predicting drug-target interactions in HCC. GNNs learn optimal representations from molecular graphs and gene expression data, capturing complicated drug-target interactions. Drugs and genes are specifically based on molecular descriptors, target pathways, and pharmacological properties retrieved from Rkdit, PubChem, ChEMBL, and Uniport. The construction criteria of the graph guaranteed its highly interconnected and heterogeneous nature, where the nodes would be genes and drugs, and the edges represent interactions filtered based on known binding affinities and relevance to pathways. Feature engineering includes the application of one-hot encoding for categorical variables, Molecular ACCess System or MACCS fingerprinting for molecules that are drugs, and the addition of gene expression levels for biological context. The model involved using a Graph Convolutional Network with semi-supervised learning. The parameters of learning rate, dropout rate, and regularization are varied to achieve better performance. The prediction criteria evaluated the reliability of the model using precision, recall, AUC ROC, and F1-score, and only interactions above a predefined confidence threshold are considered significant. High-confidence predictions from drug-gene interactions from combining such strict criteria, have propelled network-based approaches in drug discovery. Their ability to spread information among biological networks improves prediction accuracy. GNNs also scale quickly to big datasets by using sparse adjacency matrices, making them excellent for combining single-cell transcriptomics and pharmacological data. Beyond prediction, GNNs enable drug repurposing by detecting novel interactions, as evidenced by the discovery of promising candidates such as Gadobenate Dimeglumine and Fluvastatin. These features make GNNs an effective computational tool for improved drug development and therapeutic targeting in HCC.
The combination of single-cell RNA sequencing and GNNs allows for a more exact characterization of tumor heterogeneity. Unlike traditional approaches, this strategy identifies unique cellular subpopulations and their interactions, offering more information about hepatocellular carcinoma progression. Furthermore, it systematically ranks possible therapeutic targets and improves drug repurposing approaches. This research advances precision medicine by merging high-resolution transcriptome analysis with AI-powered predictions, opening up new avenues for targeted treatment and tailored therapeutic interventions in liver cancer.