Introduction
Biosurfactants (BSs) are amphiphilic compounds synthesized by a wide variety of microorganisms, characterized by their ability to reduce surface and interfacial tension due to their dual hydrophilic and hydrophobic nature1,2. These biologically derived surfactants offer significant advantages over synthetic counterparts, including lower toxicity, higher biodegradability, and stability under a broad range of environmental conditions3,4. Among the diverse classes of biosurfactants, glycolipids—comprising a hydrophilic carbohydrate moiety linked to a hydrophobic lipid tail—have garnered particular interest due to their potent bioactivities and structural adaptability5.
Recent advances in biomedical research have highlighted the promising role of glycolipid biosurfactants in oncology. Their unique amphiphilic architecture allows them to interact with cancer cell membranes selectively, disrupt lipid bilayers, and induce apoptosis, making them attractive candidates for anticancer therapies6,7. In contrast to conventional chemotherapeutics, which often exhibit systemic toxicity and low selectivity, biosurfactants such as rhamnolipids and sophorolipids have demonstrated the ability to target cancer cells while sparing healthy tissues9,10. Moreover, these compounds can modulate cell signaling pathways, inhibit tumor progression, and synergize with other anticancer agents, further enhancing their therapeutic value11.
Despite their biological potential, the commercial development of biosurfactants faces significant challenges, particularly concerning production yield and process scalability. Optimizing culture conditions for enhanced biosurfactant synthesis is critical but traditionally time-consuming and resource-intensive. To address this, recent studies have incorporated artificial intelligence (AI) techniques, such as multilayer perceptron artificial neural networks (MLP-ANN), to model and optimize microbial fermentation processes with high accuracy and efficiency12,13,14.
In this context, the present study aims to isolate and characterize a novel glycolipid biosurfactant, designated S1B, from Bacillus species obtained from water samples of the Ganga River in Kolkata, India—an ecologically diverse site known for harboring unique microbial consortia. The biosurfactant was subjected to comprehensive physicochemical characterization using Fourier-transform infrared spectroscopy (FTIR), nuclear magnetic resonance (1H and 13C NMR), and liquid chromatography–mass spectrometry (LC-MS). Additionally, an AI-driven MLP-ANN model was employed to optimize culture conditions for S1B production, with the goal of maximizing yield and functional bioactivity.
Given the global cancer burden—estimated at over 29 million cases worldwide—the exploration of novel, effective, and low-toxicity anticancer agents is an urgent priority15,16. This study seeks to contribute to the evolving field of biosurfactant-based therapeutics by demonstrating the anticancer efficacy of S1B and showcasing the role of AI in advancing sustainable biomanufacturing strategies. Ultimately, this research underscores the potential of glycolipid biosurfactants as next-generation biomolecules for targeted cancer therapy and environmentally conscious biotechnological applications.
Materials and methods
Sample collection sites
In the pursuit of identifying bacteria capable of producing biosurfactant (BS), a rigorous sampling strategy was implemented across heterogeneous locations within India. Water samples were collected from the Ganga River in Kolkata, West Bengal (22.55°N, 88.28°E). The Ganga River harbors diverse microbial populations influenced by factors such as industrial effluents, agricultural runoff, and urban pollution17,18. The site was selected to increase the likelihood of isolating biosurfactant-producing microorganisms from an ecologically varied environment.
Sample preservation and isolation of desired microbes
To prevent contamination, Water samples were collected in sterile 50-mL polypropylene tubes and stored at 4 °C until processing to preserve the microbial community. All equipment was autoclaved (121 °C, 15 min) and disinfected with ethanol before use to ensure sterility. Samples were serially diluted and spread onto nutrient agar plates to allow microbial colony formation. Colonies were sub-cultured in nutrient broth for further isolation and characterization.
CTAB assay for microbial screening
Preliminary screening for biosurfactant production was performed using the CTAB–methylene blue agar method as described by Saravanan et al.19 and Walter et al.20. Bacterial isolates were grown on salt agar plates containing cationic CTAB and methylene blue. Colonies producing anionic biosurfactants formed a distinct dark blue halo, the diameter of which provided a semi-quantitative indication of biosurfactant production. Positive isolates were selected for further analysis.
Growth medium preparation
The production medium was designed to support microbial growth and biosurfactant synthesis. Per liter, it contained: NaCl (10 g), CaCl2·2 H2O (0.1 g), KH2PO4 (2 g), K2HPO4 (5 g), (NH4)2 SO4 (3 g), NaNO3 (2 g), and MgSO4·7 H2O (0.2 g)21,22,23,24,25,26. Olive oil (0.5%, v/v) served as the carbon source. Trace elements were added as follows: ZnSO4·7 H2O (5 mg), MnSO4·4 H2O (200 mg), CuSO4·5 H2O (70 mg), NH4MoO4·2 H2O (15 mg), and CoCl2·6 H2O (200 mg). The medium was sterilized by autoclaving (121 °C, 15 min) before use.
BS production and extraction
The pure culture flourished at a temperature of 35 °C and a rotation speed of 150 rpm over seven days. During the extraction process, the culture broth was centrifuged at 10,000 rpm for 20 min at a temperature of 4 °C. The pH of the resulting supernatant was adjusted to 2 with 6 N HCl. The BS was subsequently allowed to accumulate overnight at four °C to facilitate precipitation. During extraction, the pH was maintained at 2, and the supernatant was refrigerated to protect the biosurfactant from degradation19,20.
Purification by the solvent extraction method
The purification process was conducted by the methodology established in our previous work27, utilizing a solvent extraction technique. A well-constructed solvent system of 2:1 chloroform and methanol was used. After extraction, the organic phase comprising the target biosurfactant was partitioned into the chloroform-rich layer. Water-soluble contaminants remained in the aqueous phase. This separation technique isolated the biosurfactant from the culture medium’s impurities, purifying the organic phase.
The biosurfactant-enriched lower organic phase concentrated the target molecule, making analytical procedures easier. This higher concentration of partially purified BS allowed better characterization and physicochemical study. A better understanding of the biosurfactant’s behavior and possible applications could boost biotechnology, environmental remediation, and pharmaceuticals.
16S rDNA sequence analysis for evolutionary analysis
The extraction of genomic DNA from bacterial sample 1B adhered to the methodology established by Chen et al.28. Subsequent to DNA integrity assessment, electrophoresis on a 1% agarose gel revealed a solitary band of high-molecular-weight DNA. The 16 S rRNA gene fragment was amplified with 27 F and 1492R primers, yielding a 1500-bp PCR amplicon band on agarose gel electrophoresis. The PCR amplicon was refined to confirm its purity. PCR amplicons were sequenced using the 27 F and 1492R primers. The BDT v3 sequencing kit was utilized on an ABI 3730xl Genetic Analyzer. The aligned sequences were submitted to GenBank as a consensus 16 S rRNA sequence. The Maximum Likelihood method of MEGA7 was employed for evolutionary analysis using the Tamura-Nei model29,30. We conducted 1000 bootstrap trials by random resampling of the dataset to evaluate the phylogenetic tree. The predominant rule from these bootstrap repeats was employed to construct a consensus phylogenetic tree, elucidating the evolutionary relationships among bacterial strains.
Thin-layer chromatography
Thin Layer Chromatography (TLC) effectively identifies and studies the biomolecular constituents of biosurfactants. For this procedure, 10 µl of purified BS was meticulously applied to a Merck DC Silica Gel 60-coated TLC plate. A drying process ensued after positioning the sample near the bottom of the plate. This guaranteed the adhesion of BS-silica gel. A solvent mixture of chloroform, methanol, and water with a ratio of 65:15:2 was employed for chromatographic separation. Upon the addition of 0.2% ninhydrin and ethanol, lipopeptide spots manifested a red-pink hue. A bromothymol solution was employed to identify glycolipids, yielding brown spots on TLC plates31.
The presence of lipids was confirmed by exposing the TLC plate to iodine vapors, allowing for the detection of lipid-containing areas32. This comprehensive TLC analysis elucidated the intricate composition of the biosurfactant sample, delineating its chemical structure and potential applications.
Spectral characterization of BS
A combination of analytical techniques was used to characterize and classify the biosurfactant (BS). The identification and classification of BS according to their distinct functional groupings were primarily made possible by these approaches. Through meticulous application of these characterization procedures, we could accurately ascertain the isolate’s chemical composition and categorize it appropriately. This project sheds light on the complex interrelationship between structure and function and expands our knowledge of their structural characteristics. These discoveries also opened the door for possible uses in other industries. With a deeper understanding of the structure and function of BS, we were better able to take advantage of its unique qualities for a wide range of applications.
Fourier transform infrared spectroscopy
The isolates were subjected to lyophilization, a method designed to preserve the sample by eliminating its water content. We performed the following dialysis with demineralized water at 4 °C. After lyophilization, the isolates were mixed with 100 mg of KBr to create translucent pellets suitable for infrared spectroscopy. The pellets were produced by compressing the mixture for 30 s at 7500 kg pressure33,34,35. The JASCO FT/IR 4600 spectrophotometer recorded readings across a spectrum from 4000 to 400 cm−136.
Chemical characterization of BS by using NMR
Utilizing nuclear magnetic resonance (NMR) spectroscopy, the intricate chemical composition of the purified BS was meticulously elucidated. Specifically, liquid-state NMR spectroscopy, known for its efficacy in characterizing complex molecules, served as the primary method in this investigative endeavor. Comprehensive 13 C and 1 H NMR datasets were acquired employing a high-resolution multinuclear Fourier transform (FT) NMR spectrometer boasting a field strength of 400 MHz, manufactured by Bruker in Switzerland37.
Deuterated chloroform was employed as the solvent for recording the liquid-state 13 C and 1 H NMR spectra, ensuring solubility and compatibility with the BS sample under investigation. Leveraging the capabilities of this advanced NMR spectrometer, the investigation delved into the molecular environment of the BS compound, providing valuable insights into its structural attributes and chemical properties35,38.
Mass spectrometry
In our investigation, we employed mass spectrometry (MS) as a pivotal tool to elucidate the precise molecular weights of the separated substances39. Specifically, utilizing a Shimadzu GC-MS instrument facilitated high-resolution analysis, enabling the accurate determination of molecular weights with unparalleled precision. This analytical technique provided essential data for comprehensively characterizing the isolated compounds. Furthermore, to enhance our understanding of the composition of the isolates, we conducted elemental analysis in tandem with mass spectrometry. This complementary approach allowed for a more holistic assessment of the molecular constituents. Elemental analysis was performed using a PerkinElmer 240 analyzer, renowned for its reliability in quantifying the concentrations of key elements such as carbon (C), hydrogen (H), and nitrogen (N) within the compounds under scrutiny.
The integration of mass spectrometry and elemental analysis methodologies facilitated a comprehensive evaluation of the isolated compounds’ molecular characteristics and elemental composition40.
In-vitro quality assessment of S1B
Microplate assay
The experimental protocol closely followed the methodology established by Vaux et al.41. A grid paper sheet was precisely placed under a 96-well plate containing water as the medium. After this setup, a precise volume of 2 µl of the purified BS was carefully dispensed into each well. A qualitative assessment of surfactant presence was accomplished by observing observable changes in the optical characteristics of the grid pattern, as reported in prior research42. To ensure the reliability and reproducibility of the results, the experiment was replicated in triplicate. This rigorous approach not only bolstered the accuracy of the findings but also provided robustness to the experimental outcomes, facilitating comprehensive analysis and interpretation of the results.
Drop-collapse assay
The methodology proposed by Jain et al. for assessing microbial activity employs the intriguing behavior of liquid droplets on hydrophobic surfaces. The interfacial tension between the substrate and water is evaluated by applying cell-free supernatant over a hydrophobic surface, such as parafilm43,44. The system was allotted a 24-hour equilibration period to achieve stabilization following deposition. The presence of a beaded droplet signifies considerable interfacial tension and unfavorable outcomes. Positive outcomes are characterized by droplet collapse during observation. This innovative method efficiently assesses the surfactant-producing capabilities of microorganisms, elucidating their surfactant secretion patterns and potential commercial applications.
Emulsification stability test (Emulsification Index—E24)
The authors adhered to the procedure outlined in Sect. 2.3 to ensure the growth and viability of this test. Following careful cultivation, living bacteria were shifted to a 500 ml volumetric flask containing 100 ml of nutrient broth, which provided an environment for their continued growth. The flask was subsequently shaken at 200 rpm for 120 h in an incubator maintained at 37 °C. Upon completion of the incubation period, a final centrifugation phase was conducted, wherein the microbial ensemble was cooled to 4 °C for 20 min while subjected to forces of 10,000 rpm. The emulsification index measurement, an essential assessment of microbial interaction with oils, represents the subsequent phase in this scientific investigation45. The supernatant was combined with an equal volume of mustard oil and permitted to settle for five minutes. The combination was allowed to remain undisturbed at room temperature for 24 h. To demonstrate the extent of this microbiological achievement, the authors employ the following formula with precision and a rigorous methodology.
$$:{mathbf{E}}_{24}=:frac{{mathbf{h}}_{mathbf{e}mathbf{m}mathbf{u}mathbf{l}mathbf{s}mathbf{i}mathbf{o}mathbf{n}}}{{mathbf{h}}_{mathbf{t}mathbf{o}mathbf{t}mathbf{a}mathbf{l}}}:times:100$$
where htotal denotes the overall height of the liquid and hemulsion denotes the height of the emulsion.
Oil displacement assay
The oil displacement assay was used to evaluate the efficacy of the biosurfactant (BS). Petri plates were used in the experiment, as indicated by its name. A thin, dense layer of oil that floats on the water’s surface is generated by meticulously introducing 200 µl of oil into 20 milliliters of distilled water. Subsequently, 50 µl of BS was precisely placed at the center of the oily surface to assess the oil removal capacity of BS. The effectiveness of the BS is assessed by accurately measuring the displaced area where the BS causes movement or displacement of the oil layer. A larger displaced area indicates improved BS effectiveness46,47.
Measurement of critical micelle concentration
A key consideration in determining the activity of biosurfactants is the critical micelle concentration or CMC. At the CMC, the surface tension of the surfactant achieves its minimum; above that, no further influence on surface activity is seen. The surface tension of serially diluted biosurfactant solutions was measured, and the surface tension was plotted against the biosurfactant concentration to calculate the CMC48. This determination was made using several dilutions of crude biosurfactant in three independent replicates. The average data is shown in the results that are presented.
In vitro anti-cancer studies
All cancer cell lines, including HeLa (Human cervical adenocarcinoma) and HEK (Human embryonic kidney) were procured from the National Centre for Cell Science (NCCS, Pune, India). The cell lines were authenticated by the supplier and certified to be free of mycoplasma contamination. Cells were maintained in Dulbecco’s Modified Eagle Medium (DMEM) supplemented with 10% fetal bovine serum (FBS) and 1% penicillin-streptomycin under standard culture conditions (37 °C, 5% CO2).
MTT assay
The cytotoxicity of pure BS against HeLa and HEK cells was assessed by MTT assay49. Cells (1 × 10⁴ cells/well) were seeded in 96-well plates and incubated overnight at 37 °C in a CO2 incubator. Cells were then treated with biosurfactant (S1B) at concentrations of 50, 100, 200, and 250 µg/mL for 24 h, while untreated cells served as controls. Following treatment, 20 µL MTT solution (5 µg/mL) and 80 µL fresh medium were added per well, and plates were incubated for 3 h. The medium was removed, and 200 µL DMSO was added to dissolve formazan crystals. Absorbance was measured at 570 nm using a VersaMax™ microplate reader. Cell viability, reflecting metabolic activity, was calculated using the following formula.
$$:text{C}text{y}text{t}text{o}text{t}text{o}text{x}text{i}text{c}text{i}text{t}text{y}:left(text{%}right)=1-frac{:left(text{O}text{D}:text{o}text{f}:text{t}text{r}text{e}text{a}text{t}text{e}text{d}:text{c}text{e}text{l}text{l}text{s}right)}{text{O}text{D}:text{o}text{f}:text{u}text{n}text{t}text{r}text{e}text{a}text{t}text{e}text{d}:text{c}text{e}text{l}text{l}text{s}}:times:100:$$
Anti-oxidant (DPPH) assay
A DPPH (2,2-diphenyl-1-picrylhydrazyl) experiment was used to evaluate the ability of S1B to scavenge free radicals50. The experiment began with a range of different concentrations ranged from 12.5 to 100 µg/mL, being added to a 0.1 mM metabolic DPPH solution. As a reliable reference, ascorbic acid was used as the standard that oversaw this experiment. After the samples were allowed to incubate for 30 min at room temperature, their absorbance was measured at 517 nm in comparison to a blank solution of methanol. The given formula was used to compute the percentage of inhibition. This assay demonstrated the ability of the biosurfactant (BS) to scavenge free radicals, highlighting its potential antioxidant activity.
$$:mathbf{%}:text{o}text{f}:text{i}text{n}text{h}text{i}text{b}text{i}text{t}text{i}text{o}text{n}::=:frac{left(text{A}text{C}-text{A}text{S}right)}{text{A}text{C}}:times:100$$
Where AC denotes the absorbance of the control (DPPH) and the absorbance of the sample represents AS.
PI live/dead assay
Propidium iodide (PI), a fluorescent dye that selectively stains dead cells, was used to assess the cytotoxic effects of S1B culture filtrates on HeLa cells, following the method described in51. HeLa cells (2.5 × 10⁴ cells/mL) were seeded in 24-well plates and incubated overnight. Cells were then treated with BS (50 and 100 µg/mL, dissolved in 4% DMSO) for 24 h. After treatment, cells were trypsinized, centrifuged at 3,000 rpm for 3 min, and washed twice with ice-cold PBS. Untreated cells served as negative controls, while paclitaxel (12 nM) was used as a positive control. Pellets were incubated with PI for 30 min at 37 °C, followed by flow cytometric analysis using a CytoFlex (Beckman Coulter-CytoFLEXS). Data on viable and non-viable cell populations were analyzed with CytExpert software.
Effect of BSs on cell cycle in HeLa
Flow cytometry was performed to analyze cell cycle dynamics following established protocols52. HeLa cells (1 × 10⁵ cells/well) were seeded in 12-well plates and treated with S1B (100 and 200 µg/mL) for 12 h. After treatment, cells were washed with PBS, detached using trypsin-EDTA, and centrifuged at 3,000 rpm for 5 min. The pellets were washed twice with PBS and fixed by adding 1 mL of ice-cold 70% ethanol dropwise with vortexing, followed by overnight incubation at − 20 °C. The next day, cells were centrifuged (5,000 rpm, 5 min, 4 °C), washed with PBS containing 2% FBS, and permeabilized with 0.1% Triton X on ice for 15 min. RNase (0.1 mg/mL) was then applied for three h at 37 °C. Finally, cells were stained with PI (50 µg/mL) for 15 min at 37 °C and analyzed using a CytoFLEX S flow cytometer (Beckman Coulter). This enabled quantification of cells in G0/G1, S, and G2/M phases, providing insights into the effects of BG2A and BG2B on cell cycle progression.
Mitochondrial membrane potential assay
JC-1 (5,5′,6,6′-tetrachloro-1,1′,3,3′-tetraethylbenzimidazolcarbocyanine iodide) dye, widely used to assess mitochondrial function during apoptosis, was employed to evaluate the effects of Bacillus-derived biosurfactant (S1B) on HeLa cells, following the protocol in27. HeLa cells (2.5 × 10⁵/well) were seeded in 24-well plates with serum-enriched medium and incubated overnight. Cells were then treated with S1B (50 and 100 µg/mL) for 24 h. After treatment, cells were harvested by trypsinization, washed with PBS, and pelleted by centrifugation. The pellets were resuspended in PBS and stained with JC-1 (2.5 µg/mL) at 37 °C for 15 min in a CO2 incubator, followed by washing with ice-cold PBS containing 2% FBS. Samples were analyzed on a CytoFLEX S flow cytometer (Beckman Coulter), and data were processed with CytExpert software (v2.4). Paclitaxel (Taxol) served as a positive control, untreated cells as a negative control, and unstained cells as a reference.
Artificial neural network (ANN) model for medium optimization
In this study, an artificial neural network (ANN) was applied to predict outcomes using experimental data for media optimization, focusing on biosurfactant (BS) yield and emulsification index based on five key parameters. The ANN model was developed in STATISTICA 11.0 (Tibco Stat Inc., v13.5.07), with the best topology identified through a trial-and-error approach. A total of 10,000 structural models were tested, and performance was evaluated using error metrics including coefficient of determination (R2), root-mean-square error (RMSE), mean absolute error (MAE), and absolute percentage error (APE), as recommended in earlier studies53,54. The dataset was divided into training, testing, and validation groups to ensure robust prediction accuracy. An optimal Multi-Layer Perceptron (MLP) architecture of 5 × 10 × 1 neurons (five input, ten hidden, and one output) was identified. Parameter selection was guided by the design approach of Zulfiqar Ahmad et al.55 for optimizing biosurfactant production (Table 1). In contrast, experimental values for emulsification index and biosurfactant yield are summarized in Table 2.
Model development and benchmarking
To evaluate the performance of Artificial Intelligence (AI)-driven optimization in comparison with traditional statistical modeling, a Multi-Layer Perceptron Artificial Neural Network (MLP-ANN) was implemented along with other machine learning algorithms, including Linear Regression, Polynomial Regression, Support Vector Regression (SVR), Decision Tree, Random Forest, and K-Nearest Neighbors (KNN). The models were trained using biosurfactant yield as the response variable, with temperature, pH, and incubation period as input variables.
The dataset was divided into training and testing subsets and model performance was assessed using Root Mean Square Error (RMSE) and Coefficient of Determination (R2). Residual analysis (residual vs. predicted, predicted vs. actual) and distribution plots were employed to evaluate model bias and consistency.
In parallel, Response Surface Methodology (RSM) with a quadratic polynomial model was constructed to provide experimental interpretability and visualize factor interactions through 2D contour and 3D surface plots. Comparative analysis of ANN and RSM models was performed to highlight differences in predictive ability and optimization interpretability.
Results and discussion
Isolation of desired microbes
After a 24-hour incubation, the agar plates revealed a striking diversity of microbial colonies, each displaying distinct morphological traits. The colonies exhibited significant variation in size, shape, color, and texture, resulting in a complex and visually striking pattern of microbial growth. We carefully examined and isolated each distinct colony, ensuring the separation of specific microbial strains. This essential step was required to identify individual strains for subsequent investigation, facilitating a more comprehensive examination of the distinct properties displayed by each microbial strain.
CTAB assay
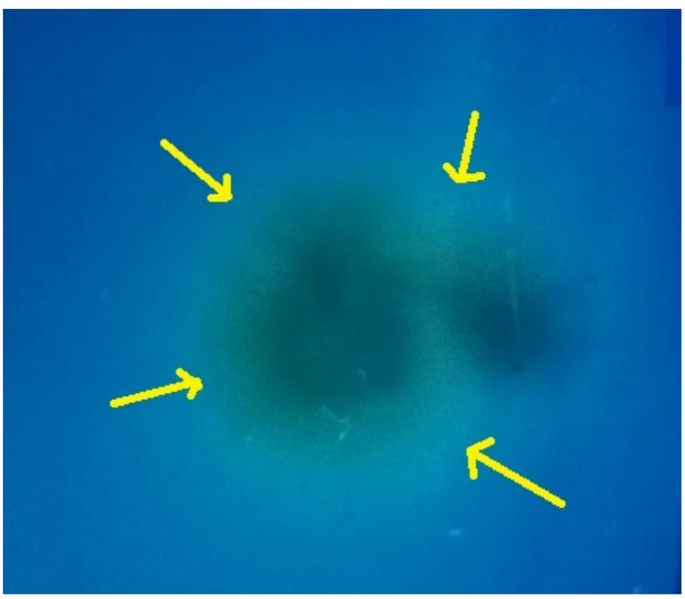
Among the diverse microbial colonies obtained, an intriguing isolate was meticulously identified and labeled as Sample 1B (S1B). To elucidate its distinctive characteristics, this study undertook a comprehensive qualitative analysis of the isolate (Fig. 1). The regions, marked with yellow arrows, highlight the ionic interactions between cetyltrimethylammonium bromide and the bioactive substances (BS) released by S1B. This finding not only provides insight into the unique properties of S1B but also underscores its potential applications in various scientific fields.

BS screening assay. The yellow arrow marks the distinct formation of a blue halo zone. This suggests the presence of anionic biosurfactants interacting with the cationic CTAB.
Phylogenetic analysis
The identification of the target microorganism (S1B) involved multiple phases, beginning with phylogenetic analysis using 16 S rRNA sequencing. A Maximum Likelihood tree was constructed with bootstrap resampling, and bootstrap values were recorded at the nodes. The consensus sequence of S1B, with the highest log likelihood (− 3214.4006), showed 100% similarity to Bacillus cereus, as depicted in Fig. 2(a). The sequence was deposited in GenBank under accession number MW578970, ensuring accessibility for future studies. Complementing the phylogenetic analysis, SDS-PAGE confirmed successful amplification of the 16 S rRNA gene, with a distinct band in lane “1B” corresponding to the expected molecular weight, validated by a 100 bp ladder and control lane (Fig. 2b). Together, these analyses establish the genetic identity and experimental reliability of the S1B isolate.
Thin-layer chromatography
The biochemical composition of the biosurfactant was examined using thin-layer chromatography (TLC) on a silica plate. Distinct spots were observed, and treatment with orcinol reagent produced bands indicative of carbohydrate-linked lipid moieties, characteristic of glycolipids. Bromothymol blue staining further revealed a yellow band, confirming the presence of sugar groups. In contrast, the ninhydrin test showed no bands, ruling out protein or peptide components. Collectively, these results indicate that the biosurfactant produced by the isolate is a glycolipid, composed of lipid and sugar fractions without detectable protein content. This characterization aligns with known microbial glycolipids, whose amphiphilic nature underlies their surface-active properties and biotechnological relevance.

Analysis of SDS-PAGE and a Phylogenetic Tree with Bootstrap Values. Using the 16 S-rRNA gene analysis of Bacillus species, MEGA 7 constructs the phylogenetic tree for S1B in (a). (b) shows the SDS-PAGE results for S1B. It shows DNA bands that show the position of genomic DNA and the PCR product, along with a 100 bp DNA ladder. Bootstrap values are indicated on the edges of nodes. The QC gel image was recorded in this crop format during the experiment, and the complete raw sequence data (chromatograms and consensus sequence) are provided in Supplementary Information as Supplementary Document S1.
Spectral characterization (FTIR, 1H NMR, 13C NMR, and LC-MS) of S1B
The synthesized compound S1B, identified as 3-(3-((4,5-dihydroxy-3-methoxy-6-methyltetrahydro-2 H-pyran-2-yl)oxy)decanamido)decanoic acid, was characterized using infrared (IR) spectroscopy, nuclear magnetic resonance (NMR), and liquid chromatography–mass spectrometry (LC-MS). The IR spectrum showed characteristic peaks at 665 cm−1 (C–H bending), 1735.62 cm−1 (C = O stretching), 3270 cm−1 (O–H stretching), and 2918.73 cm−1 (C = C stretching), confirming the presence of functional groups. The 1H NMR spectrum (400 MHz, CDCl₃) exhibited signals at 0.8–1.6 ppm (alkyl groups), 2.0–2.3 ppm (ester linkages), 1.99–2.23 ppm (alkyl protons), and 4.11–4.31 ppm (pyranose hydrogens). In contrast, the 13C NMR spectrum displayed resonances at 173.24 ppm (COOH), 172.87 ppm (COOCH2), and 130.01 ppm (vinylic CH = CH), supporting the structural framework. LC-MS analysis further confirmed the molecular composition with an [M + H]+ ion at m/z 517.79, consistent with the molecular formula C2₇H₅₁NO₈. Collectively, these spectral data validate the structure of S1B and provide a foundation for future studies on its biochemical and functional properties.
Structural characterization of novel isolated BS
Experimental instruments for structural characterization
The structural elucidation of the isolated compound was conducted using several advanced analytical instruments. Functional group determination was achieved using a JASCO FT/IR 4600 spectrophotometer. Proton and carbon environments were characterized by 1H and 13C nuclear magnetic resonance (NMR) spectroscopy on a Bruker spectrometer, with samples dissolved in DMSO-d₆ or CDCl₃ and tetramethyl silane (TMS) serving as the internal standard. Chemical shifts were reported in parts per million (ppm) relative to TMS. Molecular weights of the unknown isolated compounds were determined via mass spectrometry (MS) using a Shimadzu GC-MS system. Elemental composition, including carbon, hydrogen, and nitrogen content, was quantified with a PerkinElmer 240 elemental analyser. The characterization and evaluation of the two newly isolated surfactants were further supported by combined spectral analyses, including FTIR, 1H NMR, 13C NMR, and liquid chromatography-mass spectrometry (LC-MS).
FTIR analysis
Fourier transform infrared (FTIR) spectroscopy of compound S1B revealed characteristic peaks confirming its glycolipid nature. A peak at 665 cm−1 corresponded to C–H bending within hydrophobic alkyl chains, while absorption at 1167 cm−1 indicated C–O–C stretching typical of glycosidic bonds56. Prominent peaks at 1735 cm−1 and 1671 cm−1 represented carbonyl (C = O) stretching, suggesting carboxylic acid and acetate groups, respectively57. Additional peaks at 1375 cm−1 and 1462 cm−1 reflected alkyl group vibrational deformations. A distinct but unidentified band suggested the presence of additional molecular features requiring further investigation. Peaks at 3270 cm−1 and 2850 cm−1 were assigned to aliphatic C–H stretching in the sugar moiety and possible phosphine (P–H₃) contributions, respectively58,59. Collectively, these spectral features confirm the glycolipid structure of S1B and support its classification as a biosurfactant (Fig. S1), providing crucial insights into its molecular composition.
NMR analysis
The 1H NMR spectrum of biosurfactant S1B revealed distinct features consistent with a glycolipid structure. Signals at 0.8–1.6 ppm corresponded to aliphatic fatty acid chains, confirming the lipid fraction60. Peaks at 2.0–2.3 ppm were attributed to methylene protons (–CH2–) of the glycerol backbone adjacent to fatty acids, while the 4.1–4.3 ppm region indicated protons bound to oxygenated carbons, suggestive of glycosidic or ether linkages. Resonances at 4.9–5.3 ppm and 5.8–5.9 ppm reflected vinylic (C = C) protons, indicating unsaturation, and downfield signals at 7.2–7.3 ppm confirmed carboxylic acid and ester groups, reinforcing the glycolipid assignment (Fig. S2a).
Complementary 13C NMR analysis further supported this structure. Multiple resonances at 14.1–31.92 ppm corresponded to long-chain alkyl carbons typical of fatty acids, while a signal at 79.3 ppm suggested oxygenated carbons, consistent with sugar or glycosidic moieties (Fig. S2b). Together, the spectra confirmed the amphiphilic nature of S1B, comprising a hydrophobic fatty acid tail with possible unsaturation and a hydrophilic head containing ester/ether linkages and a carbohydrate component. This structural organization underlies its ability to reduce surface tension and form micelles, typical of glycolipid biosurfactants.
Molecular weight confirmation
The LC-MS analysis of biosurfactant compound S1B revealed a prominent peak at m/z 517.8, corresponding to a molecular formula of C27H51NO8 and a molecular weight of 517.79. This peak represents the intact biosurfactant molecule, indicating its successful isolation (Fig. S3). The fragmentation pattern also displayed key peaks at m/z 177.4 and m/z 339.6, suggesting the breakdown of the compound into distinct structural components.
The fragment observed at m/z 177.4 was assigned to the molecular formula C7H14O5, with a molecular weight of 178.18, corresponding to the polar head group of the biosurfactant. This fragment likely represents a sugar-like moiety, characteristic of biosurfactants, which typically contain polar groups for enhancing solubility in aqueous environments.
Additionally, the fragment at m/z 339.6 was associated with the molecular formula C22H45NO, and a molecular weight of 339.59, indicating the presence of a hydrophobic tail. This suggests a fatty acid or lipid-like chain structure, which is a common feature of biosurfactants responsible for interacting with non-polar substances and contributing to their surface activity.
Structural novelty of S1B
The structural characterization of S1B strongly supports its novelty as a biosurfactant with hybrid glycolipid–amide architecture described in prior sections. FTIR spectra revealed the presence of hydroxyl groups (3270–3380 cm−1), ester/amide carbonyl stretching (1735 cm−1), and glycosidic C–O–C linkages (1167–1214 cm−1), consistent with a sugar–lipid conjugate. LC–MS analysis identified a major ion at m/z 517.8 (C27H51NO8), along with diagnostic fragments at m/z 339.6 (C22H45NO; lipid–amide moiety) and m/z 177.4 (C₇H₁₄O₅; sugar unit), confirming the coexistence of both carbohydrate and amide-linked lipid domains. NMR spectra further supported this architecture, with proton resonances corresponding to long aliphatic chains (δ 0.8–1.6 ppm), sugar protons (δ 3.3–5.5 ppm), and an amide proton (~δ 7 ppm), while 13C NMR signals at δ 70–80 ppm and δ 170–180 ppm confirmed glycosidic and carbonyl carbons. Unlike classical rhamnolipids and sophorolipids, which lack an amide linkage, S1B exhibits a distinct glycolipid–amide hybrid structure, highlighting its structural uniqueness and potential for novel bioactivities.
Critical structural comparison
The structural characterization of S1B revealed distinct differences when compared with classical microbial glycolipids such as rhamnolipids and sophorolipids. FTIR analysis of S1B showed a broad O–H stretching vibration (3270–3380 cm−1), a sharp ester/amide C = O peak at 1735 cm−1, and glycosidic C–O–C stretches (1167–1214 cm−1). These features were partially similar to rhamnolipids and sophorolipids, both of which also exhibit hydroxyl and ester carbonyl vibrations around 3400 and 1730 cm−1, respectively61,62. However, LC–MS analysis of S1B revealed a major ion at m/z 517.8 (C27H51NO8) along with characteristic fragments at m/z 339.6 and 177.4, indicating the presence of a lipid–amide linkage coupled to a glycosidic sugar moiety. In contrast, rhamnolipids typically produce ions in the range of m/z 503–649 corresponding to mono- or di-rhamnolipids, while sophorolipids yield ions between m/z 589–621, depending on lactonic or acidic forms63,64. NMR spectra further supported these observations: the 1H NMR of S1B displayed resonances at δ 0.8–1.6 ppm (long aliphatic chain), δ 3.3–5.5 ppm (sugar protons), and a downfield signal near δ 7.0 ppm corresponding to an amide proton, whereas rhamnolipids and sophorolipids lack such amide-associated signals. Similarly, 13C NMR confirmed the presence of glycosidic carbons (70–80 ppm) and amide carbonyls (170–180 ppm), distinguishing S1B from ester-only glycolipids. Taken together, these results strongly suggest that S1B represents a novel glycolipid–amide hybrid biosurfactant, differing structurally from rhamnolipids and sophorolipids, which are strictly ester-linked glycolipids. This hybrid architecture may underlie the unique biological properties of S1B.
In vitro quality assessment
Drop collapse assay
A water drop was observed to remain intact on the hydrophobic surface, as illustrated in Fig. 3a, indicating no significant surface activity. In contrast, a drop of cell-free supernatant exhibited collapse upon contact with the hydrophobic surface, as shown in Fig. 3b. This collapse suggests the presence of surface-active compounds within the supernatant.
Further comparison was made with a positive control, consisting of 10% sodium dodecyl sulfate (SDS), a known surfactant, which also demonstrated a similar collapsing behavior as depicted in Fig. 3c. The collapsing behavior observed in sample S1B is thus comparable to that of the 10% SDS control, supporting the conclusion that the supernatant contains microbial biosurfactants. These findings strongly indicate that the microbial culture responsible for the supernatant production is capable of synthesizing biosurfactants, as evidenced by the drop collapsing assay results.

Drop collapse tests on parafilm paper demonstrate the collapsing behavior of the cell-free supernatant.
Microplate assay
To confirm the presence of biosurfactants (BS), supernatants from sample S1B were analyzed in triplicate using a 96-well plate assay, as demonstrated in (Fig. S4). The detection of BS was evidenced by distinct optical distortions within the wells. This distortion, characterized by the formation of a concave meniscus, is attributed to the reduction in surface tension, a hallmark of biosurfactant activity. The concave meniscus formation provided further validation of the presence of microbial biosurfactants in the supernatants, reinforcing their surface-active properties in the sample.
Emulsification stability test (Emulsification Index—E24)
The emulsification capacity of the biosurfactant S1B was evaluated against various oils, including coconut, mustard, olive, hair oil, petrol, and kerosene. As shown in Fig. S5, S1B exhibited emulsification index (E24) values exceeding 50%, with the highest activity in mustard oil (~ 80%) and the lowest in petrol (~ 60%). This variation reflects the compound’s higher efficiency with viscous oils (mustard, olive, coconut) compared to lighter hydrocarbons (petrol, kerosene). The strong emulsification of vegetable oils highlights S1B’s potential in food, cosmetic, and pharmaceutical formulations, where stable oil-based emulsions are essential.
Additionally, its moderate performance with kerosene and engine oil suggests applicability in environmental sectors, such as oil spill remediation and hydrocarbon degradation, though further optimization may enhance effectiveness. Importantly, S1B’s biodegradability and low toxicity offer a sustainable alternative to synthetic surfactants, making it particularly attractive for industries seeking to balance emulsification performance with environmental safety.
Oil displacement assay
The surface-active properties of biosurfactant S1B were evaluated using an oil displacement assay. In the control plate (Fig. 4a), the yellow oil layer remained undisturbed, forming a uniform surface with a diameter of 4.9 cm, indicating no reduction in surface tension. In contrast, the addition of S1B (Fig. 4b) produced a clear displacement zone, with oil displaced 2.7 cm from the center. The visible circular zone and the formation of a concave meniscus confirmed the disruption of the oil–water interface, demonstrating the surface-active capability of S1B. These findings qualitatively confirm biosurfactant production, with the extent of oil displacement directly reflecting the effectiveness of S1B in reducing surface tension.

The above image portrays the oil displacement observed at the water surface (a). In contrast (b) provide evidence of the oil displacement capabilities of the S1B.
Critical micelle concentration assay
The surface tension–reducing properties of isolate S1B were evaluated by measuring surface tension across increasing concentrations until reaching the critical micelle concentration (CMC). As expected, surface tension decreased with increasing concentration and stabilized beyond the CMC65. Using Sodium Dodecyl Sulfate (SDS) as a positive control (Fig. 5a, red line), surface tension dropped sharply from ~ 80 mN/m to 35 mN/m at 25 µg/mL, after which it plateaued, indicating the CMC of SDS. In contrast, S1B (blue line) showed a more gradual reduction, decreasing from ~ 80 mN/m to ~ 50 mN/m, with a CMC between 75 and 100 µg/mL.
These results confirm that S1B effectively reduces surface tension, although at a higher concentration compared to SDS. Notably, the CMC of S1B falls within the reported range for rhamnolipids (10–200 µg/mL)61,62, indicating that its surface-active properties are comparable to those of established glycolipid biosurfactants. The ability of S1B to lower surface tension to ~ 50 mN/m underscores its potential as a novel biosurfactant for industrial and environmental applications.
Underlying mechanisms of in-vitro anticancer assay
In this study, we investigated the effects of S1B on several cellular processes, including its impact on cell viability (MTT assay), cell cycle progression, apoptosis induction, and oxidative stress, assessed through the DPPH assay. Our findings revealed significant S-phase arrest, indicative of DNA damage caused by the compound, which ultimately led to apoptosis. Analysis of mitochondrial membrane potential (MMP) via the JC-1 assay showed increased cell death with rising concentrations of S1B, suggesting apoptosis likely triggered by cytochrome c release, a key early event in the apoptotic pathway. Additionally, the propidium iodide (PI) live-dead assay revealed that S1B disrupts plasma membrane integrity, a hallmark of cell death. Collectively, these results provide a comprehensive understanding of the anticancer activity of S1B, demonstrating its ability to induce apoptosis through DNA damage, mitochondrial dysfunction, and disruption of plasma membrane integrity.
Anti-oxidant assay
The reduction of DPPH to DPPH-H occurs through electron transfer from the biosurfactant (BS), leading to decolorization of the DPPH solution, signifying a decrease in free radical absorbance66. As the concentration of BS (S1B) increases, a noticeable color change from purple to pale yellow was observed, correlating with increased DPPH scavenging activity. An increase in the concentration of BS (S1B) resulted in a corresponding rise in the percentage of scavenging activity (Fig. 5b). This concentration-dependent effect confirms the antioxidant capability of S1B, as the electron transfer stabilizes DPPH by converting it from its unstable radical form (DPPH) to a more stable, reduced form (DPPH-H). The IC50 value of S1B against the DPPH radical was determined to be 22.87 ± 1.5 µg/mL, highlighting its potent antioxidant activity.
MTT assay
Cytotoxicity assays are essential for assessing drug safety and screening, as they provide predictive insights into the potential toxic effects of chemicals on various tissues67,68. The MTT assay, a widely utilized method, is renowned for its sensitivity and capacity for high-throughput screening69. This assay relies on the ability of metabolically active cells to enzymatically reduce tetrazolium salt (MTT) within the mitochondria, producing water-insoluble purple formazan crystals, which serve as a robust indicator for early cytotoxicity evaluation70,71.
The current experimental results revealed a clear dose-dependent cytotoxicity profile. Specifically, HeLa cells exposed to increasing concentrations of S1B for 24 h exhibited a significant reduction in viability, yielding an IC₅₀ of 71.0 µM (95% CI: 64.5–80.6 µM) (Fig. 6a). In contrast, the IC₅₀ for non-cancerous HEK293 cells was not reached even at 200 µM, with less than 15% cytotoxicity observed at the highest dose. This translates into a Selectivity Index (SI) > 2.8, underscoring preferential cytotoxicity toward cancer cells while sparing normal cells. Comparative analysis across concentrations further confirmed that S1B was significantly more cytotoxic to HeLa than to HEK293 cells at all doses tested (p < 0.001, one-way ANOVA with Tukey’s post-hoc test) (Fig. 6b).

Critical Micelle Concentration (CMC) and Anti-oxidant Potential Assay of BSs Derived from Bacillus spp. (a) Critical Micelle Concentration (CMC) of S1B. The X-axis represents the concentration of the biosurfactant, while the Y-axis indicates the CMC value (nM/n). The red line shows the positive control (SDS), and the blue line represents S1B. Arrow marks indicate the concentration at which the respective isolates achieved their CMC. (b) represents Anti-oxidant Potential of S1B evaluated via DPPH Radical Scavenging Assay.
When benchmarked against standard anticancer drugs doxorubicin72 for 24 h, S1B demonstrated lower potency but superior selectivity. For instance, doxorubicin exhibits an IC50 of ~ 2.4 µM in HeLa cells but also a strong cytotoxic effect in HEK293 cells (IC50 ~0.9 µM), yielding a poor SI of 0.38. In contrast, S1B displayed weaker potency in HeLa but negligible toxicity in HEK293, giving it a much higher SI (> 2.8). These findings suggest that while S1B may not match the potency of classical drugs such as doxorubicin, it possesses a more favorable therapeutic window and aligns with reported IC50 ranges for microbial biosurfactants such as rhamnolipids (61–80 µg/mL), sophorolipids (12–476 µg/mL), and surfactin (~ 73 µM).
For statistical rigor, IC₅₀ values and their 95% confidence intervals were determined using a non-linear 4-parameter logistic regression model (GraphPad Prism v9.0), with confidence limits estimated by the profile-likelihood method. All assays were performed in triplicate (n = 3), and data are reported as mean ± SD. Collectively, these findings demonstrate that although S1B is less potent than doxorubicin, it exhibits markedly greater selectivity, highlighting its potential as a safer biosurfactant-derived anticancer lead.

MTT cytotoxicity assay of biosurfactant S1B against HeLa cancer cells and HEK293 normal cells. (a) Dose–response curve showing cell viability (%) after 24 h treatment with S1B. IC50 values were estimated as 71.0 µM for HeLa and > 200 µM for HEK293. (b) Bar graph representation of cell viability at different concentrations. Data are expressed as mean ± SD (n = 3). Statistical significance was assessed by one-way ANOVA followed by Tukey’s post-hoc test. ***p < 0.001 vs. control.
PI live/dead assay
Flow cytometry analysis was performed to assess mitochondrial membrane potential (MMP) loss and membrane integrity under different treatments (Fig. 7). The unstained control (no PI) showed negligible PI fluorescence (0.01% PI-positive cells, P2), confirming intact membranes and healthy cells (Fig. 7a). The untreated control exhibited only 6.42% MMP loss, indicating minimal baseline apoptotic activity (Fig. 7b).
As expected, Taxol (12 µM) induced substantial cytotoxicity, with 50.54% PI-positive cells and ~ 55% MMP loss, consistent with apoptosis induction through microtubule disruption and mitochondrial depolarization (Fig. 7c and e). In comparison, S1B at 50 µM caused moderate mitochondrial depolarization (~ 30% MMP loss, Fig. 7d), whereas increasing the concentration to 100 µM markedly enhanced cytotoxicity, with 62.92% PI-positive cells (P2), surpassing Taxol-induced effects (Fig. 7d and e).
These results demonstrate that S1B exerts dose-dependent cytotoxicity against HeLa cells, likely by disrupting membrane integrity and triggering apoptosis. The stronger effect observed at 100 µM compared to Taxol highlights the potential of S1B as a promising candidate for anticancer applications, particularly in therapies targeting mitochondrial stability and cell membranes.

Propidium iodide (PI) Live/Dead assay showing cytotoxic effect of S1B on HeLa cells. Flow cytometry dot plots of (a) unstained cells, (b) untreated control, (c) positive control (Taxol, 12 µM), and cells treated with (d) S1B 50 µM and (e) S1B 100 µM for 24 h. (f) Bar graph quantification of PI-positive (dead) cells. Data are presented as mean ± SD (n = 3). Statistical analysis was performed using one-way ANOVA with Tukey’s post-hoc test. ***p < 0.001 vs. untreated control.
S-phase arrest induced by BSs in HeLa
The cell cycle analysis demonstrates the impact of biosurfactant S1B on cell cycle progression compared to untreated cells and a positive control (Taxol). In untreated cells, the majority were in the G1 phase (65.90%), with fewer cells in the S phase (13.86%) and G2/M phase (17.48%), indicating normal cell proliferation (Fig. 8a).
Upon treatment with 100 µM of S1B, a significant increase in S phase cells (27.60%) was observed, accompanied by a reduction in the G1 population (47.36%) and a slight change in G2/M phase cells (23.25%). This suggests that S1B induces cell cycle arrest, primarily in the S phase. Increasing the S1B concentration to 200 µM resulted in an even greater accumulation of cells in the S phase (46.41%), with further reduction in the G1 phase (29.00%), highlighting a dose-dependent effect (Fig. 8b,c).
In contrast, Taxol (12 µM) arrested cells in the G2/M phase (37.19%), as expected, demonstrating its well-known mechanism of action as a mitotic inhibitor. These results suggest that S1B specifically disrupts the cell cycle by causing S phase arrest, with a more pronounced effect at higher concentrations, whereas Taxol induces G2/M phase arrest (Fig. 8d).
The bar graph in Fig. 8e clearly shows the distribution of cells across the different phases (G1, S, and G2/M) for each treatment group. The shift from G1 to S phase arrest seen with S1B treatment suggests that the biosurfactant disrupts key regulatory checkpoints during DNA replication, possibly through interactions with cyclin-dependent kinases (CDKs) or other regulatory proteins involved in the S phase.

Effect of biosurfactant S1B on cell cycle distribution of HeLa cells. Flow cytometry histograms showing cell cycle distribution in (a) untreated control, (b) S1B 100 µM, (c) S1B 200 µM, and (d) positive control (Taxol, 12 µM) after 24 h treatment. (e) Quantification of the percentage of cells in G₁, S, and G2/M phases. Data are expressed as mean ± SD (n = 3). Statistical analysis was performed using one-way ANOVA with Tukey’s post-hoc test. **p < 0.01, ***p < 0.001 vs. untreated control.
Mitochondrial membrane potential (MMP loss) in cancer cells
Flow cytometry analysis with JC-1 dye was performed to assess mitochondrial membrane potential (MMP) under different treatments (Fig. 9). The unstained control (Fig. 9a) showed no fluorescence in either red (PE-A) or green (FITC-A) channels, confirming 0.00% MMP loss. In the untreated group stained with JC-1 (Fig. 9b), two populations were evident: intact mitochondria with high red fluorescence (P2, 80.74%) and depolarized mitochondria with green fluorescence (P3, 12.00%). This baseline depolarization reflects natural variability within the cell population.
The positive control, Taxol (12 µM), induced significant mitochondrial depolarization, with 53.07% of cells in P3 and only 30.14% in P2 (Fig. 9c), consistent with its known cytotoxic action on mitochondrial stability. Treatment with S1B at 50 µM resulted in moderate mitochondrial depolarization, with 58.31% of cells in P3 and 33.03% in P2 (Fig. 9d), indicating a strong but lower effect compared to Taxol. At 100 µM, S1B markedly enhanced mitochondrial disruption, with 81.86% of cells in P3 and only 11.41% retaining intact MMP in P2 (Fig. 9e).
The bar graph (Fig. 9f) summarizes these findings, showing ~ 12% MMP loss in the untreated control, ~ 53% with Taxol, and a dose-dependent increase for S1B (~ 58% at 50 µM and ~ 81% at 100 µM). These results confirm that S1B induces mitochondrial depolarization in a concentration-dependent manner, with higher doses exhibiting a stronger effect than Taxol.

JC-1 assay for mitochondrial membrane potential (MMP) loss in HeLa cells after S1B treatment. Flow cytometry dot plots showing JC-1 red/green fluorescence ratio in (a) unstained control, (b) untreated control, (c) positive control (Taxol, 12 µM), and cells treated with (d) S1B 50 µM and (e) S1B 100 µM for 24 h. (f) Quantification of the percentage of depolarized (green) cells. Data are presented as mean ± SD (n = 3). Statistical analysis was performed using one-way ANOVA with Tukey’s post-hoc test. **p < 0.01, ***p < 0.001 vs. untreated control.
Artificial neural network (ANN) outcomes
The artificial neural network (ANN) model was employed to estimate biosurfactant yield (g/L) and emulsification index at 24 h (E24%), reflecting stability and effectiveness. The model incorporated multiple input parameters, including temperature, pH, incubation period, carbon source, nitrogen source, and hydrocarbon source, derived from a dataset of 81 samples (Table 2). The workflow of the ANN analysis is illustrated in Fig. 10a,b, outlining the sequential steps used to process input variables and generate reliable predictions of biosurfactant properties.
The ANN analysis was conducted in three phases: training, testing, and validation. For training, 70% of the dataset (56 samples) was used, while the remaining data were divided equally into testing (12 samples, 15%) and validation (12 samples, 15%). The model was trained using a backpropagation algorithm with the Adam optimizer and mean squared error (MSE) as the loss function, ensuring convergence and minimized prediction error. Table 3 summarizes the predicted values and corresponding error metrics for the complete dataset.
An accurate ANN model is expected to have an R2 value close to 1 and a root-mean-square error (RMSE) approaching 053. The performance of the ANN in estimating biosurfactant yield (g/L) was assessed using these parameters. The R2 values were 0.9786 for training (Fig. 11a), 0.9298 for testing (Fig. 11b), and 0.9600 for validation (Fig. 11c), with an overall mean of 0.92838. The RMSE for the model was 0.0324, indicating a good fit to the experimental data.

Artificial Neural Network (ANN) model for biosurfactant yield prediction. (a) Schematic representation of the input variables considered for biosurfactant yield optimization, including temperature, pH, incubation period, carbon sources, nitrogen sources, and hydrocarbon sources. (b) ANN model architecture showing the input layer (process parameters), hidden layer (neurons with weighted connections), and the output layer representing the predicted biosurfactant yield (mg/L).
Comparisons between actual and predicted yields for training, testing, and validation sets (Fig. 11d–f) further confirmed the accuracy of the ANN model. In the training set, actual and predicted yields (~ 0.7 g/L) were closely aligned with minimal deviation and narrow standard deviation (SD), demonstrating strong model performance. For the test set (~ 0.6 g/L), predictions remained accurate, though with slightly broader SDs, reflecting greater variability in unseen data. In the validation set, predicted and actual yields were comparable, though predicted values exhibited slightly higher variability—an expected outcome for fine-tuning performance.
Across all datasets, the small variations between actual and predicted values confirmed the robustness of the model, with minor deviations in the test set likely due to the inherent variability of biosurfactant production. Overall, the high R2 values and low RMSE underscore the ANN’s effectiveness for biosurfactant yield estimation.
Importantly, the model highlighted pH, hydrocarbon source, and temperature as critical factors influencing production of bisurfactant. The highest accuracy was observed for sample 53 (Table 3), where the actual yield (0.3710 g/L) was nearly identical to the predicted yield (0.3713 g/L). This precision demonstrates the potential of ANN-based modeling for process optimization and scale-up of biosurfactant production in industrial applications.

Performance evaluation of the ANN model for biosurfactant yield prediction. (a–c) Actual versus predicted plots for training (a), test (b), and validation (c) datasets, showing strong correlation (R2 = 0.9786, 0.9298, and 0.9600, respectively). (d–f) Comparison of mean ± SD between actual and predicted biosurfactant yields for training (d), test (e), and validation (f) datasets, indicating a close agreement between experimental and model-predicted values.
Comparisons with traditional methods
The comparative analysis of MLP-ANN and RSM (Fig. 12) demonstrated that both approaches provided reliable predictions of biosurfactant yield, with data points clustering closely around the regression line in predicted vs. actual plots (Fig. 12a). Residual vs. predicted plots indicated that residuals for both models were symmetrically distributed around zero with minimal systematic bias, although ANN showed a narrower spread across the prediction range (Fig. 12b). This trend was further supported by the residual distribution and violin plots, where ANN exhibited a more compact and centered distribution with fewer extreme deviations compared to RSM, highlighting its superior predictive stability (Fig. 12c). Overall, while ANN offered modestly improved accuracy and consistency, RSM remained valuable for its interpretability and visualization of factor interactions, suggesting that the two methods serve as complementary tools for biosurfactant yield optimization.
Optimization using RSM
To better understand the combined influence of key process variables on biosurfactant production the response surface plots Fig. 13 illustrate the interactive effects of temperature, pH, and incubation period on biosurfactant yield. When incubation period was fixed at 6 days (top panel), the contour and 3D plots (Fig. 13a,b) revealed that yield increased with temperature and pH, with optimum response observed near 35 °C and neutral pH (~ 7). In the second panel, where temperature was fixed at 35 °C, both incubation period and pH exhibited strong positive effects on yield (Fig. 13c,d), with maximum productivity achieved under longer incubation periods (8–10 days) combined with neutral to slightly alkaline pH (7–8). Similarly, when pH was fixed at 7 (bottom panel), yield improved with both temperature and incubation period, again highlighting (Fig. 13e,f) moderate temperatures (35–37 °C) and prolonged incubation as favorable conditions.

Comparison between ANN and RSM models. Predicted vs. actual plots (a), residuals vs. predicted plots (b), and residual distribution plots comparing MLP-ANN and RSM (quadratic model) (c). Both models showed comparable prediction accuracy, with ANN exhibiting slightly narrower and more symmetric residual distribution. This indicates marginally better stability of ANN predictions, while RSM provides robust polynomial fitting.

Response Surface Methodology (RSM) optimization plots. Contour and 3D plots showing interaction effects of (A) temperature and pH, (B) pH and incubation period, and (C) temperature and incubation period. Maximum yield was achieved at neutral pH (~ 7), moderate temperature (35–37 °C), and longer incubation (8–10 days), highlighting key factor interactions and optimal conditions.
The comparative analysis of factor influence using RSM and MLP-ANN provided complementary insights into biosurfactant yield optimization. The RSM response surface plots identified pH as the most influential factor, followed by incubation period and temperature, with all three showing synergistic effects on yield. In contrast, feature importance analysis of the ANN model also highlighted pH as the strongest contributor (~ 48.7%), but ranked the hydrocarbon source (~ 46.6%) as the second most significant predictor, while temperature (~ 4.6%) appeared third and incubation period showed negligible contribution. This divergence suggests that while RSM captures the primary experimental trends in pH, incubation, and temperature, ANN is able to detect nonlinear dependencies and latent effects from substrate composition (e.g., hydrocarbon source). Together, the two approaches provide a more holistic understanding: RSM offers interpretable optimization of controllable parameters, whereas ANN uncovers additional hidden influences in the dataset.
Benchmarking across machine learning models
The benchmarking of machine learning models for biosurfactant yield prediction is summarized in Fig. 14. In the predicted vs. actual plots (Fig. 14a), SVR exhibited the closest alignment with the diagonal, indicating the best predictive accuracy, followed by Linear Regression, Polynomial Regression, and MLP-ANN, which also showed strong correlations. By contrast, Decision Tree and Random Forest models showed larger deviations, underestimating and overestimating in certain regions. The residual vs. predicted plots (Fig. 14b) demonstrated that residuals were generally centered around zero, confirming unbiased predictions, although SVR, Linear, and MLP-ANN had tighter clustering compared to Decision Tree and Random Forest. The residual distribution plots (Fig. 14c) further validated these trends: SVR and Linear models had the narrowest distributions, MLP-ANN and Polynomial Regression displayed balanced spreads, whereas Decision Tree and Random Forest exhibited wider variability.
The quantitative performance metrics (RMSE and R2) are presented in Table 4. Consistent with the graphical trends, SVR achieved the best performance (R2 = 0.8904), followed closely by Linear Regression, Polynomial Regression, and MLP-ANN. Decision Tree and Random Forest showed relatively lower accuracy.
Overall, these analyses demonstrate that SVR achieved the best predictive performance, while MLP-ANN performed comparably to Linear and Polynomial Regression and clearly outperformed Decision Tree and Random Forest. This benchmarking validates ANN as a competitive predictive tool and reinforces the importance of using multiple models to establish robust conclusions.

Benchmarking of machine learning models for biosurfactant yield prediction. (a) Predicted vs. actual, (b) residual vs. predicted, and (c) residual distributions across models. SVR and Linear Regression showed the highest accuracy, while MLP-ANN performed competitively with regressions and surpassed tree-based models.
To evaluate the robustness of the ANN model, prediction accuracy and error distribution were further analyzed (Fig. 15). Figure 15a shows the scatter plot of actual vs. predicted biosurfactant yields. Most data points lie close to the ideal prediction line (y = x, gray dashed), while the regression fit (red line, R2 = 0.93) confirms a strong correlation between predicted and actual values. The model achieved a MAE of 0.024 g/L, RMSE of 0.032 g/L, and MAPE of 7.03%, indicating high predictive accuracy within acceptable error thresholds for bioprocess optimization. Figure 15b presents the residual plot, where residuals (Predicted – Actual) are scattered randomly around zero. The absence of systematic bias suggests that the ANN did not consistently over- or under-predict biosurfactant yields. Deviations observed at low-yield values are likely due to biological variability in microbial growth kinetics and limited dataset size, rather than model inadequacy.
Together, these results confirm that the ANN model reliably captured the nonlinear relationship between input factors and biosurfactant yield, while maintaining error levels consistent with biological system variability.

(a) Actual vs. predicted biosurfactant yields with regression fit (red line, 95% CI shaded) and ideal prediction line (y = x, dashed). Predictions closely match experimental values (R2 = 0.93). (b) Residual plot showing errors randomly distributed around zero, indicating no systematic bias; deviations at low yields reflect biological variability.
Statistical analysis
All biological experiments were performed in triplicates (n = 3), and the data are expressed as mean ± standard deviation (SD). Statistical analyses were carried out using one-way ANOVA followed by Tukey’s post hoc test to evaluate the significance of differences among treatment groups. A p-value of < 0.05 was considered statistically significant, and significance levels were denoted as ns (not significant), *p < 0.05, **p < 0.01, and **p < 0.001 in the figures. The inclusion of appropriate controls, such as Taxol (positive control) in cytotoxicity and apoptosis assays, and ascorbic acid in antioxidant assays, ensured the reliability of the results. The observed dose-dependent effects were consistent across independent replicates, confirming reproducibility and statistical robustness of the findings.
Conclusion
This study presents a significant advancement in the field of microbial biosurfactants by isolating and characterizing a novel glycolipid biosurfactant (S1B) from Bacillus species collected from the Ganga River. Through the integration of traditional microbiological techniques with advanced spectroscopic characterization tools—FTIR, 1H and 13C NMR, and LC-MS—we have established the structural identity and glycolipid nature of the biosurfactant. The study further explored its anticancer efficacy through a battery of in vitro assays, it demonstrated notable cytotoxic effects on HeLa cervical cancer cells, alterations in mitochondrial membrane potential, modulation of cell cycle dynamics, and antioxidant properties. These findings collectively support the biomedical relevance of glycolipid biosurfactants and position S1B as a promising candidate for future therapeutic development.
A key innovation of this work lies in the use of a multilayer perceptron artificial neural network (MLP-ANN) model for production optimization. This AI-driven approach enabled the identification of optimal medium components and cultivation parameters, significantly enhancing the biosurfactant yield. Such integration of machine learning with bioprocess optimization represents a step toward sustainable, scalable, and economically feasible biosurfactant production—an essential requirement for industrial translation.
Rather than positioning ANN as inherently superior, we emphasize its role as a flexible predictive tool that complements conventional approaches such as RSM, providing a competitive framework for optimizing biosurfactant production. Importantly, this research addresses several unmet needs in the biosurfactant field: the discovery of new bioactive molecules from underexplored ecological niches, validation of their bioactivity in cancer models, and the incorporation of intelligent systems for process improvement. By bridging microbiology, analytical chemistry, bioassays, and AI, this work establishes a comprehensive framework for biosurfactant discovery and development.
Looking ahead, this study opens several promising avenues for future research that can further strengthen the biomedical and biotechnological potential of the glycolipid biosurfactant S1B. One critical direction involves mechanistic investigations using advanced omics technologies—such as transcriptomics, proteomics, and pathway analysis—to elucidate the molecular basis of S1B’s anticancer effects. Additionally, expanding the cytotoxicity profiling across a wider spectrum of cancer and non-cancerous cell lines will provide insights into its selectivity and safety, which are essential for therapeutic development. In vivo validation through preclinical studies in appropriate animal models will be crucial to assess pharmacokinetics, biodistribution, toxicity, and overall therapeutic efficacy under physiological conditions. To support future translational and industrial applications, scaling up production using bioreactors will help confirm the effectiveness of the ANN-predicted culture conditions at a larger scale. Moreover, formulation development using advanced drug delivery systems could significantly improve the stability, bioavailability, and targeted delivery of S1B, further enhancing its clinical potential. These future directions collectively underscore a translational roadmap for harnessing S1B in sustainable, targeted anticancer therapy.
In summary, this study not only introduces a novel biosurfactant with promising anticancer activity but also establishes a forward-looking strategy for its sustainable production. It contributes meaningfully to the evolving landscape of bio-based therapeutics and green biomanufacturing, addressing global demands for safer, eco-friendly, and effective biomedical solutions.
Data availability
All data generated or analysed during this study are included in this published article and its supplementary information files. The 16 S rRNA gene sequence of the biosurfactant-producing Bacillus strain (S1B) has been submitted to the NCBI GenBank database and is available under the accession number MW578970. Additional datasets supporting the findings of this study are available from the corresponding author upon reasonable request.
References
-
Kaur, H. et al. Biosurfactants as promising surface-active agents: current understanding and applications. In Multifunctional Microbial Biosurfactants, 271–306 https://doi.org/10.1007/978-3-031-31230-4_13 (Springer Nature Switzerland, 2023)
-
Saikia, R. R., Deka, S. & Sarma, H. Biosurfactants from bacteria and fungi: perspectives on advanced biomedical applications. Biosurfactants for a sustainable future: production and applications in the environment and biomedicine. 5, 293–315. https://doi.org/10.1002/9781119671022.ch13 (2021).
-
Rofeal, M. & El-Malek, F. A. Valorization of lipopeptides biosurfactants as anticancer agents. Int. J. Pept. Res. Ther. 27, 447–455. https://doi.org/10.1007/s10989-020-10105-8 (2021).
-
Adu, S. A., Twigg, M. S., Naughton, P. J., Marchant, R. & Banat, I. M. Biosurfactants as anticancer agents: glycolipids affect skin cells in a differential manner dependent on chemical structure. Pharmaceutics 14(2), 360. https://doi.org/10.3390/pharmaceutics14020360 (2022).
-
Isoda, H., Kitamoto, D., Shinmoto, H., Matsumura, M. & Nakahara, T. Microbial extracellular glycolipid induction of differentiation and Inhibition of the protein kinase C activity of human promyelocytic leukemia cell line HL60. Biosci. Biotechnol. Biochem. 61(4), 609–614. https://doi.org/10.1271/bbb.61.609 (1997).
-
Christova, N. et al. Chemical structure and in vitro antitumor activity of rhamnolipids from Pseudomonas aeruginosa BN10. Appl. Biochem. Biotechnol. 170, 676–689. https://doi.org/10.1007/s12010-013-0253-z (2013).
-
Hussein, H. A. & Abdullah, M. A. Biosurfactant as a vehicle for targeted antitumor and anticancer drug delivery. In Green Sustainable Process for Chemical and Environmental Engineering and Science, 299–317 https://doi.org/10.1016/B978-0-323-85146-6.00019-X (Academic Press, 2022).
-
Wu, F. et al. The oncogenic role of APC/C activator protein Cdc20 by an integrated pan-cancer analysis in human tumors. Front. Oncol. 11, 721797. https://doi.org/10.3389/fonc.2021.721797 (2021).
-
Jahan, R., Bodratti, A. M., Tsianou, M. & Alexandridis, P. Biosurfactants, natural alternatives to synthetic surfactants: physicochemical properties and applications. Adv. Colloid Interface Sci. 275, 102061. https://doi.org/10.1016/j.cis.2019.102061 (2020).
-
Hasani zadeh, P., Moghimi, H. & Hamedi, J. Biosurfactant production by mucor circinelloides: environmental applications and surface-active properties. Eng. Life Sci. 18(5), 317–325. https://doi.org/10.1002/elsc.201700149 (2018).
-
Fracchia, L., Cavallo, M., Martinotti, M. G. & Banat, I. M. Biosurfactants and bioemulsifiers biomedical and related applications–present status and future potentials. Biomedical Sci. Eng. Technol. 14(1), 1–49 (2012).
-
Inès, M. & Dhouha, G. Glycolipid biosurfactants: potential related biomedical and biotechnological applications. Carbohydr. Res. 416, 59–69. https://doi.org/10.1016/j.carres.2015.07.016 (2015).
-
Gudiña, E. J., Rangarajan, V., Sen, R. & Rodrigues, L. R. Potential therapeutic applications of biosurfactants. Trends Pharmacol. Sci. 34(12), 667–675. https://doi.org/10.1016/j.tips.2013.10.002 (2013).
-
Eswari, S. Multiobjective simultaneous optimization of biosurfactant process medium by integrating differential evolution with artificial neural networks. Indian J. Chem. Technol. (IJCT). 23(5), 335–344 (2016).
-
Santos, D. K., Rufino, R. D., Luna, J. M., Santos, V. A. & Sarubbo, L. A. Biosurfactants: multifunctional biomolecules of the 21st century. Int. J. Mol. Sci. 17(3), 401. https://doi.org/10.3390/ijms17030401 (2016).
-
Zhang, S. F., Wang, X. L., Yang, X. Q. & Chen, N. Autophagy-associated targeting pathways of natural products during cancer treatment. Asian Pac. J. Cancer Prev. 15(24), 10557–10563 (2015).
-
Behera, B. K. et al. Metagenomic analysis reveals bacterial and fungal diversity and their bioremediation potential from sediments of river Ganga and Yamuna in India. Front. Microbiol. 11, 556136. https://doi.org/10.3389/fmicb.2020.556136 (2020).
-
Bowes, M. J. et al. Nutrient and microbial water quality of the upper Ganga River, India: identification of pollution sources. Environ. Monit. Assess. 192, 1–20. https://doi.org/10.1007/s10661-020-08456-2 (2020).
-
Saravanan, V. & Vijayakumar, S. Isolation and screening of biosurfactant producing microorganisms from oil-contaminated soil. J. Acad. Indus Res. 1(5), 264–268 (2012).
-
Walter, V., Syldatk, C. & Hausmann, R. Screening concepts for the isolation of biosurfactant-producing microorganisms. Biosurfactants 1–3. https://doi.org/10.1007/978-1-4419-5979-9_1 (2010).
-
Tempest, D. W. & Meers, J. L. The influence of NaCl concentration of the medium on the potassium content of aerobacter aerogenes and on the inter-relationships between potassium, magnesium and ribonucleic acid in the growing bacteria. Microbiology 54(3), 319–325. https://doi.org/10.1099/00221287-54-3-319 (1968).
-
Rivera-Araya, J. et al. Osmotic imbalance, cytoplasm acidification and oxidative stress induction support the high toxicity of chloride in acidophilic bacteria. Front. Microbiol. 10, 2455. https://doi.org/10.3389/fmicb.2019.02455
-
Guo, X. et al. Postharvest calcium chloride treatment strengthens cell wall structure to maintain Litchi fruit quality. Foods 12(13), 2478. https://doi.org/10.3390/foods12132478 (2023).
-
Puri, S., Heriansyah, P. & Nopsagiarti, T. Potassium dihydrogen phosphate (KH2PO4) and kinetin enhance the growth of Dendrobium sonia somatic embryos (Kalium Dihidrogen Fosfat (KH2PO4) Dan Kinetin meningkatkan Untuk Pertumbuhan embrio Somatik dendrobium Sonia). Jurnal Biologi Indonesia. 18(1), 41–50. https://doi.org/10.47349/jbi/18012022/41 (2022).
-
Pylak, M., Oszust, K. & Frąc, M. Optimization of growing medium and preservation methods for plant beneficial bacteria, and formulating a microbial biopreparation for raspberry naturalization. Agronomy 11(12), 2521. https://doi.org/10.3390/agronomy11122521 (2021).
-
Thi Nguyen, H. Y. & Tran, G. B. Optimization of fermentation conditions and media for production of glucose isomerase from Bacillus megaterium using response surface methodology. Scientifica. 2018 (2018).
-
Das, R. P. et al. Isolation, characterization, and multimodal evaluation of novel glycolipid biosurfactant derived from Bacillus species: A promising Staphylococcus aureus tyrosyl-tRNA synthetase inhibitor through molecular docking and MD simulations. Int. J. Biol. Macromol. 261, 129848 (2024).
-
Chen, W. P. & Kuo, T. T. A simple and rapid method for the preparation of gram-negative bacterial genomic DNA. Nucleic Acids Res. 21(9), 2260 (1993).
-
Tamura, K. & Nei, M. Estimation of the number of nucleotide substitutions in the control region of mitochondrial DNA in humans and chimpanzees. Mol. Biol. Evol. 10(3), 512–526 (1993).
-
S. Kumar, G. Stecher, K. Tamura, MEGA7: Molecular Evolutionary Genetics Analysis version 7.0 for bigger datasets, Mol. Biol. Evol. 33 (2016), 1870-1874.
-
Skorupa, A. & Gierak, A. Detection and visualization methods used in thin-layer chromatography. JPC–Journal Planar Chromatography–Modern TLC. 24, 274–280 (2011).
-
Das, P., Mukherjee, S. & Sen, R. Biosurfactant of marine origin exhibiting heavy metal remediation properties. Bioresour Technol. 100(20), 4887–4890. https://doi.org/10.1016/j.biortech.2009.05.035 (2009).
-
de Faria, A. F. et al. Purification and structural characterization of fengycin homologues produced by Bacillus subtilis LSFM-05 grown on raw glycerol. J. Ind. Microbiol. Biotechnol. 38(7), 863–871. https://doi.org/10.1007/s10295-010-0882-1 (2011).
-
Moldes, A. B. et al. Partial characterization of biosurfactant from Lactobacillus pentosus and comparison with sodium dodecyl sulfate for the bioremediation of hydrocarbon-contaminated soil. BioMed Res. Int. 2013 (2013).
-
Ibrahim, H. M. Characterization of biosurfactants produced by novel strains of Ochrobactrumanthropi HM-1 and Citrobacter freundii HM-2 from used engine oil-contaminated soil. Egypt. J. Pet. 27(1), 21–29. https://doi.org/10.1016/j.ejpe.2017.03.006 (2018).
-
Chakraborty, J. & Das, S. Application of spectroscopic techniques for monitoring microbial diversity and bioremediation. Appl. Spectrosc. Rev. 52(1), 1–38. https://doi.org/10.1080/05704928.2016.1165460 (2017).
-
Ardenkjaer-Larsen, J. H. et al. Facing and overcoming sensitivity challenges in biomolecular NMR spectroscopy. Angew. Chem. Int. Ed. 54(32), 9162–9185 (2015).
-
Li, J., Deng, M., Wang, Y. & Chen, W. Production and characteristics of biosurfactant produced by Bacillus pseudomycoides BS6 utilizing soybean oil waste. Int. Biodeterior. Biodegrad. 112, 72–79. https://doi.org/10.1016/j.ibiod.2016.05.005 (2016).
-
Kind, T. & Fiehn, O. Advances in structure elucidation of small molecules using mass spectrometry. Bioanalytical Reviews. 2, 23–60 (2010).
-
Mulligan, C. N., Sharma, S. K. & Mudhoo, A. Biosurfactants. Research Trends and Applications Vol. 34 (CRC, 2014).
-
Vaux, D. J. & Cottingham, M. Method and apparatus for measuring surface configuration, U.S. Patent US 7,224,470, (2007).
-
Chetan, D. M. et al. Biosurfactants: an alternative to the synthetic surfactants and their production by bacteria isolated from solid waste. J. Pure Appl. Microbiol. 12(3), 1561–1567 (2018).
-
Jain DK, Collins-Thompson DL, Lee H, Trevors JT. A drop-collapsing test for screening surfactant-producing microorganisms. Journal of Microbiological Methods. 1991 Aug 1;13(4):271-9.
-
Mishra, N. et al. Novel application of nerium leaf and image J software in drop collapse assay for rapid screening of biosurfactant producing microorganisms. Indian J. Experimental Biology (IJEB). 59(07), 484–492 (2021).
-
Priya, T. & Usharani, G. Comparative study for biosurfactant production by using Bacillus subtilis and Pseudomonas aeruginosa. Bot. Res. Int. 2(4), 284–287 (2009).
-
Kathiravan, N., Rajesh, A., Kim, J. W. & Davoodbasha, M. Isolation and characterization of biosurfactant-producing soil fungus Penicillium sp. Appl. Biochem. Biotechnol. (Aug. 29, 1–2. https://doi.org/10.1007/s12010-023-03891-8 (2023).
-
García-Reyes, S. et al. Partial characterization of a biosurfactant extracted from Pseudomonas sp. B0406 that enhances the solubility of pesticides. Environ. Technol. 39(20), 2622–2631. https://doi.org/10.1080/09593330.2017.1348881 (2018).
-
Koenig, S. et al. Physicochemical investigations in systems of composition biosurfactant/sodium dodecyl sulfate/water around the critical micelle concentration. Colloids Surf., B. 1(1), 33–41 (1993).
-
Sahoo, S., Subban, K. & Chelliah, J. Diversity of marine macro-algicolous endophytic fungi and cytotoxic potential of biscogniauxiapetrensis metabolites against cancer cell lines. Front. Microbiol. 650177. https://doi.org/10.3389/fmicb.2021.650177 (2021).
-
Manikkasundaram, V. et al. Production and characterization of glycolipid biosurfactant from streptomyces enissocaesilis HRB1 and its evaluation for biomedical and bioremediation applications. J. Surfact Deterg. 491–503. https://doi.org/10.1002/jsde.12750 (2023).
-
Chakravarthi, K. K. & Avadhani, R. Beneficial effect of aqueous root extract of Glycyrrhiza glabra on learning and memory using different behavioral models: an experimental study. J. Nat. Sci. Biol. Med. 4(2), 420. https://doi.org/10.4103/0976-9668.116973 (2013).
-
Sowmya, P. R., Arathi, B. P., Vijay, K., Baskaran, V. & Lakshminarayana, R. Role of different vehicles in carotenoids delivery and their influence on cell viability, cell cycle progression, and induction of apoptosis in HeLa cells. Mol. Cell. Biochem. 406, 245–253. https://doi.org/10.1007/s11010-015-2422-6 (2015).
-
Champati, B. B. et al. Application of a multilayer perceptron artificial neural network for the prediction and optimization of the Andrographolide content in Andrographis paniculata. Molecules 27(9), 2765 (2022).
-
Padhiari, B. M. et al. Artificial neural network (ANN) model for prediction and optimization of bacoside A content in Bacopa monnieri: A statistical approach and experimental validation. Plant. Biosystems-An Int. J. Dealing all Aspects Plant. Biology. 156(6), 1346–1357 (2022).
-
Ahmad, Z., Crowley, D., Marina, N. & Jha, S. K. Estimation of biosurfactant yield produced by Klebseilla sp. FKOD36 bacteria using artificial neural network approach. Measurement 81, 163–173 (2016).
-
Gomba, G. K., Synytsya, A., Švecová, P., Coimbra, M. A. & Čopíková, J. Distinction of fungal polysaccharides by N/C ratio and mid infrared spectroscopy. Int. J. Biol. Macromol. 80, 271–281 (2015).
-
Moussa, T. A., Mohamed, M. S. & Samak, N. Production and characterization of di-rhamnolipid produced by Pseudomonas aeruginosa TMN. Braz. J. Chem. Eng. 31, 867–880 (2014).
-
Cheng, F. et al. Characterization of a blend-biosurfactant of glycolipid and lipopeptide produced by Bacillus subtilis TU2 isolated from underground oil-extraction wastewater. J. Microbiol. Biotechnol. 23(3), 390–396 (2013).
-
Sharma, D., Saharan, B. S., Chauhan, N., Procha, S. & Lal, S. Isolation and functional characterization of novel biosurfactant produced by Enterococcus faecium. SpringerPlus 4, 1–4 (2015).
-
Singh, P. & Tiwary, B. N. Isolation and characterization of glycolipid biosurfactant produced by a Pseudomonas otitidis strain isolated from Chirimiri coal mines, India. Bioresources Bioprocess. 3, 1–6 (2016).
-
Zhang, Y. I. & Miller, R. Enhanced octadecane dispersion and biodegradation by a Pseudomonas rhamnolipid surfactant (biosurfactant). Appl. Environ. Microbiol. 58(10), 3276–3282 (1992).
-
Gudiña, E. J. et al. Bioconversion of agro-industrial by-products in rhamnolipids toward applications in enhanced oil recovery and bioremediation. Bioresour. Technol. 177, 87–93 (2015).
-
Van Bogaert, I. N. A. et al. Microbial production and application of sophorolipids. Appl. Microbiol. Biotechnol. 76, 23–34 (2007).
-
Desai, J. D. & Banat, I. M. Microbial production of surfactants and their commercial potential. Microbiol. Mol. Biol. Rev. 61(1), 47–64 (1997).
-
El-Sheshtawy, H. S. & Doheim, M. M. Selection of Pseudomonas aeruginosa for biosurfactant production and studies of its antimicrobial activity. Egypt. J. Petroleum. 23(1), 1–6 (2014).
-
Umair, M. et al. Chirality of the biomolecules enhanced its stereospecific action of dihydromyricetin enantiomers. Food Sci. Nutr. 8(9), 4843–4856. https://doi.org/10.1002/fsn3.1758 (2020).
-
Sazonova, E. V., Chesnokov, M. S., Zhivotovsky, B. & Kopeina, G. S. Drug toxicity assessment: cell proliferation versus cell death. Cell. Death Discovery. 8(1), 417. https://doi.org/10.1038/s41420-022-00962-4 (2022).
-
Tolosa, L., Donato, M. T. & Gómez-Lechón, M. J. General cytotoxicity assessment by means of the MTT assay. In Protocols Vitro Hepatocyte Res. 333–348 (2015).
-
Van Tonder, A., Joubert, A. M. & Cromarty, A. D. Limitations of the 3-(4, 5-dimethylthiazol-2-yl)-2, 5-diphenyl-2H-tetrazolium bromide (MTT) assay when compared to three commonly used cell enumeration assays. BMC Res. Notes. 8, 1–10. https://doi.org/10.1186/s13104-015-1025-0 (2015).
-
Garn, H., Krause, H., Enzmann, V. & Dröβler, K. An improved MTT assay using the electron-coupling agent menadione. J. Immunol. Methods. 168(2), 253–256. https://doi.org/10.1016/0022-1759(94)90197-X (1994).
-
Lim, S. W., Loh, H. S., Ting, K. N., Bradshaw, T. D. & Allaudin, Z. N. Reduction of MTT to purple formazan by vitamin E isomers in the absence of cells. Trop. Life Sci. Res. 26(1), 111. https://doi.org/10.21315/tlsr2015.26.1.9 (2015).
-
Akiyode, O., George, D., Getti, G. & Boateng, J. Systematic comparison of the functional physico-chemical characteristics and biocidal activity of microbial derived biosurfactants on blood-derived and breast cancer cells. J. Colloid Interface Sci. 479, 221–233 (2016).
Funding
Open access funding provided by Siksha ‘O’ Anusandhan (Deemed To Be University)
Ethics declarations
Competing interests
The authors declare no competing interests.
Additional information
Publisher’s note
Springer Nature remains neutral with regard to jurisdictional claims in published maps and institutional affiliations.
Supplementary Information
Rights and permissions
Open Access This article is licensed under a Creative Commons Attribution-NonCommercial-NoDerivatives 4.0 International License, which permits any non-commercial use, sharing, distribution and reproduction in any medium or format, as long as you give appropriate credit to the original author(s) and the source, provide a link to the Creative Commons licence, and indicate if you modified the licensed material. You do not have permission under this licence to share adapted material derived from this article or parts of it. The images or other third party material in this article are included in the article’s Creative Commons licence, unless indicated otherwise in a credit line to the material. If material is not included in the article’s Creative Commons licence and your intended use is not permitted by statutory regulation or exceeds the permitted use, you will need to obtain permission directly from the copyright holder. To view a copy of this licence, visit http://creativecommons.org/licenses/by-nc-nd/4.0/.
About this article

Cite this article
Das, R.P., Sahoo, S., Paidesetty, S.K. et al. Isolation, structural characterization, and anticancer potential of a novel glycolipid biosurfactant S1B with AI-driven medium optimization. Sci Rep 15, 36808 (2025). https://doi.org/10.1038/s41598-025-20759-3
-
Received:
-
Accepted:
-
Published:
-
DOI: https://doi.org/10.1038/s41598-025-20759-3