Main
Despite representing only 2% of all tumours, central nervous system (CNS) cancers account for the highest average years of life lost in oncology1. The early, accurate, non-invasive detection of brain tumours and other neurologic conditions remains a major challenge because circulating biomarkers are either lacking or have low sensitivity. Currently, the standard of care for tumour diagnosis is intracranial biopsy2,3, a highly invasive procedure. Imaging modalities lack specificity in differentiating certain tumour types, can be challenging to interpret4,5,6 and often require substantial instrument time, cost and contrast agents or radioimaging probes. Liquid biopsies typically measure mutations in circulating tumour DNA or DNA methylation markers7,8 in accessible bodily fluids such as blood9, urine10, saliva11 or cerebrospinal fluid12. At present, there are limited liquid biopsy tests for intracranial tumour detection9, and development of intracranial tumour liquid biopsies based on tumour-derived DNA has been challenging due to the relatively low amount of circulating tumour DNA that enters the bloodstream, compared to other solid tumours13.
In this study, we developed a machine perception liquid biopsy (MPLB) approach to distinguish brain tumours in patients using peripheral blood samples and to identify the biomarkers responsible for detection. An array of quantum well nanosensors (QWNs), consisting of quantum well defect-modified single-walled carbon nanotubes (QWNTs)14,15, was assembled to acquire diverse optical responses to molecular binding events in blood plasma. Machine-learning algorithms were trained and tested on sensor responses to 739 unique patient plasma samples and detected tumour presence with 98% accuracy and identified tumour type with up to 71% accuracy. Quantitative proteomic analysis of the protein corona, eluted from the most predictive QWN, revealed that tumour-associated proteins were highly enriched on the QWN surface, and furthermore, tumour microenvironment (TME) and inflammatory response proteins were also identified. Spectral analysis of QWN responses was consistent with the hypothesis that the disease fingerprint detected by the MPLB was derived from these biomarkers. Independent patient samples recapitulated enrichment trends, validating the proteins as potential biomarkers of intracranial tumours. Our results show that the MPLB can detect and classify CNS tumours, including those that currently lack biomarkers, and enable the discovery of signal-driving biomarkers of early-stage tumours via enrichment of tumour ecosystem-secreted factors. This work appears to represent the first disease-agnostic perception-based liquid biopsy approach that concomitantly enables cancer detection, stratification and biomarker discovery.
Results
Acquisition of nanosensor responses to intracranial tumour patient plasma
To build our sample dataset for model development, we collected 690 peripheral blood plasma samples from patients diagnosed at the Department of Pathology, NYU Langone Health. These included four intracranial tumour cohorts representing glioma (n = 205), meningioma (n = 135), pituitary adenoma (n = 88) and schwannoma (n = 82), and 180 non-tumour samples (Fig. 1a and Supplementary Table 1).
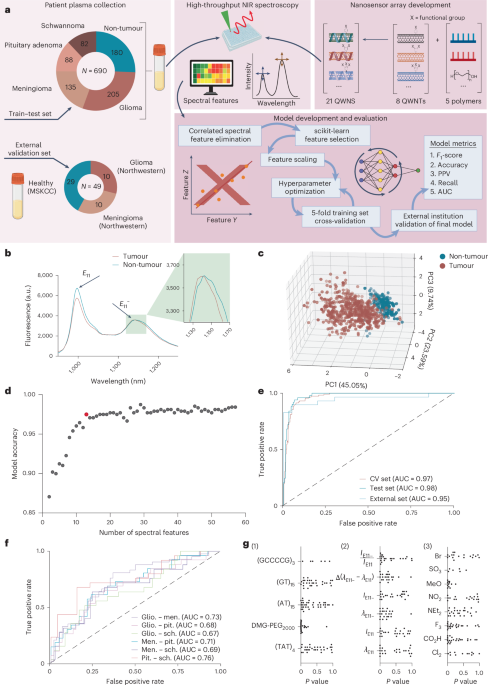
a, Left: schematic of diagnostic platform workflow, including summary of sample classes and sample sizes used in the study for initial model training, testing and external institution validation. Right: covalently modified SWCNTs, comprised of eight functional groups (4-sulfonatebenzene-, 4-methoxybenzene-, 4-nitrobenzene-, N,N-diethylaminobenzene-, 3,4,5-trifluorobenzene-, 4-carboxybenzene-, 3,5-dichlorobenzene-, 4-bromobenzene-) were wrapped with five polymers ((GT)15, (TAT)4, (GCCCCG)3, (AT)15, DMG-PEG2000) to generate an array of 21 physicochemically distinct QWNs. Centre: these QWNs were then combined with patient plasma samples to probe biomolecular binding interactions using high-throughput NIR spectroscopy. Bottom: spectral features were extracted and used to train classification models to predict presence and class of disease. b, Representative fluorescence emission spectra of F3-DMG-PEG2000 QWN from tumour and non-tumour samples. Spectra are the average of three technical replicates. c, PCA of QWN spectral features. Each point corresponds to an individual patient sample, coloured by sample class. d, Model performance as a function of increased number of sensor features. The highlighted model, comprising 12 spectral features, was selected for subsequent studies. e, ROC curve of cross-validation and test set for tumour identification. External institution validation samples were tested on the trained model. Dashed unity line denotes the line of no discrimination, representing the theoretical performance of an informationless classifier. f, ROC curve of test set performances for binary classification of different tumour classes. Dashed unity line denotes the line of no discrimination. g, Analysis of feature importance between tumour and non-tumour cohorts of QWN features for (1) polymer excipient (2) spectral feature and (3) quantum well covalent modification. MSKCC, Memorial Sloan Kettering Cancer Center; PPV, positive predictive value; CV, cross-validation; glio., glioma; men., meningioma; pit., pituitary adenoma; sch, schwannoma; G, guanine; C, cytosine; A, adenine; T, thymine; ({lambda }_{E11}), E11 wavelength; ({lambda }_{E11-}), E11− wavelength; ({I}_{E11}), E11 peak intensity; ({I}_{E11-}), E11− peak intensity; SO3, 4-sulfonatebenzene-; MeO, 4-methoxybenzene-; NO2, 4-nitrobenzene-; NEt2, N,N-diethylaminobenzene-; F3, 3,4,5-trifluorobenzene-; CO2H, 4-carboxybenzene-; Cl2, 3,5-dichlorobenzene-; Br, 4-bromobenzene-. Panel a created with BioRender.com.
To build a sensor array with diverse protein coronas and optical responses to proteins, we constructed 21 QWNs comprising quantum well defect-modified, polymer-wrapped carbon nanotubes (Fig. 1a, Supplementary Fig. 1 and Supplementary Table 2)14,15. We introduced covalent quantum defects onto the nanotube surface using a panel of aryl diazonium salts bearing substituents spanning a large range of Hammett σ values (–0.72 to 0.78). The substituents, 4-sulfonatebenzene-, 4-methoxybenzene-, 4-nitrobenzene-, N,N-diethylaminobenzene-, 3,4,5-trifluorobenzene-, 4-carboxybenzene-, 3,5-dichlorobenzene- and 4-bromobenzene-, were chosen to maximize diversity of chemical responsivities of the quantum well defect emission sites in the array. Each QWN generated a unique spectral profile, emitting narrow fluorescence bands at 1,000 nm (intrinsic bandgap fluorescence, E11) and at ∼1,140 nm (quantum-well defect-induced emission, E11−)16 (Supplementary Fig. 1).
To further diversify the sensitivity of QWNs in the nanosensor array, we selected four single-stranded DNA sequences ((GT)15, (TAT)4, (GCCCCG)3, (AT)15) and one amphiphilic polymer (1,2-dimyristoyl-rac-glycero-3-methoxypolyethylene glycol-2000 (DMG-PEG2000)) (Fig. 1a) that varied in sequence composition, structure and surface coverage. The sequences (GT)15 and (TAT)4, are known to form ordered surface patterns on carbon nanotubes based on previous experimental and computational studies17,18, while (GCCCCG)3 has been predicted to adopt similarly ordered conformations19, and (AT)15 is characterized by high surface coverage20 and a disordered surface patterning. DMG-PEG2000, introduced a non-DNA-based corona with distinct physicochemical properties (for example, charge). This set was chosen to facilitate a range of interactions with adsorbed biomolecules and to maximize sensor array diversity (the full list of defect/polymer combinations is given in Supplementary Table 2).
We acquired near-infrared (NIR) fluorescence spectra by introducing each patient sample to wells holding each of the 21 QWNs and exciting samples with 577-nm light (representative spectra from two samples are shown in Fig. 1b). We derived six spectral features from the fluorescent emission peaks of each QWN and observed that the QWN spectral features demonstrated diverse responses to the patient samples (Supplementary Fig. 2). Principal component analysis (PCA) of the QWN spectral responses identified two clear clusters corresponding to the tumour/non-tumour sample cohorts, with some overlap between clusters (Fig. 1c).
Classifier differentiates between intracranial tumour and non-tumour blood samples
To determine if the spectral fingerprint of QWN responses could unambiguously differentiate intracranial tumour patients from non-tumour plasma, we developed machine-learning models to discriminate between cohorts. We first used analysis of variance (ANOVA)-based feature selection to determine the most significant spectral features from the QWN responses21. We then used the CatBoost algorithm22 to assess the performance of different feature combinations, ranging from 2 to 58 features (Supplementary Fig. 3a). To optimize the training model, we tuned hyperparameters via Bayesian hyperparameter optimization to maximize the F1-score of 5-fold cross-validation training data averaged across folds (Supplementary Table 3). The average cross-validation accuracy varied between 0.87 and 0.98 (Fig. 1d). The best-performing model exhibited a test F1-score of 0.98, an accuracy of 98%, an 88% sensitivity at 95% specificity, and an area under the curve (AUC) of the receiver operating characteristic (ROC) curve of 0.98 (Fig. 1e). Strikingly, as evidenced by the high overall prediction accuracy, our models were able to detect tumours at a range of WHO grades, and over 20% of our glioma cohort was comprised of WHO grade 1–2 tumours (Supplementary Fig. 4a). The statistical assessment of age, sex and class imbalance on model performance confirmed negligible bias (Supplementary Fig. 4b–d and Supplementary Table 4).
To determine the generalizability of this method, we assembled a validation cohort of samples from two external institutions. For this analysis, we synthesized a new set of QWNs. Using the new batch of nanosensors, we collected spectral responses from 20 primary tumour plasma samples and 29 non-tumour plasma samples from Northwestern University and the Memorial Sloan Kettering Cancer Center (Fig. 1a and Supplementary Table 5). The QWN responses clustered consistently with our initial cohort of 690 patient samples, confirming robust sensor responses (Supplementary Fig. 5). The performance of this external validation dataset of the previously trained model was comparable to the internal test set with an F1-score of 0.897, an accuracy of 89.8%, a specificity of 93.1% at a sensitivity of 98%, and an AUC of 0.95 (Fig. 1e), suggesting reproducible sensor synthesis and robustness of spectral responses to patient samples
We investigated the potential of the QWN array to discriminate between intracranial tumour types. The QWN optical responses to plasma from patients harbouring the four intracranial tumour types (glioma, meningioma, pituitary adenoma and schwannoma) did not separate into individual clusters via PCA (Supplementary Fig. 6a). We trained CatBoost classification algorithms to differentiate between each pair of tumours (Fig. 1f and Supplementary Fig. 6b–g). The classifier trained to differentiate between glioma and meningioma scored the best among the differentiation tasks, with a weighted F1-score of 0.71, an accuracy of 71%, a precision of 0.74 and an AUC of 0.73 (Supplementary Fig. 6b). The other models performed with accuracies ranging between 65% and 71% (Supplementary Fig. 6b–g; detailed model statistics are given in Supplementary Table 6). The detection models were not able to robustly identify all clinically relevant differences, however. For example, detection of the isocitrate dehydrogenase 1 (IDH-1) mutation status of glioblastoma patients gave a test set AUC of 0.51, performing no better than chance (Supplementary Fig. 7).
3,4,5-F3-DMG-PEG2000 QWN drives machine prediction performance
We aimed to identify which QWN features were responsible for the disease-specific sensor responses. The DMG-PEG2000-wrapped QWNs were statistically overrepresented in the significant feature set (Fig. 1g(1), ({chi }^{2}=27.34;,P < 1.7times {10}^{-7})), suggesting that the DMG-PEG2000 wrapping may facilitate the binding of disease-relevant analytes to the QWN surface. The single most important sensor for the classification task was the 3,4,5-trifluoro aryl functionalized nanotube with a DMG-PEG2000 wrapping, termed the 3,4,5-trifluoro-DMG-PEG2000 nanosensor, which alone detected tumours with 93% accuracy and differentiated between glioma and meningioma with 64% accuracy (Supplementary Fig. 3). The response was further improved by the addition of other sensors. The E11− wavelength spectral feature was generally the most important for model development as assessed by the scikit-learn feature selection toolkit (Fig. 1g(2)), consistent with previous work suggesting that the quantum well defects can elicit enhanced environmental sensitivity23. Correlation analysis between spectral responses to patient plasma samples (Supplementary Figs. 8 and 9) indicated that many spectral features transduced a substantial degree of mutual information, highlighting the need for feature selection.
MPLB platform reveals potential biomarkers driving disease-specific QWN responses
To investigate the molecular species driving the MPLB disease response, we conducted quantitative proteomic analysis on non-tumour plasma samples and on samples from glioblastoma and meningioma patients (Fig. 2a) to identify the protein corona of the single most predictive QWN, 3,4,5-trifluoro-DMG-PEG2000. After washing away weakly bound proteins from the QWN corona, we eluted the remaining proteins (Fig. 2a and Supplementary Fig. 10a,b)24 and conducted quantitative mass spectrometry analyses on three independent protein corona extractions for each cohort, labelled using 18-plexed TMTpro tandem mass tags to enable sample multiplexing25 (Fig. 2a and Supplementary Fig. 10a,b). PCA revealed that non-tumour and tumour sample clusters separated, while glioblastoma and meningioma clusters overlapped (Supplementary Fig. 10d), mirroring the QWN optical responses (Fig. 1c and Supplementary Fig. 6a). The protein compositions of the glioblastoma and meningioma samples were substantially correlated, with a Pearson coefficient of 0.86. This, in contrast to 0.75 for glioblastoma and non-tumour samples and 0.78 for meningioma and non-tumour samples (Supplementary Fig. 10e), suggests greater similarity between the protein corona compositions of the tumour samples, and more differences between non-tumour and tumour samples, further recapitulating the trends in QWN model performance.
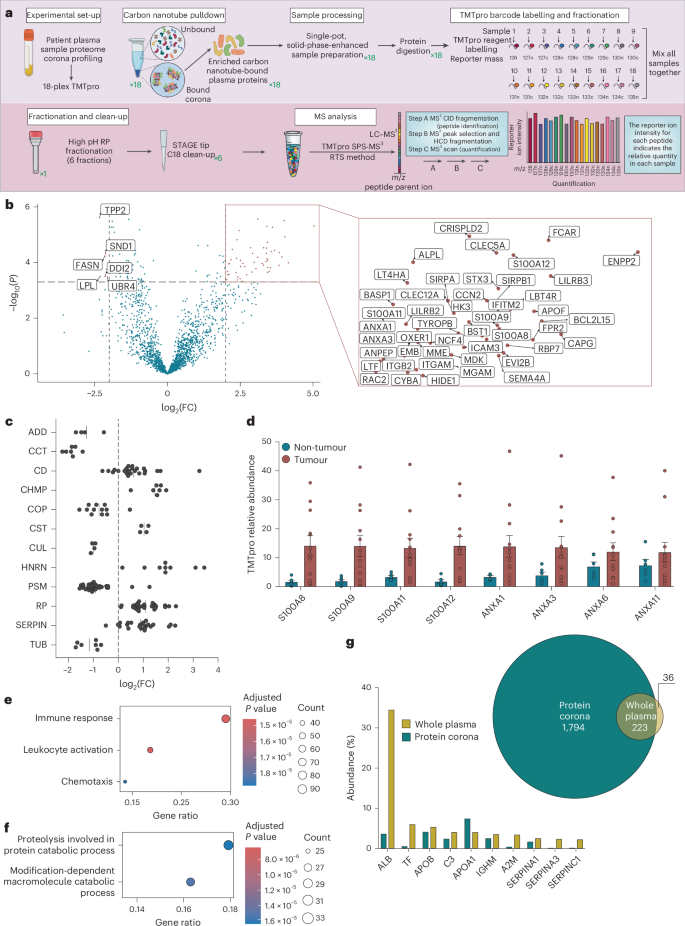
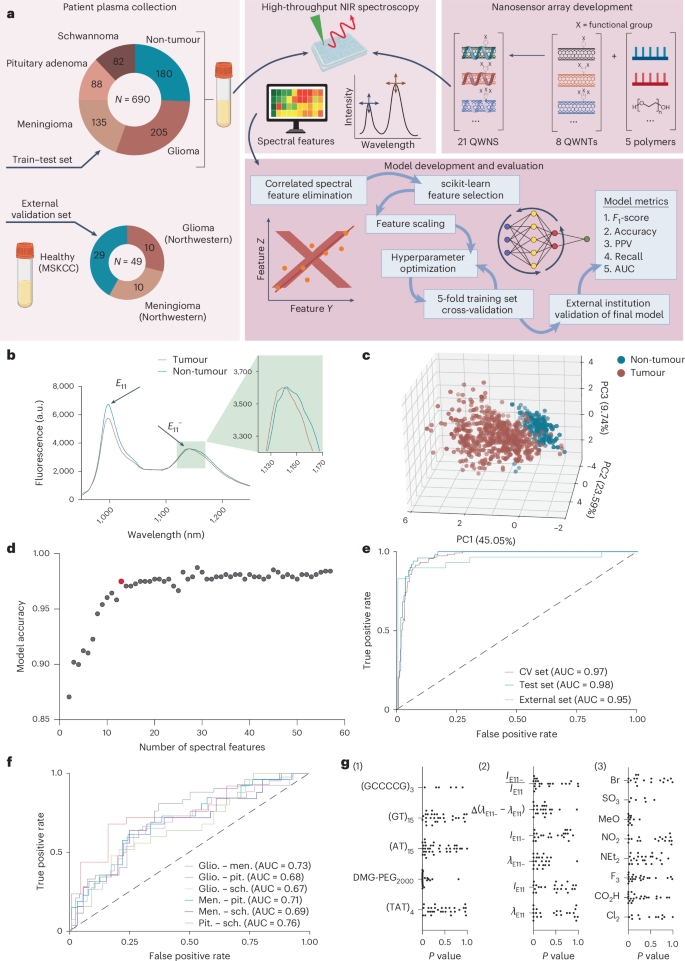
a, Schematic of QWN corona proteomics workflow. b, Volcano plot of log2(FC) versus −log10(P) between tumour (n = 12) and non-tumour (n = 6) patient plasma protein corona extracts; protein IDs labelled with |FC| > 4 and P< 5 × 10⁻⁴ are highlighted. Samples were analysed using two-sided Welch’s t-test, adjusted for multiple comparisons at a 1% FDR. c, log2(FC) of tumour (n = 12) compared to non-tumour (n = 6) samples of selected protein classes, indicating elevated and depleted expression across many classes of proteins. d, TMTpro relative abundance of specific proteins associated with tumour samples (n = 12) compared to non-tumour (n = 6). Data are reported as mean ± s.e.m. e, Gene Ontology enrichment analysis of proteins with |log2(FC)| > 1. Circle size indicates number of significantly enriched proteins with functional annotation and circle colour indicates statistical significance. Statistical test was conducted via one-sided Fisher’s exact test, with Benjamini–Hochberg correction at 5% FDR. f, Gene Ontology depletion analysis of proteins with |log2(FC)| > 1. Circle size indicates number of significantly depleted proteins with functional annotation and circle colour indicates statistical significance. Statistical test was conducted via one-sided Fisher’s exact test, with Benjamini–Hochberg correction at 5% FDR. g, Upper right: Venn diagram of proteins detected via LC–MS/MS in matched protein corona extraction (n = 18) and whole-plasma input (n = 18). Lower left: average percentage abundance of the 10 most prevalent plasma proteins from mass spectrometry analysis in whole plasma (n = 18) and their abundance in protein corona extractions (n = 18). TMT, tandem mass tag; RP, reverse phase; STAGE, stop and go extraction; RTS, real-time search; CID, collision-induced dissociation; HCD, higher-energy collisional dissociation; ADD, adaptor protein; CCT, chaperonin-containing TCP-1; CD, cluster of differentiation; CHMP, charged multivesicular body protein; COP, coatomer protein; CST, cystatin; CUL, cullin; HNRN, heterogeneous nuclear ribonucleoprotein; PSM, proteasome subunit; RP, ribosomal subunit; SERPIN, serine protease inhibitor; TUB, tubulin; Alb, albumin; TF, transferrin; APOB, apolipoprotein B; C3, complement C3; APOA1, apolipoprotein A1; IGHM, immunoglobulin heavy constant μ; A2M, α-2-macroglobulin; SERPINA3, serine protease inhibitor A3; SERPINC1, serine protease inhibitor C1. Panel a created with BioRender.com.
After elution, we observed 2,017 QWN-enriched proteins, 1,155 of which were enriched in tumour patient sample proteins, as compared to 862 proteins enriched in non-tumour individuals (Fig. 2b). A full list of significantly enriched and depleted proteins is provided in Extended Data Table 1 The five most significantly enriched proteins in the corona of tumour patients were ENPP2, LILRB3, FCAR, BCL2L15 and CAPG (Extended Data Table 1). These proteins indicate a protein corona composition derived from tumour samples influenced by proteins involved in inflammation26, immune modulation27,28 and lipid signalling29, released from the TME, and by systemic inflammatory responses. The five most significantly depleted proteins in the corona of tumour patients were TPP2, FASN, LPL, DDI2 and PDE5A, (Extended Data Table 1). These proteins are involved in various roles including proteostasis30, lipid metabolism31 and RNA regulatory mechanisms32.
Gene Ontology analysis33 revealed differentially enriched proteins in the tumour samples (|log2(FC)| > 1; FC, fold change). The proteasome 19S and 20S subunits (PSMs) were significantly depleted on the surface of the carbon nanotube in cancer patients (Fig. 2c). In contrast, the ribosomal subunits (RPs) were consistently more abundant in tumour samples (Fig. 2c), consistent with previous studies showing enrichment of RPs in glioblastomas34.
We found that multiple S100A proteins were notably upregulated in tumour samples, especially S100A8, S100A9, S100A11 and S100A12 (Fig. 2d). These S100A proteins have been recognized as potential biomarkers in various neurological tumours35,36,37. Additionally, our analysis indicated that ANXA1, 3, 6 and 11 were significantly enriched in the tumour samples (Fig. 2d), aligning with previous research38. Furthermore, TME and inflammatory response proteins were identified, including FCAR, LILRB2/B3, SIRPA/B3 and CLEC5A/12A. The vast majority of the enriched proteins (shown in Fig. 2b,c) have not previously been reported as tumour biomarkers. Figure 3e,f reports highlighted GO biological processes of differentially enriched proteins (| log2(FC)| > 1), indicating that enriched proteins are associated with immune responses, leukocyte activation and chemotaxis (Fig. 2e), while the depleted proteins are linked to proteolysis and catabolysis (Fig. 2f). The data suggest that a combination of tumour-specific, tumour microenvironment, and systemic inflammatory and immunological proteins from tumour samples were enriched on the QWNs (Extended Data Table 1).
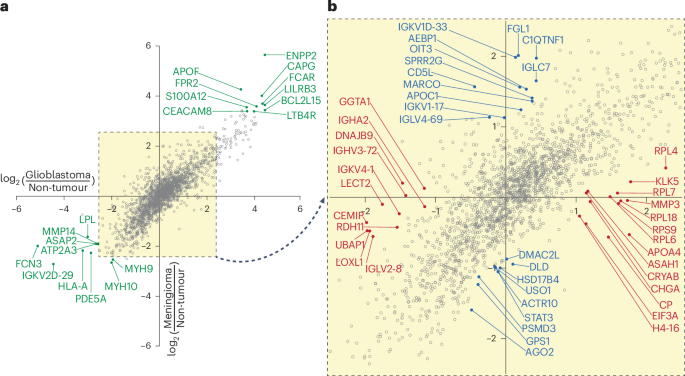
a, Plot of glioblastoma/non-tumour log2(FC) versus meningioma/non-tumour log2(FC), highlighting correlation between tumour enrichment and depletion profiles. Highlighted proteins in light green are the top 10 tumour non-specifically enriched (upper-right quadrant) or depleted (lower-left quadrant), representing potential molecular markers of cancer, agnostic to cancer type. Dashed yellow box with arrow indicates highlighted region of plot that is expanded in b. b, Magnified view at x intercept and y intercept reveals potential cancer type-specific differentially enriched protein species. Red, enriched (x > 0, y = 0) or depleted (x < 0, y = 0) in glioblastoma samples compared with non-tumour samples; blue, enriched (x = 0, y > 0) or depleted (x = 0, y < 0) in meningioma samples compared with non-tumour samples.
Protein corona analysis facilitates the detection of low-abundance biomarkers
To evaluate the extent to which our QWN protein-enrichment approach supports the detection of low-abundance proteins, we analysed the differences in the proteomic data provided by QWN-eluted plasma compared to whole-plasma samples. We conducted an 18-plex TMTpro experiment using matched patient plasma samples (non-tumour, glioblastoma and meningioma) and compared it to the protein corona extracts detected from the QWN. In contrast with the 2,017 proteins identified from the QWN, we could reliably quantify only 259 proteins in the undepleted plasma extracts (Fig. 2g, inset). Statistical analysis revealed that several of the proteins enriched in tumours, including S100A8, S100A9 and ANXA1, were detectable using bulk plasma input (Supplementary Fig. 11), but the vast majority of tumour-enriched proteins identified from QWN elution were not quantified in the bulk plasma input. In matched samples, albumin was over 10-fold depleted, and transferrin was 17-fold depleted in the protein corona compared with whole plasma (Fig. 2g). Of the top 10 most abundant proteins in the undepleted plasma samples, only APOA1 showed a relative enrichment (1.4-fold) in the protein corona compared with the whole plasma. This finding is consistent with the greater repertoire of protein types detected in protein corona (n = 2,017) when compared with undepleted plasma (n = 259).
Identification of cancer type-specific protein enrichment
Next, we focused on identifying QWN-eluted proteins that exhibited specific differential expression between either glioblastoma and non-tumour samples or between meningioma and non-tumour samples. There was substantial collinearity between the protein enrichment profiles between non-tumour/glioblastoma and non-tumour/meningioma samples (Supplementary Fig. 10e), suggesting that a large component of the variation was influenced by protein-binding interactions not specific to tumour class (Fig. 3a). By evaluating along the x and y intercepts, we identified cancer type-specific differences in the composition of the QWN protein corona (Fig. 3b).
Along the x intercept, we identified multiple glioblastoma-specific protein biomarkers in the composition of the QWN protein corona, in comparison to non-tumour samples (Fig. 3b and Extended Data Table 2). Known biomarkers, including matrix metalloproteinase 3 (MMP3)39, apolipoprotein A4 (APOA4)40 and several RPs (RPL4, RPL7, RPL18, RPS9, RPL6)34, were enriched 2- to 3.5-fold on the protein corona of the glioblastoma samples, whereas they were not differentially enriched in the meningioma protein corona samples. Other differentially enriched proteins were not previously recognized as implicated in glioblastoma, but are variously involved in extracellular matrix (ECM) remodelling, supporting growth, enhancing stress resistance and response, or are related to immune function pathways (Extended Data Table 2).
Our analysis along the y intercept revealed meningioma-enriched proteins compared to non-tumour samples, all unreported as meningioma biomarkers (Fig. 3b and Extended Data Table 3). Enrichment of immunological proteins (HLA-B, MARCO, CD5L)41,42,43 and ECM components (AEBP1)44 are consistent with the immune and structural composition of meningiomas. Additionally, the enrichment of lipid metabolism proteins (APOC1, C1QTNF1) supports the existing literature on changes in meningioma lipid metabolism45. Interestingly, many of the proteins identified throughout our proteomic analyses were not normally secreted proteins (Extended Data Table 3), which suggests that the observed proteins result from cellular fragments released from the tumour into the bloodstream.
Identification of differentially enriched proteins between glioblastoma and meningioma patients driving the prediction model
We assessed the protein-binding profiles potentially undergirding the model performance of our glioblastoma and meningioma classifier (AUC, 0.73; Fig. 1f). We integrated findings from three TMTpro protein corona extraction experiments to enhance the statistical signal and identify potential proteins contributing to model performance (Fig. 1f and Supplementary Fig. 6b). After combining the protein quantification results from the three experiments, we observed a total of 817 unique QWN-enriched unique proteins across all three experiments. Of these, 645 were enriched in glioblastoma patient samples, while 172 proteins were enriched in meningioma patient samples (Fig. 4a). We found that various protein classes were differentially bound to the sensors across groups, including many members of the septin family, heat-shock proteins and the protein kinase C-related family. These proteins serve diverse roles in ECM and structural remodelling, and in immunological functions (Fig. 4b). Our results showed that several serpins, including SERPINA1, SERPINA3 and AGT, were relatively enriched in the protein corona of glioblastoma patients (Fig. 4a,c). Notably, SERPINA3 has previously been identified as a diagnostic biomarker of glioblastoma40,46. Additionally, MMP339 and APOA440 have been reported as upregulated proteins in glioblastoma patients, which aligns with our findings (Fig. 4c)40,46. We found that ENPP2, CA6, OIT3 and IGHD were relatively enriched in the protein corona blood plasma of meningioma patients, playing roles in lipid processing and immune responses (Fig. 4a,c). Importantly, the degree of overlap with the literature further suggests that both known and unknown protein disease biomarkers influenced the sensor responses.
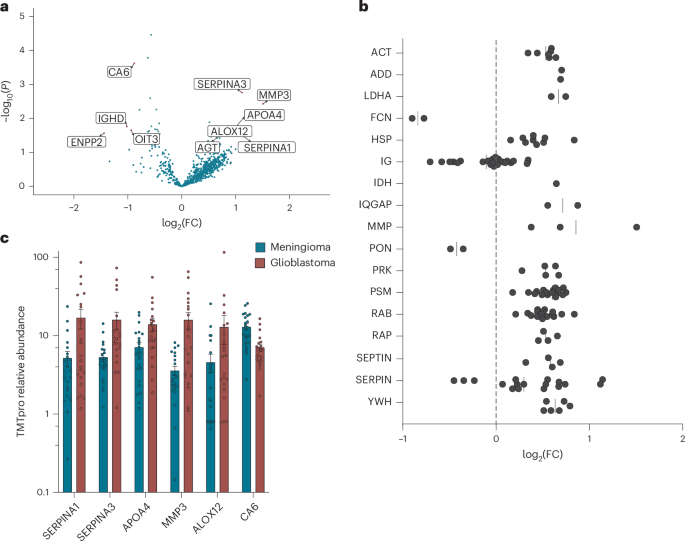
a, Volcano plot of log2(FC) versus −log10(P) between glioblastoma (n = 22) and meningioma (n = 23) samples. Samples were analysed using two-sided Welch’s t-test, adjusted for multiple comparisons at a 1% FDR. b, log2(FC) of glioblastoma (n = 22) compared with meningioma (n = 23) corona samples of selected protein classes, indicating elevated and depleted expression across many classes of proteins. c, Relative protein abundance between glioblastoma (n = 22) and meningioma (n = 23) samples of selected differentially enriched corona proteins. Data are reported as mean ± s.e.m. ACT, actin; ADD, adducin; LDHA, lactate dehydrogenase a; FCN, ficolin; HSP, heat-shock protein; IG, immunoglobulin; IDH, isocitrate dehydrogenase; IQGAP, iq motif-containing GTPase-activating protein; MMP, matrix metalloproteinase; PON, paraoxonase; PRK, protein kinase; PSM, proteasome subunit; SERPIN, serine protease inhibitor; YWH, 14-3-3 protein.
Differentially enriched QWN corona proteins generate quantitative sensor responses
We conducted protein titration experiments to assess the spectral responses of 3,4,5-trifluoro-DMG-PEG2000 to 36 of the identified disease- and corona-enriched proteins, and to a set of 22 proteins that were not enriched in the protein corona, at concentrations ranging from 246 to 0.015 μg ml−1 in 5-fold dilutions using interferent pooled healthy plasma (20%) or phosphate-buffered saline (PBS) (Supplementary Table 7). The QWNs exhibited sensitive and quantitative spectral responses to certain proteins (Fig. 5a(1)–(4), Supplementary Figs. 12 and 13). In the absence of plasma interferent (that is, in PBS), the magnitude of the sensor response at maximum protein concentration was increased ((bar{{lambda }_{{E}_{11}^{-}}}:4.41;{mathrm{{nm}}})) compared to the protein interferent condition ((bar{{lambda }_{{E}_{11}^{-}}}:2.27 ;{{mathrm{nm}}})). However, overall response trends between PBS and interferent conditions were broadly consistent, particularly between ratiometric spectral parameters (Fig. 5a(4) and Supplementary Fig. 13(6)). We fitted four-parameter log-logistic (4PL) models to the dose–response curves and found that many of the sensor responses to titrated biomarkers were well-described (R2 = 0.87–0.99). Figure 5b highlights strong quantitative QWN responses to some of the most highly enriched proteins (Figs. 2a and 3b), indicating that binding interactions between these enriched proteins and QWNs can elicit substantial spectral changes to QWN emission.
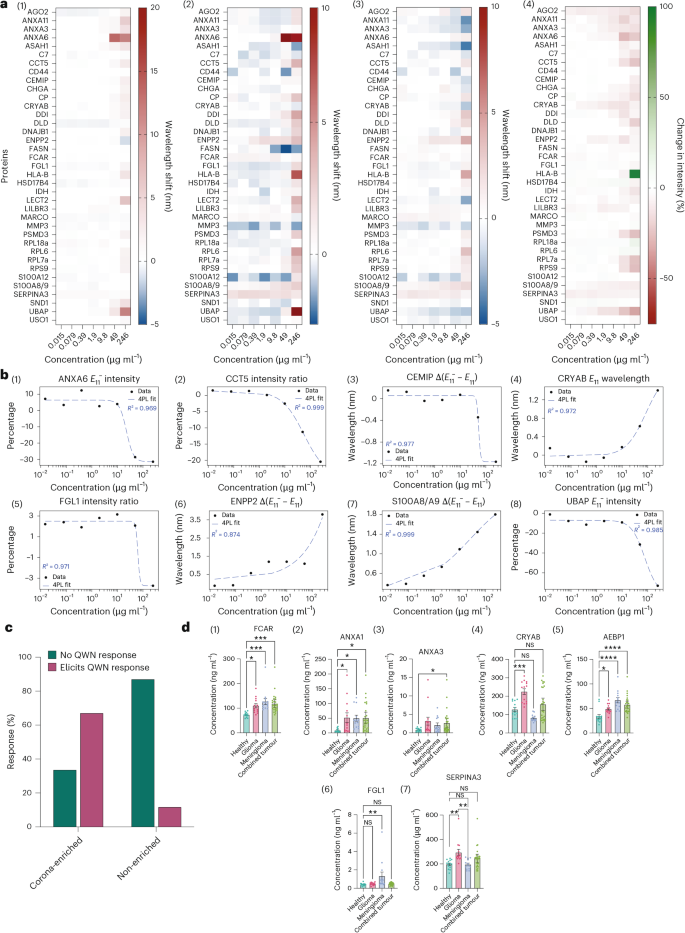
a, Heat maps of F3-DMG-PEG2000 spectral responses to 36 QWN-identified non-specific cancer and tumour-specific potential biomarkers: (1) change in E11 wavelength; (2) change in E11− wavelength; (3) change in E11− − E11 wavelength; (4) change in peak intensity ratio. b, Dose–response curves to select candidate biomarkers in the presence of plasma interferent with four-parameter log-logistic model fit overlaid (blue dashed line). Proteins were selected on the basis of quantitative logistic spectral responses (R2 > 0.7) and significance in QWN corona proteomics fold-enrichment: (1) ANXA6 E11− intensity; (2) CCT5 intensity ratio; (3) CEMIP ΔE; (4) CRYAB E11 wavelength; (5) FGL1 intensity ratio; (6) ENPP2 ΔE; (7) S100A8/A9 ΔE; (8) UBAP E11− intensity. c, Quantification of protein responses for 58 proteins, comprised of 36 QWN binders, identified via proteomics, and 22 non-binders, which were not detected or not enriched in protein corona analyses. Responders are proteins that elicited a response in one or more spectral features as determined by R2 of fit >0.7 and response at maximal concentration >1 nm or 20% change in intensity. d, ELISA protein quantification of 39 whole-plasma samples (n = 13 healthy donor, 13 glioblastoma, 13 meningioma). Data are reported as mean ± s.e.m. Samples were analysed using two-sided Welch’s t-test, adjusted for multiple comparisons at a 5% FDR. *P < 0.05; **P < 0.01; ***P < 0.001, ***P < 0.0001, ****P < 0.00001. (1) ANXA1; (2) ANXA3; (3) FCAR; (4) CRYAB; (5) AEBP1; (6) FGL1; (7) SERPINA3. int, intensity; 4PL, four-parameter log-logistic model; NS, non-significant.
We classified each protein as eliciting a QWN response or not based on two criteria: (1) the goodness of fit of dose–response curves (R2 > 0.7) and (2) the response at 246 μg ml−1 (>1-nm wavelength shift or >20% intensity change) in the presence of plasma interferent. The proportion of corona-enriched and non-enriched proteins elicited a response in one or more spectral features (Fig. 5c) and the enriched proteins (67%; n = 36) were significantly more likely (Fisher’s exact test; odds ratio, 0.143; P < 0.0041) to elicit a quantitative sensor response compared to the non-enriched proteins (14%; n = 22). This analysis indicates that proteins enriched in the protein corona elicit quantitative QWN responses, generate attenuated but not abrogated responses in the presence of plasma interferent, and are more likely to elicit sensor responses than proteins not enriched in the protein corona.
ELISAs validate protein corona enrichment trends
We investigated whether the enrichment of newly identified candidate biomarkers from the QWN protein corona aligned with the protein enrichment in whole plasma. We performed enzyme-linked immunosorbent assays (ELISAs) to quantify 11 QWN-enriched proteins (Supplementary Table 8) in 39 patient samples (13 non-tumour, 13 glioblastoma and 13 meningioma). We observed a strong correlation between the QWN corona proteomics identification of differentially enriched corona proteins and whole-plasma ELISA detection. In particular, differentially enriched tumour non-specific proteins, including ANXA1, ANXA3 and FCAR (Fig. 5d(1)–(3)) showed increased presence in both tumours compared with healthy samples (Fig. 2b). AEBP1 and FGL1 were detected in significantly higher quantities in meningioma samples compared with both healthy and glioblastoma samples (Fig. 5d(4),(5)), which aligns with our proteomics results (Fig. 3b). CRYAB demonstrated consistent enrichment (Fig. 5d(6)) in glioblastoma samples compared with healthy and meningioma samples, consistent with Fig. 3b. Finally, SERPINA3 was enriched in glioblastoma patients relative to meningioma patients (Fig. 5d(7)), consistent with our direct glioblastoma–meningioma comparison (Fig. 4a). Overall, 7 of the 11 QWN-enriched proteins tested achieved statistical significance for either or both tumour types in the whole-plasma samples (Fig. 5d and Supplementary Fig. 14).
Conclusion
We report a MPLB method that detected CNS tumours using peripheral blood, identified major CNS tumour subtypes, and enabled discovery of novel tumour ecosystem blood biomarkers responsible for the detection signal. Notably, blood was collected in routine EDTA plasma tubes and the assay did not require specialized collection or processing methods. QWNs, consisting of QWNTs, and processed using machine-learning algorithms, enabled the MPLB to distinguish brain tumours with an accuracy of 98% and to classify tumour type with up to 71% accuracy. The QWN identified by the machine-learning analysis to contribute most to tumour identification was used used for analysis of QWN-enriched corona proteins via quantitative proteomics. The analysis identified a combination of tumour-derived and TME-associated and systemic immunological and inflammatory proteins, originating from multiple components of the tumour ecosystem. Using identified proteins to interrogate the QWN, 67% of the proteins elicited quantitative optical responses, whereas only 14% of non-enriched proteins generated a response. This finding aligns with the hypothesis that the disease fingerprint of the perception-based tumour detection originated from the enriched proteins. We validated a panel of 11 potential biomarkers in whole-patient plasma and found consistent elevation in 7 of the 11 biomarkers evaluated across either glioblastoma, meningioma or both tumour types. This result suggests that protein corona analysis of QWN-bound biomolecules may assist in identifying novel biomarkers and provide an efficient workflow for biomarker discovery.
Our results demonstrate that the MPLB platform leverages the detection of tumour-derived, TME-associated and systemic biomarkers, capturing a wide range of disease-associated signals and resulting in its high sensitivity. Accurate early detection of lesions in the CNS could improve treatment outcomes because current circulating tumour DNA detection technologies exhibit low sensitivity for brain tumours and struggle to identify early-stage and small asymptomatic lesions9. Of particular clinical importance, the MPLB models were able to accurately detect the presence of low-grade gliomas, with 44 samples in our cohort from patients with WHO grade 1–2 gliomas. The MPLB approach, if prospectively validated, may be used as a blood-based, minimally invasive screening or diagnostic assay. With a low blood volume requirement and no special collection method required, the MPLB platform could serve as an accessible and cost-effective complement to imaging technologies, enabling more frequent assessments required for monitoring treatment. Because the technology does not rely on antibody-based components or genomic sequencing, it is potentially more portable and relatively inexpensive (with costs of less than US$5 per sample)14. Finally, the capacity of MPLB to identify biomarkers offers a novel approach to improving diagnostic accuracy and guiding personalized treatment strategies across various disorders.
Methods
Plasma sample acquisition and handling
A total of 690 patient specimens (Fig. 1a) were analysed under a material transfer agreement from New York University under an applicable institutional review board (IRB)-approved collection procedure (IRB number i14-948). They were comprised of samples from 180 non-tumour participants, 205 glioma patients, 135 meningioma patients, 88 pituitary adenoma patients and 82 schwannoma patients (Supplementary Table 1). Patients diagnosed with primary intracranial tumours at NYU Langone Health between 2021 and 2024 were included. The plasma samples were obtained from the blood draw collected in a 10-ml EDTA tube, at time of primary diagnosis, prior to treatment. Plasma was separated following clinical protocols, and samples were preserved in a −80 °C freezer until they were thawed for analysis. Supplementary Fig. 4a indicates the WHO grade distribution of intracranial tumour samples. The age and sex distribution of tumour and non-tumour samples is reported in Supplementary Fig. 4b–d. An additional external dataset of 20 tumour samples (10 glioma, 10 meningioma) was acquired through a material transfer agreement from Northwestern University under an applicable IRB-approved collection procedure (IRB number 00095863) and an external dataset of 29 non-tumour samples was acquired under a Memorial Sloan Kettering Cancer Center IRB-approved protocol (IRB number 06-107) (Supplementary Table 5). See Supplementary Methods for more details on QWN and patient plasma handling.
Large-scale synthesis of QWNTs
QWNTs were developed using a modified previously published protocol14,47. Raw single-walled carbon nanotubes (SWCNTs; CoMoCat SG65i, Sigma-Aldrich, >95%) were used for the large-scale preparation of QWNTs. The SWCNTs were dissolved in chlorosulfonic acid (Sigma-Aldrich, 99.9%) at a concentration of ∼4 mg ml−1 with magnetic stirring, followed by the addition of either an aniline derivative at different molar ratios relative to the SWCNT carbon and equimolar amounts of sodium nitrite (Sigma-Aldrich, ≥97.0%), or a diazonium salt. The aniline derivatives used for these experiments include sulfanilic acid (Sigma-Aldrich, 97%), 3,4,5-trifluoroaniline (Sigma-Aldrich, 98%), N,N-diethyl-p-phenylenediamine (Sigma-Aldrich, 97%) and 4-aminobenzoic acid (Sigma-Aldrich, 99%). The diazonium salts tested for these experiments were 4-bromobenzenediazonium tetrafluoroborate (TCI Chemicals, 97%), 4-methoxybenzenediazonium tetrafluoroborate (Sigma-Aldrich, 98%), 4-nitrobenzenediazonium tetrafluoroborate (Sigma-Aldrich, 97%) and 3,5-dichlorophenyldiazonium tetrafluoroborate (Sigma-Aldrich) (Supplementary Table 2). The SWCNT–superacid mixture was then added drop-by-drop into Nanopure water with vigorous stirring. (Safety note: the neutralization process is aggressive; a substantial amount of heat and acidic smog can be generated. Personal protective equipment, including goggles/facial mask, lab coats and acid-resistant gloves, are necessary. The neutralization must be performed in a fume hood.) The resulting QWNTs instantly precipitate out from the solution. The precipitates were then filtered on an anodic aluminium oxide filtration membrane with a pore size of 0.02 μm (Cytiva, Whatman Anodisc), thoroughly rinsed with Nanopure water, and then dried in a vacuum oven.
Synthesis of QWN array
ssDNA QWNs were stabilized by 5 mg ml−1 ssDNA ((GT)15, (AT)15, (TAT)4 and (GCCCCG)3) (Integrated DNA Technologies) in phosphate-buffered saline (PBS) using a previously described protocol14. The specific ssDNA sequences chosen are known as ‘resolving sequences’ and wrap (6,5) carbon nanotubes with ordered helical pitch17,18,19,48, or have been utilized for biosensing applications14,49,50. The QWNTs were individually dispersed by ultrasonication at 6 W for 60 min using a probe-tip sonicator (Sonics & Materials) at 4 °C for 1 h. The ssDNA:QWNT mass ratio was 5:1. The resulting QWN solutions were centrifuged at 32,500g and 4 °C for 30 min (Thermo-Scientific, Sorvall MTX150). The 80% supernatant was dialysed against 1 l of PBS for 36 h with 3 changes of PBS to remove free DNA (Spectra-Por, Float-A-Lyzer; 1,000-kDa molecular weight cut-off). The absorption spectra of the dialysed solutions were collected with an ultraviolet–visible–near-infrared (UV–vis–NIR) spectrophotometer (Jasco, V-670) (Supplementary Fig. 1a). After subtracting background (OD@1,200 nm), the optical density at (6,5) E11 (∼1,000 nm) was used to estimate the relative QWN concentration51. NIR fluorescence spectra were acquired to confirm monodispersion (Fig. S1B).
PEG-lipid QWNs were stabilized with DMG-PEG2000 (Avanti Polar Lipids, >99%) using a modified protocol previously described20. In brief, QWNTs were initially suspended in sodium cholate (Sigma-Aldrich, 99%) at a concentration of 1 mg ml−1 via tip sonication at 6 W for 60 min using a probe-tip sonicator at 4 °C for 1 h. The solution was then centrifuged at 100,000g and 4 °C for 30 min and the 80% supernatant was dialysed against a 5 mg ml−1 solution of DMG-PEG2000 for 36 h with three changes of PBS solution to ensure full replacement of sodium cholate with PEG2000-DMG (Spectra-Por, Float-A-Lyzer; 800-Da molecular weight cut-off). The absorption spectra of the dialysed solutions were collected with a UV–vis–NIR spectrophotometer (Supplementary Fig. 1a). After subtracting background (OD@1,200 nm), the optical density at (6,5) E11 (μ1,000 nm) was used to estimate the relative QWN concentration51. NIR fluorescence spectra were acquired to confirm monodispersion (Supplementary Fig. 1b). See Supplementary Methods for more details on QWN and patient plasma handling.
High-throughput NIR spectroscopy
Fluorescence emission spectra of QWNs were acquired using a home-built NIR fluorescence spectroscopy apparatus consisting of a 1-W, 577-nm laser source at 50% power, an inverted microscope, and an InGaAs NIR detector14,15. The light path was shaped and fed into the back of an inverted IX-71 microscope (Olympus), where it passed through a 20× NIR objective (Olympus) and illuminated the samples in a 384-well plate. Emission from the QWNs was collected through the 20× objective and passed through an 875-nm cut-off dichroic mirror (IDEX Health and Science, Semrock). The light was f/# matched to the spectrometer using several lenses and injected into a Shamrock 303i spectrograph (Oxford Instruments, Andor) with a slit width of 100 μm, which dispersed the emission using an 86 grooves per mm grating with a 1.35-µm blaze wavelength. The spectral range was 723−1,694 nm with a resolution of 1.89 nm. The light was collected by an iDus 1.7-µm InGaAs detector (Oxford Instruments, Andor) with an exposure time of 0.5 s. An HL-3-CAL-EXT halogen calibration light source (Ocean Optics) was used to correct for wavelength-dependent features in the emission intensity arising from the spectrometer, detector and other optics. A Hg/Ne pencil-style calibration lamp (Newport) was used to calibrate the spectrometer wavelength. The NIR absorbance of the polystyrene-base 384-well plate was corrected using a UV–vis–NIR acquired absorbance spectrum, which was then applied to all data spectra. Background subtraction was conducted using a well in a 384-well plate filled with PBS or 20% plasma as required by the experiment. See Supplementary Methods for more details on data processing.
Model development and performance assessment
First, we removed any highly correlated features within or between QWNs with Pearson’s correlation coefficient r > 0.85 (Supplementary Figs. 8 and 9). We evaluated the degree to which the spectral responses clustered based on clinical cohort for both non-tumour/tumour identification, and for tumour subtype discrimination. We found that the non-tumour and tumour samples formed two clear clusters (Fig. 1c), with PC1–3 explaining 45.05%, 23.59% and 9.74% of the variance. For discrimination between subtypes of tumours, PC1–3 explained 30.43%, 14.32% and 10.44% of the variance, respectively, and did not form clear clusters between groups (Supplementary Fig. 6a). We then split the dataset into a training (70%) and testing (30%) dataset where the test set would be held out until model evaluation. On the training set we conducted feature selection between the remaining QWN features using the ANOVA-based scikit-learn feature selection toolkit21 to select the most promising features. We found that 58 of the 126 features had significant differences between means (P < 0.10) (Supplementary Fig. 3a), which we then used for further model evaluation. Using algorithms implemented in scikit-learn, we optimized models based on gradient boosting for binary classification52. Hyperparameters for each model were tuned using Bayesian optimization, implemented in the HyperOpt library53 (Supplementary Table 3). The loss function to minimize in the hyperparameter optimization was set to (1 – F1-score). F1-score is a measure of performance in binary classification and is calculated from the harmonic mean of the precision and recall ((frac{2}{mathrm{recall}+mathrm{precision}})). To control for overfitting, CatBoost incorporates regularization implicitly through mechanisms such as shrinkage (learning rate), L2 regularization on leaf values, and its use of oblivious decision trees. To further rule out overfitting in the machine-learning process, model performance was evaluated using 5-fold cross-validation54. In the cross-validation process, stratified shuffle split validation was used to randomly partition the training dataset into five subsamples. In each partition, four of the five subsamples were used to train the model, while a single subsample was used to test the trained model. The average F1-score of the 5-fold cross-validation was used to assess model performance during training. Using the optimal parameters for each trained model, the classification probability was calculated for each sample in the cross-validation test set. The classification probability threshold was tuned to maximize the F1-score and further optimize each model. Finally, we evaluated the model performance on the optimized trained model by evaluating its performance on the held-out test set. We excluded overfitted and underfitted models whose differences between cross-validation and test scores were larger than 0.15. Consistent ROC–AUC values between test and cross-validation sets of the optimized models suggest robustness of the spectral response features for tumour identification (Fig. 1e) and tumour subtype discrimination (Supplementary Fig. 6b–g). To assess the performance of single sensors, models were developed using the aforementioned processes, using all uncorrelated features from each individual sensor, with the results reported in Supplementary Fig. 3b for tumour/non-tumour differentiation, and in Supplementary Fig. 3c for glioma/meningioma differentiation.
Isolation and characterization of protein–nanotube corona
The protein corona extraction protocol was adapted24 for consistency with our fluorescence experiment protocol. In brief, plasma samples were initially centrifuged at 13,000g in a tabletop centrifuge (Eppendorf, 5430R) at 4 °C for 5 min to remove any aggregates. Then, 600 μl plasma was combined with 2330 μl PBS and 70 μl QWN (A990 = 4.67), bringing the final concentration of QWN to 0.26 mg l−1 and plasma concentration to 20% v/v, to be consistent with concentrations of nanosensor and plasma in sensor experiments. Similar to the fluorescence spectroscopy experiments, samples were allowed to reach binding equilibrium on an orbital shaker (on setting 5) (Scientific Industries, Mini-100 Orbital Genie) at 24 °C for 120 min. Each 3,000-μl sample was divided into three aliquots of 1,000 μl and centrifuged at 16,000g at 4 °C for 25 min. Supernatant was removed and the pellet of each of the three tubes was resuspended in 1,250 μl PBS in one aliquot. The centrifugation and washing process was completed two further times for a total of three times. UV–vis–NIR absorbance spectroscopy was conducted on supernatant at each step to ensure complete QWN precipitation (Supplementary Fig. 10a). Initial incubations demonstrated characteristic absorbance spectra of (6,5)-QWN (Supplementary Fig. 10a). Subsequent supernatant and washes following protein corona extraction indicated that no QWN was lost during the extraction protocol (Supplementary Fig. 10a). Next, the protein corona was eluted off QWNs by adding 200 μl 1,1,1,3,3,3-hexafluoro-2-propanol (HFIP) (Sigma-Aldrich, 99%) to the pellet, and filtering the solution through a 200-μm PTFE membrane filter (MilliporeSigma, Ultrafree-MC centrifugal filter) by centrifuging at 12,000g for 10 min, ensuring all the HFIP went through the filter into the bottom collection chamber. The elution step was repeated one more time by adding an additional 200 μl HFIP to the top chamber, resuspending the QWN pellet in the supernatant chamber and spinning at 12,000g for 10 min. Finally, the eluted protein in HFIP was transferred to a LoBind tube (Eppendorf) and frozen at −80 °C. Reproducibility of the protein corona extraction was assessed via Bradford protein quantitation assay at each step of the extraction protocol (Supplementary Fig. 10b). Approximately 40 mg ml−1 of protein was detected in the initial incubation. Removal of unbound and weakly bound protein quickly approached zero with subsequent QWN washing steps. Following addition of HFIP, tightly bound protein corona proteins were eluted off the QWN. Subsequent HFIP wash steps removed minimal protein, indicating complete removal of protein corona from QWNs (Supplementary Fig. 10b). See Supplementary Methods for more details on protein digestion and processing.
Crude plasma proteomics digestion and processing
Samples in LoBind tubes (1 µg) were brought up to 100 µl with 100 mM EPPS + 1% SDS and were then reduced (1 mM TCEP (catalogue number C4706, Sigma-Aldrich), 5 min at room temperature) and alkylated (20 mM 2-chloroacetamide (catalogue number C0267, Sigma-Aldrich), 10 min at room temperature) followed by single-pot solid-phase-enhanced sample preparation (SP3) protein clean-up55. Samples were briefly dried and resuspended in 30 µl of digestion buffer (100 mM EPPS, pH 8.5, 0.1% RapiGest) and digested for 8 h with trypsin (100:1 protein:protease ratio) at 37 °C. Digests, separated from the beads, were then labelled with TMTpro and labelling efficiency was monitored on a small aliquot (1 µl). TMTpro reaction was quenched by adding 4 µl of 50% hydroxylamine (catalogue number 438227, Sigma-Aldrich) and allowing the reaction to proceed for 5 min to quench unreacted TMTpro in each sample, vortexed and spun down. Next, the TMTpro-labelled samples were pooled together at a 1:1 ratio, vacuum centrifuged to near dryness and subjected to C18 solid-phase extraction (SPE) (catalogue number WAT054960, Waters). The dried TMTpro-labelled sample was resuspended in 100 ml of 10 mM NH4HCO3 pH 8.0 and fractionated using high pH reverse-phase high-performance liquid chromatography56. Briefly, samples were offline fractionated over a 90-min run, into 96 fractions by high pH reverse-phase high-performance liquid chromatography (Agilent LC1260) through an Aeris peptide xb-c18 column (Phenomenex; 250 mm × 3.6 mm) with mobile phase A containing 5% acetonitrile and 10 mM NH4HCO3 in liquid chromatography–mass spectrometry (LC–MS)-grade H2O, and mobile phase B containing 90% acetonitrile and 10 mM NH4HCO3 in LC–MS-grade H2O (both pH 8.0). The 96 resulting fractions were then pooled in a non-continuous manner for mass spectrometry analysis. Fractions were vacuum centrifuged to near dryness. Each consolidated fraction was desalted via the stage tip, dried again via vacuum centrifugation, and reconstituted in 5% acetonitrile and 1% formic acid for liquid chromatography–tandem mass spectrometry (LC–MS/MS) processing. See Supplementary Methods for details on proteomics data acquisition.
Proteomics data analysis
Mass spectra were processed using a Comet-based (2020.01 rev. 4) software pipeline57,58. Spectra were first converted to mzXML and monoisotopic peaks were reassigned using Monocle software59. Tandem mass spectrometry spectra were matched with peptide sequences with a composite sequence database, including the Human Reference Proteome (2022-03—SwissProt and TrEMBL entries, encompassing canonical and isoform sequences) UniProt database and sequences of common contaminants. This database was concatenated with one composed of all protein sequences in the reversed order. Analysis was performed using a 50-ppm precursor ion tolerance. Static modifications included TMTpro tags on lysine residues and peptide N termini (+304.207 Da) and carbamidomethylation of cysteine residues (+57.021 Da). Oxidation of methionine residues (+15.995 Da) was set as a variable modification. Peptide-spectrum matches (PSMs) were adjusted to a 1% false discovery rate (FDR)60. PSM filtering was performed using a linear discriminant analysis61, while considering the following parameters: Comet log expect, different sequence delta Comet log expect, missed cleavages, peptide length, charge state, precursor mass accuracy, and fraction of ions matched. For protein-level comparisons, PSMs were identified, quantified and collapsed to a peptide level FDR of 1% and then collapsed further to a final protein-level FDR of 1%62. The principles of parsimony were applied to generate the smallest set of proteins required to account for all observed peptides. For TMTpro-based reporter ion quantitation, the summed signal-to-noise ratio for each TMTpro channel was first extracted based on the closest matching centroid to the expected mass of the TMTpro reporter ion (integration tolerance, 0.003 Da). Isotopic impurities of the different TMTpro reagents provided by the manufacturer specifications were used to adjust reporter ion intensities. Proteins were quantified by summing reporter ion signal-to-noise measurements across all matching PSMs, resulting in a ‘summed signal-to-noise’ measurement. PSMs with poor quality, or isolation specificity <0.5, or with TMT reporter summed signal-to-noise ratio that was <180 or had no MS3 spectra were excluded from quantification. Out of the 54 corona extract samples, we excluded three samples after initial quality control. PCA of protein abundance confirmed that the samples did not visually appear to cluster between experiments (Supplementary Fig. 10c), but recapitulated sensor trends in cohort responses (Fig. 1c and Supplementary Fig. 10d). Protein quantification values were exported for further analysis in Microsoft Excel and Perseus63. Volcano plots were visualized using the EnhancedVolcano package in R64. P values in the volcano plots of the proteomics data were obtained by two-sided Welch’s t-test, which was adjusted for multiple comparisons. To estimate protein abundance in the TMTpro-labelled samples (Fig. 2g), the MaxLFQ intensities were calculated using FragePipe (v.22), and the abundance was determined as a percentage of the sample’s total MaxLFQ signal. See Supplementary Methods for more details on Gene Ontology analyses.
Single-analyte titration onto QWNs
Recombinant human proteins (Supplementary Table 7) were reconstituted in 20 mM PBS and 5× serial dilutions were created from 246 μg ml−1 to a final concentration of 0.015 μg ml−1. Then, 90 μl of each dilution was combined with 30 μl of pooled healthy donor apheresis-derived EDTA plasma (Innovative Research; final concentration, 20% v/v) or 30 μl of PBS. Then, 30 μl of QWN (1.3 mg l−1) was added, resulting in a final concentration of 0.26 mg l−1 QWN. In triplicate, 50 μl of QWN–protein–(plasma/PBS) was plated in 384-well plates, sealed with well-plate optical tape (Bio-Rad) and incubated at room temperature on a rotational shaker. The fluorescence spectra of the sensors were obtained 2 h after the incubation using a consistent experimental set-up and acquisition and processing parameters as previously described. For each dose–response curve for all spectral features, both a linear model ((y=mtimes [C]+b)) or a four-parameter log-logistic model ((y=frac{mathrm{top}-mathrm{bottom}}{1+{frac{[C]}{{mathrm{EC}}_{50}}}^{mathrm{hill},mathrm{slope}}})) were computed along with goodness of fit (R2). Goodness of model fit was evaluated by both the model R2 being>0.70 and the magnitude of response at the maximally applied concentration being >±1 nm for wavelength-based features and >±20% for intensity-based features.
Immunosorbent assays
Plasma concentrations of candidate biomarkers were determined using ELISAs from Novus Biologics (Supplementary Table 8). All ELISAs were plated in 96-well plates with 100 μl of undiluted EDTA patient plasma, unless otherwise indicated, in accordance with the manufacturer’s specifications. All quantified samples were confirmed to be in the linear range of the ELISA standard curve. Data were acquired as per the manufacturer’s specifications on a TECAN Spark Multimode Microplate Reader.
Statistical design and analyses
All statistical analyses applied throughout the manuscript and supplemental information satisfied the assumptions of the applied statistical test (for example, normality, homoscedasticity, independence of measurements). No statistical methods were used to predetermine sample sizes. For all experiments described in this manuscript, data collection and experimental ordering was randomized, and the experimenter was blinded to the order of experimental conditions. No data were excluded from analysis.
Reporting summary
Further information on research design is available in the Nature Portfolio Reporting Summary linked to this article.
Data availability
All the data that support the findings of this study are available within the Article and the Supplementary Information. Raw spectral data are available via Zenodo at https://doi.org/10.5281/zenodo.17343533 (ref. 65). Proteomics data have been deposited in the MassIVE repository with the dataset identifier MSV000099468. Source data are provided with this paper.
Code availability
The code used to develop the claims made in the Article and the Supplementary Information is available via Zenodo at https://doi.org/10.5281/zenodo.17343533 (ref. 65).
References
-
Rouse, C., Gittleman, H., Ostrom, Q. T., Kruchko, C. & Barnholtz-Sloan, J. S. Years of potential life lost for brain and CNS tumors relative to other cancers in adults in the United States, 2010. Neuro-Oncol. 18, 70–77 (2015).
-
Chen, W. & Silverman, D. H. S. Advances in evaluation of primary brain tumors. Semin. Nucl. Med. 38, 240–250 (2008).
-
Kros, J. M. From expert opinion to evidence-based: changes in the gold standard of primary brain tumour diagnosis. J. Pathol. 213, 1–3 (2007).
-
Galldiks, N. et al. Challenges, limitations, and pitfalls of PET and advanced MRI in patients with brain tumors: A report of the PET/RANO group. Neuro-Oncol. 26, 1181–1194 (2024).
-
Abd-Ellah, M. K., Awad, A. I., Khalaf, A. A. M. & Hamed, H. F. A. A review on brain tumor diagnosis from MRI images: practical implications, key achievements, and lessons learned. Magn. Reson. Imaging 61, 300–318 (2019).
-
Erdi, Y. E. Limits of tumor detectability in nuclear medicine and PET. Mol. Imaging Radionucl. Ther. 21, 23–28 (2012).
-
Alix-Panabières, C. & Pantel, K. Liquid biopsy: from discovery to clinical application. Cancer Discov. 11, 858–873 (2021).
-
Ma, M. et al. Liquid biopsy’—ctDNA detection with great potential and challenges. Ann. Transl. Med. 3, 235 (2015).
-
Schrag, D. et al. Blood-based tests for multicancer early detection (PATHFINDER): a prospective cohort study. Lancet 402, 1251–1260 (2023).
-
Salfer, B., Li, F., Wong, D. T. W. & Zhang, L. Urinary cell-free DNA in liquid biopsy and cancer management. Clin. Chem. 68, 1493–1501 (2022).
-
Nonaka, T. & Wong, D. T. W. Saliva diagnostics: salivaomics, saliva exosomics, and saliva liquid biopsy. J. Am. Dent. Assoc. 154, 696–704 (2023).
-
Hadjidemetriou, M., Al-ahmady, Z., Buggio, M., Swift, J. & Kostarelos, K. A novel scavenging tool for cancer biomarker discovery based on the blood-circulating nanoparticle protein corona. Biomaterials 188, 118–129 (2019).
-
Mair, R. & Mouliere, F. Cell-free DNA technologies for the analysis of brain cancer. Br. J. Cancer 126, 371–378 (2022).
-
Kim, M. et al. Detection of ovarian cancer via the spectral fingerprinting of quantum-defect-modified carbon nanotubes in serum by machine learning. Nat. Biomed. Eng. 6, 267–275 (2022).
-
Yaari, Z. et al. A perception-based nanosensor platform to detect cancer biomarkers. Sci. Adv. 7, eabj0852 (2021).
-
Brozena, A. H., Kim, M., Powell, L. R. & Wang, Y. Controlling the optical properties of carbon nanotubes with organic colour-centre quantum defects. Nat. Rev. Chem. 3, 375–392 (2019).
-
Roxbury, D., Mittal, J. & Jagota, A. Molecular-basis of single-walled carbon nanotube recognition by single-stranded DNA. Nano Lett. 12, 1464–1469 (2012).
-
Roxbury, D., Tu, X., Zheng, M. & Jagota, A. Recognition ability of DNA for carbon nanotubes correlates with their binding affinity. Langmuir 27, 8282–8293 (2011).
-
Lin, Z., Yang, Y., Jagota, A. & Zheng, M. Machine learning-guided systematic search of DNA sequences for sorting carbon nanotubes. ACS Nano 16, 4705–4713 (2022).
-
Bisker, G. et al. Protein-targeted corona phase molecular recognition. Nat. Commun. 7, 10241 (2016).
-
Pedregosa, F. et al. Scikit-learn: machine learning in python. J. Mach. Learn. Res. 12, 2825–2830 (2011).
-
Prokhorenkova, L., Gusev G., Vorobev, A., Dorogush, A. V. & Gulin, A. CatBoost: unbiased boosting with categorical features. Preprint at https://arxiv.org/abs/1706.09516 (2017).
-
Spreinat, A. et al. Quantum defects in fluorescent carbon nanotubes for sensing and mechanistic studies. J. Phys. Chem. C. 125, 18341–18351 (2021).
-
Pinals, R. L. et al. Quantitative protein corona composition and dynamics on carbon nanotubes in biological environments. Angew. Chem. Int. Ed. 59, 23668–23677 (2020).
-
Li, J. et al. TMTpro-18plex: the expanded and complete set of TMTpro reagents for sample multiplexing. J. Proteome Res. 20, 2964–2972 (2021).
-
Meijer, B., Gearry, R. B. & Day, A. S. The role of S100A12 as a systemic marker of inflammation. Int. J. Inflamm. 2012, 907078 (2012).
-
Zhao, Y. et al. The orphan immune receptor LILRB3 modulates Fc receptor–mediated functions of neutrophils. J. Immunol. 204, 954–966 (2020).
-
Bakema, J. E. & van Egmond, M. The human immunoglobulin A Fc receptor FcαRI: a multifaceted regulator of mucosal immunity. Mucosal Immunol. 4, 612–624 (2011).
-
Benesch, M. G., Zhao, Y. Y., Curtis, J. M., McMullen, T. P. & Brindley, D. N. Regulation of autotaxin expression and secretion by lysophosphatidate and sphingosine 1-phosphate. J. Lipid Res. 56, 1134–1144 (2015).
-
Kawahara, M., York, I. A., Hearn, A., Farfan, D. & Rock, K. L. Analysis of the role of tripeptidyl peptidase II in MHC class I antigen presentation in vivo. J. Immunol. 183, 6069–6077 (2009).
-
Xiao, Y., Yang, Y., Xiong, H. & Dong, G. The implications of FASN in immune cell biology and related diseases. Cell Death Dis. 15, 88 (2024).
-
Tsuchiya, N. et al. SND1, a component of RNA-induced silencing complex, is up-regulated in human colon cancers and implicated in early stage colon carcinogenesis. Cancer Res. 67, 9568–9576 (2007).
-
Mi, H. & Thomas, P. in Protein Networks and Pathway Analysis (eds Yuri Nikolsky & Julie Bryant) 123–140 (Humana, 2009).
-
Hallal, S. M. et al. Glioblastoma biomarkers in urinary extracellular vesicles reveal the potential for a ‘liquid gold’ biopsy. Br. J. Cancer 130, 836–851 (2024).
-
Arora, A. et al. Serum biomarkers identification by iTRAQ and verification by MRM: S100A8/S100A9 levels predict tumor-stroma involvement and prognosis in Glioblastoma. Sci. Rep. 9, 2749 (2019).
-
Behling, F. et al. The prognostic role of the immunohistochemical expression of S100 in meningiomas. J. Cancer Res. Clin. Oncol. 149, 2975–2985 (2023).
-
Zhao, C. et al. Expression of S100A9 in adamantinomatous craniopharyngioma and its association with wet keratin formation. Exp. Therapeutic Med. 25, 282 (2023).
-
Zhai, H. et al. Annexin A2 promotes glioma cell invasion and tumor progression. J. Neurosci. 31, 14346–14360 (2011).
-
Ghorbani, A. et al. Discovery of novel glioma serum biomarkers by proximity extension assay. Clin. Proteom. 20, 12 (2023).
-
Miyauchi, E. et al. Identification of blood biomarkers in glioblastoma by SWATH mass spectrometry and quantitative targeted absolute proteomics. PLOS ONE 13, e0193799 (2018).
-
Kanno, S. et al. Scavenger receptor MARCO contributes to cellular internalization of exosomes by dynamin-dependent endocytosis and macropinocytosis. Sci. Rep. 10, 21795 (2020).
-
Yang, X. et al. Autoimmunity-associated T cell receptors recognize HLA-B*27-bound peptides. Nature 612, 771–777 (2022).
-
Sanchez-Moral, L. et al. Macrophage CD5L is a target for cancer immunotherapy. eBioMedicine https://doi.org/10.1016/j.ebiom.2023.104555 (2023).
-
Cao, L., Gao, W., Yang, H., Zeng, R. & Yin, Z. Adipocyte enhancer binding protein 1 knockdown alleviates osteoarthritis through inhibiting NF-κB signaling pathway-mediated inflammation and extracellular matrix degradation. J. Cell Commun. Signal. 18, e12022 (2024).
-
Jiang, J. et al. The expression of fatty acid metabolism-associated proteins is correlated with the prognosis of meningiomas. Apmis 121, 997–1003 (2013).
-
Etter, M. et al. BIOM-25. Identification of plasma-derived predictive biomarkers including serpina3 for glioma and glioblastoma. Neuro-Oncol. 25, v9 (2023).
-
Luo, H.-B. et al. One-pot, large-scale synthesis of organic color center-tailored semiconducting carbon nanotubes. ACS Nano 13, 8417–8424 (2019).
-
Shankar, A., Mittal, J. & Jagota, A. Binding between DNA and carbon nanotubes strongly depends upon sequence and chirality. Langmuir 30, 3176–3183 (2014).
-
Kruss, S. et al. Neurotransmitter detection using corona phase molecular recognition on fluorescent single-walled carbon nanotube sensors. J. Am. Chem. Soc. 136, 713–724 (2014).
-
Kim, M. et al. Nanosensor-based monitoring of autophagy-associated lysosomal acidification in vivo. Nat. Chem. Biol. 19, 1448–1457 (2023).
-
Streit, J. K., Bachilo, S. M., Ghosh, S., Lin, C.-W. & Weisman, R. B. Directly measured optical absorption cross sections for structure-selected single-walled carbon nanotubes. Nano Lett. 14, 1530–1536 (2014).
-
Dorogush, A. V., Ershov, V. & Gulin, A. CatBoost: gradient boosting with categorical features support. Preprint at https://arxiv.org/abs/1810.11363 (2018).
-
Bergstra, J., Yamins, D. & Cox, D. D. Making a science of model search: hyperparameter optimization in hundreds of dimensions for vision architectures. In Proc. of the 30th International Conference on Machine Learning (ICML 2013) 115–123 (PMLR, 2013).
-
Ng, A. Preventing ‘overfitting’ of cross-validation data. In Proc. Fourteenth International Conference on Machine Learning (ed. Fisher, D. H.) 245–253 (Morgan Kaufmann Publishers, 1998).
-
Moggridge, S., Sorensen, P. H., Morin, G. B. & Hughes, C. S. Extending the compatibility of the SP3 paramagnetic bead processing approach for proteomics. J. Proteome Res. 17, 1730–1740 (2018).
-
Wang, Y. et al. Reversed-phase chromatography with multiple fraction concatenation strategy for proteome profiling of human MCF10A cells. Proteomics 11, 2019–2026 (2011).
-
Eng, J. K. et al. A deeper look into Comet—implementation and features. J. Am. Soc. Mass Spectrom. 26, 1865–1874 (2015).
-
Eng, J. K., Jahan, T. A. & Hoopmann, M. R. Comet: an open-source MS/MS sequence database search tool. Proteomics 13, 22–24 (2013).
-
Rad, R. et al. Improved monoisotopic mass estimation for deeper proteome coverage. J. Proteome Res. 20, 591–598 (2021).
-
Elias, J. E. & Gygi, S. P. Target-decoy search strategy for increased confidence in large-scale protein identifications by mass spectrometry. Nat. Methods 4, 207–214 (2007).
-
Huttlin, E. L. et al. A tissue-specific atlas of mouse protein phosphorylation and expression. Cell 143, 1174–1189 (2010).
-
Savitski, M. M., Wilhelm, M., Hahne, H., Kuster, B. & Bantscheff, M. A scalable approach for protein false discovery rate estimation in large proteomic data sets. Mol. Cell. Proteom. 14, 2394–2404 (2015).
-
Tyanova, S. et al. The Perseus computational platform for comprehensive analysis of (prote)omics data. Nat. Methods 13, 731–740 (2016).
-
Blighe, K., Rana, S. & Lewis, M. EnhancedVolcano: publication-ready volcano plots with enhanced colouring and labeling. (2022).
-
Goerzen, D. Machine perception liquid biopsy identifies brain tumors via systemic immune and tumor microenvironment signature. Zenodo https://doi.org/10.5281/zenodo.17343533 (2025).
Acknowledgements
We acknowledge B. Moorefield for her valuable discussions on a draft of the manuscript. We acknowledge funding from a MSKCC Cancer Center Support Grant (P30CA008748 (D.A.H., A.O.)), the National Institute of Biomedical Imaging and Bioengineering (R01-EB033651 (D.A.H.)), a National Science Foundation CAREER Award (1752506 (D.A.H.)), the National Science Foundation (DMREF 2323759 (D.A.H.)), the New York State Biodefense Commercialization Fund (D.A.H.), the Honorable Tina Brozman Foundation for Ovarian Cancer Research (D.A.H.), the Ovarian Cancer Research Alliance (D.A.H.), the Expect Miracles Foundation—Financial Services Against Cancer (D.A.H.), the Cycle for Survival’s Equinox Innovation Award in Rare Cancers at Memorial Sloan Kettering Cancer Center (D.A.H.), a Canadian Institutes for Health Research Doctoral Foreign Study Award (DFD-193220 (D.G.)), a General Atlantic Predoctoral Fellowship (D.G.), the National Institutes of Health (R00-EB033580 (M.K.)), a Marie-Josée Kravis Women in Science Endeavor Postdoctoral Fellowship (M.K.), NIH T32 GM136640-Tan (M.N.H., J.S.W.), a National Cancer Institute grant (P50CA221747 (CH)), The Bergman Family Foundation and Chordoma Foundation (K.G.), a National Institute of Neurological Disorders and Stroke grant (R01-NS122987 (M.S.)), Sloan Kettering Institute start-up funds (A.O.) and the National Institute of General Medical Sciences (R35GM156454 (A.O.)).
Ethics declarations
Competing interests
D.A.H. is a co-founder, board member and officer with equity interest in Nine Diagnostics Inc., a co-founder with equity interest and intellectual property interests in Selectin Therapeutics Inc., and a co-founder with equity in Lime Therapeutics Inc., a member of the scientific advisory boards of Concarlo Therapeutics Inc., Celine Therapeutics Inc., Nanorobotics Inc., and Mediphage Bioceuticals Inc., and a consultant for Metis Therapeutics Inc. M.K. is a co-founder and officer with equity interest in Nine Diagnostics. S.R. is a consultant to Grail, Exact Sciences, C the Signs, and the American Cancer Society. M.S. is a scientific advisor and shareholder of Heidelberg Epignostix and Halo Dx, a scientific advisor of Arima Genomics and InnoSIGN, has consulted for Servier Pharmaceuticals, and has received research funding from Lilly USA. The other authors declare no competing interests.
Peer review
Peer review information
Nature Nanotechnology thanks Eleonora Macchia, Robert Nißler and Emilia Peltola for their contribution to the peer review of this work.
Additional information
Publisher’s note Springer Nature remains neutral with regard to jurisdictional claims in published maps and institutional affiliations.
Extended data
Supplementary information
Source data
Rights and permissions
Open Access This article is licensed under a Creative Commons Attribution-NonCommercial-NoDerivatives 4.0 International License, which permits any non-commercial use, sharing, distribution and reproduction in any medium or format, as long as you give appropriate credit to the original author(s) and the source, provide a link to the Creative Commons licence, and indicate if you modified the licensed material. You do not have permission under this licence to share adapted material derived from this article or parts of it. The images or other third party material in this article are included in the article’s Creative Commons licence, unless indicated otherwise in a credit line to the material. If material is not included in the article’s Creative Commons licence and your intended use is not permitted by statutory regulation or exceeds the permitted use, you will need to obtain permission directly from the copyright holder. To view a copy of this licence, visit http://creativecommons.org/licenses/by-nc-nd/4.0/.
About this article

Cite this article
Goerzen, D., Kim, M., Schroff, C. et al. Machine perception liquid biopsy identifies brain tumours via systemic immune and tumour microenvironment signature. Nat. Nanotechnol. (2025). https://doi.org/10.1038/s41565-025-02080-2
-
Received:
-
Accepted:
-
Published:
-
Version of record:
-
DOI: https://doi.org/10.1038/s41565-025-02080-2