
Introduction
Alzheimer’s disease (AD), the most common neurodegenerative disease and leading cause of dementia1, is characterized by profound disruptions in brain homeostasis2,3. After being sidelined for years, the importance of the brain’s lipid metabolism disruptions is gaining increased attention from the AD research community. While amyloid-beta (Aβ) accumulation remains a hallmark of AD pathology4, emerging evidence reveals that lipid dysregulation can drive amyloidosis through mechanisms such as modulation of membrane fluidity, secretase compartmentalization, and Aβ aggregation kinetics5,6,7,8. Notably, modern lipidomic analyses have revealed disease-stage-specific perturbations in phospholipids9, sphingolipids10,11, and cholesterol12, positioning lipid imbalances as initiators of AD pathogenesis13.
Genetic studies14 highlight the central role of lipid metabolism, with microglial-enriched lipid metabolism risk genes15 (e.g., TREM216,17, PLCG218, INPP5D, GRN19) regulating Aβ clearance and neuroinflammation. While microglial lipid handling intersects critically with Aβ pathology20, chronic activation paradoxically impairs phagocytosis21. Pharmacological approaches targeting microglia, such as colony-stimulating factor 1 receptor (CSF1R) inhibition, have demonstrated mixed outcomes on AD pathology, with effects varying based on the timing and extent of microglial depletion22,23,24. Multiple studies have consistently shown that CSF1R inhibitors, PLX3397 and PLX5622, by partially depleting microglia, can reduce dense core amyloid plaque load25,26, increase diffusible amyloid, reduce tau pathologies27, reduce synaptic and neuronal loss, and improve cognition28. However, some studies that have reported no changes in AD pathologies following partial microglial elimination29. On the other hand, a recent study30 reported that fully eliminating microglia via genetic depletion of the microglia-associated fms intronic regulatory element (FIRE) enhancer at the Csf1r locus in a 5xFAD background, leads to brain calcification, cerebral hemorrhages, and premature lethality. Triggering receptor expressed on myeloid cells 2 (TREM2) deficiency ameliorates amyloid pathology at an early stage but exacerbates the disease progression at a late stage in the APPPS1–21 mouse model31. Yet, despite all the research emphasis, the effects of microglial elimination on brain lipid metabolism have been largely overlooked, except for one study specifically focused on leukotrienes, which demonstrated that microglia are essential to leukotriene synthesis32.
Lysophospholipids, long recognized as pro-inflammatory lipid mediators, are prominently elevated in neurodegeneration diseases, including AD8. These lipids are generated via enzymatic hydrolysis or oxidative cleavage of membrane phospholipids, particularly phosphatidylcholine (PC) and phosphatidylethanolamine (PE)—the two most abundant phospholipids in cellular membranes. Structurally, PC and PE feature a hydrophilic head group and two esterified hydrophobic acyl chains at the sn-1 and sn-2 positions. Their breakdown by phospholipase enzymes or reactive oxygen species (ROS) attack yields lysophosphatidylcholine (LPC) and lysophosphatidylethanolamine (LPE)33,34. Notably, both LPC and LPE, along with their primary cleavage enzyme cytosolic phospholipase A2 (cPLA2), are found at elevated levels in AD patients and mouse models8,35, implicating their role in neuroinflammatory pathways.
In addition to lysophospholipids, abnormal accumulation of bis(monoacylglycero)phosphate (BMP) has emerged as a feature of neurodegenerative diseases, including Lewy body dementia36, AD6,37, and senescence38. BMP is a structurally unique anionic phospholipid that facilitates lipid sorting, hydrolysis, and transport within late endosomes and lysosomes. By activating lipid hydrolases and lipid transfer proteins39,40,41,42,43,44,45, BMP ensures proper lipid metabolism and membrane trafficking. However, excessive BMP levels—observed in lysosomal storage disorders and energy-stressed cells—reflect impaired lysosomal function and contribute to pathogenic processes such as cholesterol accumulation and trafficking defects46,47,48. This dual role establishes BMP as both an critical regulator of lipid homeostasis within lysosomes and a biomarker of metabolic dysfunction in neurodegenerative diseases.
This study examines how amyloidosis influences brain lipid metabolism using 5xFAD transgenic mice (on both B6SJL and B6 genetic backgrounds), which faithfully recapitulate key aspects of Alzheimer’s disease (AD) amyloid pathology. Through the use of both pharmacological (short-term and long-term) and genetic microglial depletion approaches, we aimed to distinguish microglia-dependent from microglia-independent underlying lipid dysregulation in AD. The observed dysregulation of lipid metabolism may play a pivotal role in AD pathogenesis, highlighting its promise as a therapeutic target8. The intricate interplay between amyloidosis and lipid metabolism in AD underscores the complexity of the disease and suggests that strategies aimed at modulating lipid levels could help slow its progression. Ultimately, our findings help connect Alois Alzheimer’s original observations of lipid aggregates (“lipoid granules”) with genetically defined lipid pathways, inspiring potential cell-type-specific therapeutic targets for AD.
Results
Microglial depletion strategies and validation of amyloidosis-related phenotypes
Building on evidence linking Aβ pathology to dysregulated lipid metabolism5,6,7,8,9,10,11,12,13, we employed 5xFAD mice—a validated model of amyloidosis with progressive plaque deposition, microgliosis, and neuronal dysfunction—to investigate how microglia regulate brain lipid homeostasis in the context of human Aβ accumulation and aggregation. To disentangle microglial contributions, we combined pharmacological depletion (CSF1R inhibitor PLX5622) and genetic ablation (Csf1r enhancer deletion (FIRE) mice). We tested the effects of partial versus complete microglia elimination on brain lipid metabolism in the presence or absence of amyloidosis, using shotgun lipidomics, RNA profiling, and immunofluorescence approaches (Fig. 1A).

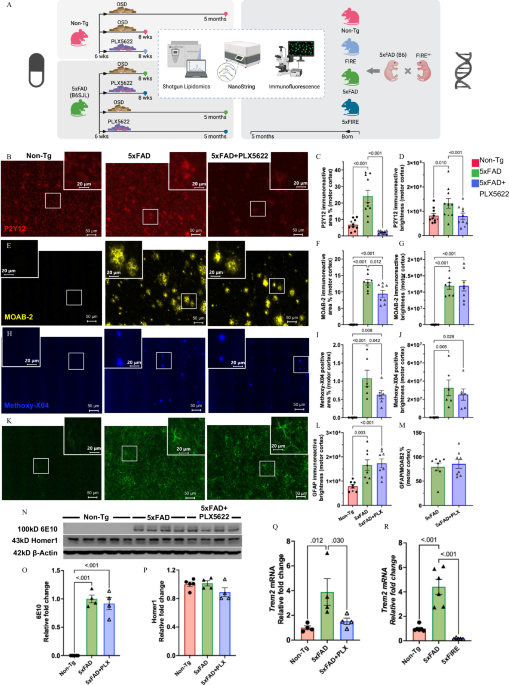
A Experimental timeline and interventions. Left: Pharmacological microglial depletion in non-transgenic (Non-Tg) and 5xFAD transgenic mice (mixed B6SJL background) using short-term (2-week) or long-term (3.5 months) treatment. Right: Genetic microglial ablation (FIRE) in 5xFAD mice (B6 background). OSD OpenStandard Diet (Research Diets). Brain samples were collected at indicated time points and analyzed by shotgun lipidomics, NanoString Glial Profiling Panel, and immunofluorescence. Schematic created in BioRender. Xu, Z. (2025) https://BioRender.com/6dlymhx. B–J Pathological characterization after long-term intervention. Representative images and quantifications of microglial marker (P2Y12) (B–D), amyloid beta (Aβ, MOAB-2) (E–G), and astrocytic marker (GFAP) (K–M) immunofluorescence, as well as Methoxy-X04 (H–J) fluorescent staining for fibrillar β-sheet amyloid plaques. Each data point represents a brain section, two sections from 3–4 female mice/group were quantified. BZ-X800 Analyzer auto function was used to set a threshold for each section. Representative images shown at matched magnifications and thresholds. N–P APP and neuronal levels. Western blot analysis of APP using 6E10 antibody and synaptic marker Homer1 (N), with corresponding quantifications displayed in panels (O) and (P), respectively. Each data point represents one animal, n = 4–5 mice/group. Trem2 mRNA quantification in both long-term pharmacological (Q) and (R) genetic cohorts. Each data point represents one animal, n = 4–6 mice/group. All data presented as mean ± SEM. Statistical analysis was performed in GraphPad using one-way ANOVA with Tukey’s post-hoc correction. Representative images (indicated by stars in the corresponding dot plots) were chosen from brain sections present on the same slide, with each slide containing sections from each experimental group. Scale bars: 50 μm for main panels (B–K); 20 μm for insets.
5xFAD (B6SJL) female mice were fed a 1200 ppm PLX5622-containing OpenStandard diet (OSD, Research diets) or control diet (OSD) starting at 6 weeks of age for short-term (2-week) and a long-term (3.5 months) periods (Fig. 1A). Short-term treatment led to almost complete elimination of microglia, evidenced by a 99% reduction of P2Y12 immunoreactive area (Fig. S1A-F) in both 5xFAD and Non-Tg mice; while long-term treatment resulted in a less dramatic but still substantial loss of microglia, with an 82% reduction of P2Y12 immunoreactive area in 5xFAD mice (Fig. 1B–C). P2Y12 immunoreactive area and brightness were not significantly different between untreated (OSD-fed) Non-Tg and 5xFAD at 2 months of age, whereas at 5 months of age, P2Y12 immunoreactive area and brightness were significantly increased in 5xFAD mice relative to Non-Tg controls (Fig. 1B-D). This was because most microglia surrounding amyloid plaques, i.e., disease-associated microglia (DAM), were highly immunofluorescent for P2Y12 relative to non-plaque microglia. At two months, there were very few highly intense P2Y12 cells in either genotype. As previously reported, DAM were also more ameboid and displayed fewer processes (Fig. 1B-D). Notably, the vast majority of P2Y12+ microglia left in the brains of 5 mo-old PLX-treated 5xFAD mice were surrounding amyloid plaques (i.e., DAM). On the other hand, the few microglia left in 2 mo-old PLX-treated Non-Tg and 5xFAD mice were mostly within white matter tracts, i.e., white matter-associated microglia (WAM), known to exhibit a DAM-like gene expression profile49,50.
The impact of long-term microglia depletion on amyloidosis was assessed via Aβ-specific immunofluorescence using MOAB-2 antibody, which binds Aβ but not APP51, and methoxy-X04 staining for fibrillar aggregates. Long-term PLX5622 treatment led to mild reductions in Aβ (−27%, adj. p = 0.012) (Fig. 1E-F) and fibrillar plaque loads (−42%, adj. p = 0.099) (Fig. 1H-I) consistent with previous studies25,26, without significantly impacting MOAB2 or methoxy-X04 brightness levels (Fig. 1G-J). Amyloid deposits were virtually absent in the brains of 2-month-old 5xFAD mice (not a single MOAB2 positive deposit was found after scanning dozens of brain sections from multiple animals) (Fig. S1A-D). As expected, amyloidosis increased astrocyte reactivity revealed by increased GFAP immunoreactive area and brightness (Fig. 1K-L). However, PLX5622 treatment did not impact GFAP intensity or immunoreactive area (when normalized to Aβ burden) in 5-month-old 5xFAD mice (Fig. 1K-M), also consistent with previous reports. PLX5622 treatment had no effect on brain APP protein levels assessed via Western blot using 6E10 antibody (Fig. 1N-O). Finally, neither amyloidosis nor long-term microglia depletion had a significant impact on synaptic density at the time points analyzed, assessed by Western blot on whole cerebrum homogenates using anti-Homer1 (Fig. 1N–P). Given that WAM and DAM are both Trem2-dependent, Trem2 expression levels support the notion that most microglia that survived PLX5622 treatment are WAM/DAM (Fig. 1Q).
For the genetic approach, FIRE mice were crossed with 5xFAD (B6) mice to generate four genotypes: WT, 5xFAD, FIRE, and 5xFIRE mice; male and female mice were harvested at 5 months of age. Elevated microglia reactivity under amyloidosis was evidenced by elevated Trem2 mRNA expression, which was virtually absent (below the limit of detection) in 5xFIRE mice (Fig. 1R).
Amyloidosis and microglial depletion differentially impact brain lipidome and transcriptome
Transformed and scaled lipidomics data from 198 lipid species (normalized to total protein content) were analyzed using partial least squares discriminant analysis (PLS-DA) to compare long-term (5-mo-old) pharmacological and genetic cohorts (complete list see Supplementary Data 1). This analysis revealed clear separations between Non-Tg and 5xFAD groups in both pharmacological (Fig. 2A) and genetic (Fig. 2B) cohorts, indicating distinct amyloidosis-associated lipidomic profiles. Volcano plots from unpaired one-factor analysis identified key lipid species contributing to group differences (Fig. S2A-B). Venn diagram analysis revealed consistent increases in select LPC, LPE, and BMP species under amyloidosis across both cohorts (Fig. S2C).

(A–E) Global lipidomics: Partial least squares discriminant analysis (PLS-DA) plots of brain lipidomes in long-term pharmacological (A) and genetic (B) microglial depletion. Each data point represents one animal, n = 5–8 mice/group. Data normalized by log10 transformation and mean scaling. Volcano plots displaying differentially altered lipid species after microglial depletion in long-term pharmacological (C) and genetic (D) interventions. E Venn diagrams showing overlapping lipid species decreased after microglial depletion in amyloidosis conditions. Statistical analysis for lipidomics data was performed in MetaboAnalyst using multiple pairwise t-testing with false discovery rate correction for multiple comparisons (FDR = 0.05; significance threshold q ≤ 0.05). F–K Targeted transcriptomics: PLS-DA plots showing NanoString transcriptomic profiles in long-term pharmacological (F) and genetic (G) microglia-depleted mice. Each data point represents one animal, n = 4–6 mice/group. Volcano plots displaying differentially expressed genes (DEGs) following microglial depletion in long-term pharmacological (H) and genetic (I) interventions. Species and genes with adjusted p-values ≤ 0.05 and log2 fold changes ≥ 0.25 are highlighted in the volcano plots. J Venn diagrams of shared DEGs downregulated after microglial depletion in amyloidosis conditions. K Bubble plot of the top 10 enriched Gene Ontology (GO) terms using the 16 DEGs identified in panel J. Statistical analysis for RNA profiling was performed using nSolver Advanced Analysis default options with Benjamini-Hochberg correction for multiple comparisons.
Partial microglial depletion via long-term pharmacological treatment induced more pronounced shifts in the brain lipidome, with complete PLS-DA separation between 5xFAD+PLX and 5xFAD groups (Fig. 2A), compared to the partial separation observed with complete genetic ablation (Fig. 2B). Long-term pharmacological microglial elimination increased several lysophospholipid species (Fig. 2C), an effect not seen in the genetic depletion cohort (Fig. 2D). Conversely, genetic microglial depletion uniquely reduced myelin lipids (e.g., ST_N24:1, CBS_N24:1, and SM_N24:1) and energy metabolism-related lipids (CAR_16:1 and CAR_18:1, involved in mitochondrial fatty acid oxidation) (Fig. 2D). Notably, both partial and complete microglial depletion specifically prevented the accumulation of arachidonic acid (20:4)-containing BMP (AA-BMP) (Fig. 2E).
Targeted brain transcriptomic profiling using NanoString analysis revealed distinct gene signatures (complete list see Supplementary Data 2), with clear PLS-DAs separations between groups in both cohorts (Fig. 2F-G). The separation between Non-Tg and 5xFAD samples was more extensive in the pharmacological cohort (the distance between these two genotypes in Fig. 2F is larger than in Fig. 2G), consistent with the more aggressive genetic background. Additionally, 5xFIRE samples were positioned further from Non-Tg than 5xFAD, indicating a greater transcriptomic shift (Fig. 2G). Volcano plots (Fig. S2D-E) highlighted several genes altered among groups in both cohorts. Most DEGs upregulated under amyloidosis in long-term pharmacological (Fig. S2D) and genetic (Fig. S2E) cohorts were inflammatory-related genes and were downregulated by microglial depletion in both cohorts (Fig. 2H, I). Again, the extent of reduction was more dramatic in the genetic cohort. Venn analysis identified 17 genes elevated by amyloidosis in both 5xFAD cohorts (Fig. S2F), functionally linked to lysosomal-related pathways by Gene Ontology (GO) analysis (Fig. S2G). Conversely, Venn analysis identified 16 conserved genes decreased by both microglial depletion approaches (Fig. 2J), which also mapped to lysosomal regulation (Fig. 2K), implicating microglia as primary drivers of lysosomal remodeling in amyloidosis. Consistent with lipidomics data, the AA-BMP species increased under amyloidosis and reduced after microglial depletion aligned functionally with lysosomal pathway modulation, suggesting a role of microglia in controlling lipid-lysosomal crosstalk in the setting of amyloid pathology. As shown in heatmaps (Fig. S3A-B), inflammatory-related pathways were upregulated in both 5xFAD backgrounds relative to Non-Tg controls including pre-defined NanoString Pathways like Microglial markers, Primed Microglia, Stage 1 DAM, Stage 2 DAM, Cytokines, NF-κB Signaling, Complement System, and Inflammasome. These pathways were downregulated following microglial depletion in both cohorts, further validating the effectiveness of both pharmacological and genetic approaches. In 5xFAD + PLX5622 mice, most microglial and inflammatory pathways were largely restored to Non-Tg-like levels, except for partial restoration of Stage 2 DAM, consistent with the partial resistance of DAM to the drug (Fig. S3A). In contrast, these pathways were extensively reduced in 5xFIRE, reaching comparable levels to Non-Tg controls (Fig. S3B).
Microglial depletion prevents amyloidosis-induced lysosomal AA-BMP accumulation
The finding that AA-BMP is the only lipid species altered in both long-term pharmacological (PLX5622) and genetic (FIRE) microglia-deficient cohorts suggests that AA-BMP accumulates primarily in microglia and is likely synthesized and regulated there. To further investigate this, we assessed BMP levels in human AD brains. We performed lipidomic analysis using postmodern human Brodmann area 38 (BA38), a temporal lobe region affected early in AD progression, using samples from 10 non-disease controls and 10 AD cases of both sexes. Human demographic information is presented in Supplementary Table 1. Due to the inherent variability in grey and white matter content in human samples, the grey-to-white matter ratio (GWR) for each sample was calculated based on established lipid species abundances (PE_D18:0-22:6/D18:1-22:5 (grey matter enriched) divided by PE_P18:1-18:1/P18:0-18:2/P16:0-20:2 (white matter enriched) to ensure accurate interpretation of lipidomic data. Metadata heatmap analysis revealed that both sex and GWR were major contributors to sample clustering, so these variables were included as covariates in subsequent analyses (Fig. S4A).
Importantly, abnormal BMP accumulation was detected in postmortem AD brains (Fig. S4B), mirroring trends seen in 5xFAD mouse models (Fig. S4C-D). Specifically, several BMP species (20:4-20:4, 18:1-20:4, and 18:1-22:6) were increased in human AD brains (Fig. 3A-C), while DHA (22:6)-BMP remained unaltered (Fig. 3D). These BMP alterations in human AD brains were well recapitulated in both amyloidosis-bearing mouse brains, where most AA (20:4) and oleic acid (18:1)-containing BMP species accumulated in the context of amyloid pathology (Fig. 3E-G and 3I-K), while DHA (22:6-22:6)-BMP levels remained unaltered (Fig. 3H–L).

A–D Quantification of specific BMP species levels in human postmortem temporal lobe Brodmann area 38 (BA38): comparison of AD vs non-AD controls. Human data normalized by log10 transformation. Statistical analysis was performed in MetaboAnalyst using metadata table module linear model adjusted for sex and gray/white matter ratio (GWR) with false discovery rate correction for multiple comparisons (FDR = 0.05). E–H Levels of corresponding BMP species in mouse brains following long-term pharmacological microglial depletion. Data normalized by square root transformation and pareto scaling. Statistical analysis was performed in MetaboAnalyst using one-factor module t-testing correcting for multiple comparisons (FDR = 0.05). I–L Levels of same BMP species in mouse brains after genetic microglial depletion. Data normalized by log10 transformation. Statistical analysis was performed in MetaboAnalyst using metadata table module linear model adjusted for sex correcting for multiple comparisons (FDR = 0.05). Heatmaps of lysosomal gene expression after long-term pharmacological (M) and genetic (N) microglial depletion. Significantly altered genes denoted: 5xFAD vs Non-Tg (#), and 5xFAD + PLX5622 vs 5xFAD (*) by two-tailed unpaired t-tests with Benjamini-Hochberg correction. Correlations between relative AA-BMP levels and total lysosome gene counts in microglia-depleted mouse brains following long-term pharmacological (O) and genetic (P) interventions. Statistical analysis was performed in MetaboAnalyst using metadata table module linear model regressing relative AA-BMP levels against all NanoString predefined pathways adjusting for multiple correlations (FDR = 0.05, significance threshold q ≤ 0.05). Each data point represents one animal, n = 4-8 mice/group. All data presented as mean ± SEM.
Although total BMP levels did not show marked changes with microglial interventions (Fig. S4C-D), specific BMP species responded differently to microglial depletion. AA-containing BMPs (BMP_20:4-20:4 and BMP_18:1-20:4) decreased following long-term pharmacological (Fig. 3E, F) microglial depletion. In the genetic cohort, BMP_20:4-20:4 was also significantly decreased (Fig. 3I), while similar trends were seen for BMP_18:1-20:4 (Fig. 3J). Docosahexaenoic acid (DHA)-containing BMP (BMP_18:1-22:6) accumulated with amyloidosis but did not decrease with microglial depletion (Fig. 3C, G, and K), and DHA-specific BMP (BMP_22:6-22:6) was unchanged in long-term pharmacological (Fig. 3H) or even increased in genetic (Fig. 3L) cohorts.
Consistently, we also found abnormal upregulation of lysosome-related genes under amyloidosis in both cohorts of 5xFAD mice (Fig. 3M, N). Both long-term pharmacological and genetic microglial depletion largely prevented the abnormal increase of lysosomal gene expression to non-Tg levels. Protein levels of the microglia/macrophage-specific lysosomal marker (CD68) were also upregulated in 5xFAD brains and reduced following long-term pharmacological microglial depletion (Fig. S4E and S4F). As an additional indication of lysosomal function, abnormal hyperglycosylated LAMP1 (110 kDa) induced by amyloidosis was prevented by long-term pharmacological microglial depletion (Fig. S4E and S4H), while normal LAMP1 (75 kDa) remained unaltered (Fig. S4E and S4H), indicating that microglial elimination partially prevented lysosomal impairments. As previously mentioned, BMPs are located in the late endosome/lysosome system, and their levels have been considered an indicator of proper lysosomal function23. As expected, AA-BMPs are highly correlated with expression of lysosomal-related genes (Fig. 3O, P).
Microglial regulation of AA-BMP levels is independent of amyloidosis
Genetic microglial ablation in non-Tg mice led to a reduction in AA-containing BMP species (AA-BMPs) (Fig. S5A and S5B), indicating that AA-BMP metabolism is primarily governed by microglia and does not require amyloidosis-related phagocytic activity. In line with findings from AD-like models, levels of BMP_18:1-22:6 levels remained unchanged (Fig. S5C), while DHA-BMP increased following genetic depletion (Fig. S5D), further supporting the specificity of microglial control over distinct BMP species.
To further validate microglial specificity under physiological and pathological conditions, we assessed the short-term (acute) pharmacological microglial depletion cohort where both Non-Tg and 5xFAD mice were treated with PLX5622 for just two weeks. Shotgun lipidomics revealed a significant treatment effect on total BMP (Fig. S6A). Notably, PLX5622 tended to decrease AA-BMP levels in treated Non-Tg mice, reducing them significantly in treated 5xFAD (Fig. S6B), despite the lack of amyloid deposition at this age (2 months). Collectively, these results demonstrate that microglia regulate AA-BMP levels independently of amyloidosis or disease-associated phagocytic stress.
Microglial progranulin as a putative modulator of AA-BMP
A transcriptional gene network interference study52 suggested that lysosomal function and organization are mediated by the secreted glycoprotein progranulin (PGRN), encoded by the GRN gene. Mutations in GRN are associated with neurodegenerative diseases such as frontotemporal dementia (FTD)53 and amyotrophic lateral sclerosis (ALS)54. Additionally, clinical case studies19 and GWAS55 have also linked GRN to AD, further supporting its relevance in neurodegeneration. In line with previous studies, Grn expression was upregulated in 5xFAD mice relative to Non-Tg controls, while both long-term pharmacological (Fig. 4A) and genetic microglial (Fig. 4B) depletion prevented amyloidosis-induced upregulation of Grn. Similarly, amyloidosis-induced PGRN protein accumulation was largely attenuated by long-term pharmacological microglia depletion (Fig. 4C).

Relative Grn mRNA expression after long-term pharmacological (A) and genetic (B) microglial depletion. Correlation analysis of relative AA-BMP levels with relative Grn mRNA expression in long-term pharmacological (D) and genetic (E) microglial depletion. Relative progranulin protein levels assessed via Western blot (C) were correlated with AA-BMP levels (F). Each data point represents one animal, n = 4-8 mice/group. Statistical analysis was performed in MetaboAnalyst using metadata table module linear model regressing relative AA-BMP levels against all genes with false discovery rate correction for multiple comparisons (FDR = 0.05). Representative immunofluorescence images showing progranulin (PGRN), Iba1 (microglia/macrophages), MOAB-2 (amyloid plaques) and DRAQ5 (nuclei) in non-Tg (G), 5xFAD (H) and 5xFAD + PLX5622 (I). J Quantification of high progranulin intensity, primarily in plaque-associated and activated microglia. Each data point represents a brain section, 1-2 sections from 3 female mice/group were quantified. All data presented as mean ± SEM, normalized to non-Tg controls. Statistical analysis was performed in GraphPad using ordinary one-way ANOVA with Tukey’s post hoc correction.
Recent studies have demonstrated that Grn knockout mice exhibit a loss of BMP in the brain56, highlighting progranulin’s role in regulating BMP metabolism. In line with these findings, progranulin mRNA and protein levels were found to correlate strongly with AA-BMP levels in both cohorts (Fig. 4D-F). Within the brain, progranulin is highly expressed by microglia and neurons57. Immunofluorescence studies confirmed this cellular distribution, showing PGRN signal co-staining with multiple microglial and neuronal markers. PGRN immunofluorescence signals were highest within reactive disease-associated microglia (DAM) surrounding amyloid plaques revealed by co-staining PGRN with Iba1 (Fig. S7A) and CD68 (Fig. S7B) in 5xFAD brains, including those treated with PLX5622, which still displayed plaques and DAM. To further confirm the DAM-like phenotype of microglia surrounding amyloid plaques in the 5xFAD and 5xFAD + PLX5622 groups, we co-stained PGRN with P2Y12 (homeostatic microglia) and Clec7a (reactive microglia). Most microglia resistant to PLX5622 were positive for Iba1, P2Y12, CD68, and Clec7a (Fig. S7C). Long-term microglial elimination reduced plaque-associated PGRN accumulation (Fig. 4G-J), almost certainly due to the concomitant decrease in amyloid plaques and surrounding microglia (Fig. 1E-J). Plaque-associated PGRN staining was highly reminiscent of PANTHOS, petal-like blebs surrounding dense-core plaques58.
Microglia do not drive abnormal amyloid-induced lysophospholipids accumulation
In addition to BMP, the two most abundant lysophospholipids -lysophosphatidylcholine (LPC) and lysophosphatidylethanolamine (LPE)- are altered in amyloidosis and/or following microglial depletion. Lysophospholipids have been proposed as biomarkers of AD, as they consistently accumulate in human brains and multiple AD mouse models6,34,59,60,61,62. While these accumulations are linked to neuroinflammation, the primary cellular source of lysophospholipid production in the brain remains unclear.
LPC is generated via phospholipase A2-mediated cleavage of phosphatidylcholine, a major membranes component. Saturated (SFA) and monounsaturated (MUFA) LPC species are considered pro-inflammatory, promoting chemotactic factor secretion and reactive oxygen species (ROS) production63,64,65,66. In contrast, polyunsaturated (PUFA) LPC species, such as LPC_22:4 and LPC_22:6, exhibit anti-inflammatory effects counteracting SFA-LPC driven inflammation66,67,68. In this study, total LPC levels were elevated in human AD brains (Fig. 5A) and in amyloidosis models (Fig. 5B-C), driven by increases in multiple LPC species (Fig. S8A-C). Long-term pharmacological or genetic microglial depletion under amyloidosis had no effects on total LPC (Fig. 5B, C). However, genetic depletion (5xFIRE) specifically reduced PUFA-LPC (LPC_22:6) (Fig. S8C), suggesting diminished anti-inflammatory regulation. These findings indicate that amyloidosis promotes pro-inflammatory LPC accumulation independently of microglia.

Quantification of total lysophosphatidylcholine (LPC) levels in human AD and control brains (A), long-term pharmacological (B) and genetic (C) microglial-depletion cohorts. Data normalized by square root transformation and pareto scaling (A and B), or by cube root transformation and auto scaling (C). Each data point represents one subject, n = 5-10 subjects/group. Statistical analysis was performed in MetaboAnalyst using metadata table module linear model adjusted for sex and GWR with false discovery rate correction for multiple comparisons (FDR = 0.05) (A) and ordinary one-way ANOVA with Tukey’s post hoc correction (B and C) on raw values. D Top three genes significantly correlated with LPC levels in long-term pharmacological (top) and genetic (bottom) microglia-depletion cohorts with false discovery rate correction for multiple comparisons (FDR = 0.05). E Venn diagram showing overlap of genes correlated with LPC levels between cohorts. Correlation plots of LPC levels and NanoString Astrocyte Markers Pathway Scores in long-term pharmacological (F) and genetic (G) microglia-depleted cohorts. Statistical analysis was performed in MetaboAnalyst using multiple linear regressions adjusting for multiple correlations (FDR = 0.05). H Western blot analysis of GFAP protein levels (top) and corresponding quantification (bottom) in the long-term pharmacological cohort. Statistical analysis was performed in GraphPad using ordinary one-way ANOVA with Tukey’s post hoc correction. Each data point represents one animal, n = 5-8 mice/group. I Correlation plot of LPC levels and relative GFAP protein levels in the long-term pharmacological cohort. Statistical analysis was determined using multiple linear regressions with false discovery rate correction for multiple comparisons (FDR = 0.05). Data presented as mean ± SEM.
To gain insights into the mechanisms underlying amyloidosis-induced LPC accumulation, we first investigated phospholipase A2 (PLA2), which cleaves PC to generate LPC. Increased PLA2 activity has been reported in the brains of AD patients and animal models, including a previous study from our group where we observed increased phosphorylated (activated) calcium-dependent (cPLA2) and -independent (iPLA2) isoforms34. Consistent with these studies, amyloidosis increased cPLA2 phosphorylation, which was unchanged upon microglial depletion (Fig. S8D and S8E). In contrast, iPLA2 showed no response to amyloidosis or PLX5622 treatment (Fig. S8F). We next performed correlation analyses between total LPC levels and individual gene changes under different conditions. The top three positively correlated genes in both long-term pharmacological and genetic cohorts were astrocytic (Fig. 5D). Further correlation analyses revealed strong correlations between LPC and the NanoString Astrocyte Markers predefined pathway in both cohorts (Fig. 5F, G). Unbiased screening of NanoString Pathways identified additional significant correlations (p < 0.05, R2 > 0.4) with JAK-STAT signaling (Fig. S9C and G) and cytoskeletal dynamics (Fig. S9D and H), both linked to astrocyte activation. Notably, Gfap was the only individual gene positively correlated with LPC in both cohorts (Fig. 5E). Consistent with this, Gfap mRNA levels (Fig. S9A and E) correlated with LPC in both pharmacological (Fig. S9B) and genetic (Fig. S9F) cohorts. GFAP protein levels were significantly elevated in 5xFAD mice and trended higher in 5xFAD + PLX5622 (Fig. 5H) with strong correlations between LPC and GFAP protein (Fig. 5I). These results suggest LPC accumulation in amyloidosis is regulated by astrocytes rather than microglia.
The other primary lysophospholipid class, LPE, is produced by cleavage of phosphatidylethanolamine—a major constituent of cell inner membranes and intracellular organelle membranes. LPE regulates calcium signaling69, exhibits anti-apoptotic activity, and enhances neuronal differentiation and migration70. However, abnormal LPE is also linked to oxidative stress71,72. In this study, total LPE levels were consistently elevated in human AD brains (Fig. 6A) and mouse models of amyloidosis (Fig. 6B-C) with species-specific patterns (Fig. S10A-C).

A Quantification of total lysophosphatidylethanolamine (LPE) levels in human AD and control brains. Data normalized by square root transformation and pareto scaling. Statistical analysis was performed in MetaboAnalyst using metadata table module linear model adjusting for sex and gray/white matter ratio (GWR). Total LPE levels in long-term pharmacological (B) and genetic (C) microglial-depletion mouse cohorts. Data normalized by square root transformation and pareto scaling (B) or cube root transformation and auto scaling (C). Statistical analysis was performed in GraphPad using ordinary one-way ANOVA with Tukey’s post hoc correction. Each data point represents one subject, n = 5-10 subject/group. D Western blot analysis of Nrf2 protein levels (top) and corresponding quantification (bottom). Each data point represents one animal, n = 5-8 mice/group. E Correlation plots showing negative correlation between LPE and Nrf2 protein levels. NanoString Apoptosis Pathway Scores in long-term pharmacological (F) and genetic (G) microglial-depletion mouse brains. Each data point represents one animal, n = 4-6 mice/group. Statistical significance was determined using ordinary one-way ANOVA with Tukey’s post hoc correction. Data presented as mean ± SEM.
Surprisingly, partially eliminating microglia with long-term PLX5622 treatment under amyloidosis exacerbates LPE accumulation (Fig. 6B), particularly non-plasmalogen LPE species (Fig. S10B), which can be generated following plasmalogen (vinyl-ether bond) cleavage under ROS attack73,74. A previous study showed that the 4-HNE-adducted proteins were markedly increased in 5xFAD mice indicating increased oxidative stress, and returned to normal levels after blocking lipid peroxidation71. Intriguingly, this trend perfectly aligned with total LPE, but not LPC, levels, suggesting a strong role of oxidative stress in inducing LPE accumulation. Although, in this study, we didn’t find direct evidence of increased oxidative stress contributing to LPE accumulation by measuring the 4-HNE-adducted proteins (Figs. S10D-E) and 4-HNE lipid contents (Fig. S10F); the major antioxidant regulator, Nrf2, was decreased after pharmacological microglial elimination (Fig. 6D) and negatively correlated with LPE levels (Fig. 6E), suggesting there may be a weaker antioxidant response after microglial elimination. Plasmalogen-containing PE/LPE might serve as a potent antioxidant. In contrast to what was observed in the long-term pharmacological cohort, genetic depletion of microglia showed no additional boost of LPE under amyloidosis (Fig. S10C). We attempted to find specific genes or pathways that correlated with LPE levels in both long-term pharmacological and genetic cohorts but could not find any, while we were able to rule out the contribution of cellular apoptosis (Fig. 6F) in both cohorts. Intriguingly, we found that complete microglial removal in the absence of amyloidosis leads to abnormal accumulations of LPC (Fig. S5E) and LPE (Fig. S5F) in the genetic cohort.
In the short-term pharmacological microglial depletion condition, amyloidosis-induced LPC and LPE accumulations were not observed, likely because only limited pathology develops as early as 8 weeks. Similarly, a 2-week microglial elimination treatment did not impact LPC and LPE levels (Fig. S6C-D). Taken together, our results strongly suggest that LPC and LPE accumulation in AD is not primarily driven by microglia.
Microglial depletion led to alterations in myelin lipids
The effects on some lipid classes differed between pharmacological and genetic depletion. Under amyloidosis, genetic depletion significantly reduced myelin lipids, including cerebroside (Fig. S11A) and sulfatide (Fig. S11B), both structural glycosphingolipids critical for myelin integrity75. These reductions were absent in FIRE mice relative to non-transgenic mice (Fig. S11C and S11D). In pharmacological cohorts, long-term depletion showed only mild decreasing trends (Fig. S11E and S11F), whereas short-term PLX5622 treatment induced a significant sulfatide reduction (Fig. S6E) and a trending decrease in cerebroside (Fig. S6F). These reductions mirror deficits observed in AD and other neurodegenerative diseases, linking microglial dysfunction to myelin lipid dysregulation in pathological contexts76,77.
Discussion
Recent studies have extensively investigated the impact of microglia on AD-associated pathologies25,26,27,28,30,31. However, the role of microglia as potential regulators of brain lipid metabolism remains understudied. Considering the numerous lipid alterations observed at the early stages of AD9,10,11,12 and the accumulating evidence of microglia’s central role in AD pathogenesis, we assessed the effects of microglial depletion on brain lipid metabolism under AD-like conditions. Using multi-dimensional mass spectrometry-based shotgun lipidomics, we identified specific lipid abnormalities in the brains of AD patients and animal models that are either fully driven by microglia or occur independently of these brain-resident macrophages. The schematic (Fig. 7) summarizes the conserved lipid changes in response to amyloidosis and to microglial depletion across both pharmacological and genetic cohorts.

This schematic summarizes alterations in major lipid classes observed in mouse brain tissue under amyloid pathology (top brain quadrants) and after microglial depletion (right brain quadrants), consistent across both pharmacological (PLX5622-treated) and genetic (FIRE) cohorts. Insets illustrate key lipid metabolic pathways: lysophosphatidylcholine (LPC), lysophosphatidylethanolamine (LPE), and arachidonic acid-specific bis(monoacylglycero)phosphate (AA-BMP) are increased under amyloidosis; microglial depletion results in decreased AA-BMP. Colors indicate the direction of change (red: increased; blue: decreased). The central diagram illustrates experimental conditions and main pathological/cellular features. Arrows indicate major metabolic pathways—including synthesis and degradation—connecting lipid species. Central brain schematic symbols represent resting microglia, activated microglia, dense core amyloid plaques, and diffuse plaques, as distinguished by their respective shapes and colors. Schematic created in BioRender. Xu, Z. (2025) https://BioRender.com/2ydgf4r.
BMP is an emerging phospholipid class involved in endo/lysosomal function that accumulates in a number of lysosomal disorders78. Recent independent studies using progranulin (Grn)-deficient mice, a model of PGRN loss-of-function mutations that cause frontotemporal dementia, found that PGRN depletion significantly reduces BMP levels, impairing lysosomal metabolism56,79. Specifically, PGRN binds BMP under acidic lysosomal conditions, stabilizing its levels to facilitate ganglioside catabolism. In our amyloidosis model, the observed parallel increases in PGRN and AA-BMP may reflect a compensatory mechanism to enhance lysosomal clearance of amyloid-associated lipid perturbations. In addition, research in Grn-/- mice demonstrates that PGRN loss exacerbates lysosomal dysfunction and neuroinflammation, while PGRN supplementation rescues BMP losses and prevents associated lysosomal disorders56. This aligns with our finding that microglial depletion reduces both PGRN and AA-BMP, suggesting a feedback loop where PGRN modulates BMP to maintain lipid equilibrium in amyloid-laden environments. Our data strongly support a model where increased BMP levels, particularly AA-BMPs, in the context of amyloidosis, are associated with increased microglial lysosome (dys)function and PGRN levels. Supporting this model, our pharmacological and genetic intervention studies demonstrated that partial or complete depletion of microglia prevents amyloidosis-induced AA-BMP accumulation. We also found a positive correlation between AA-BMP levels, the expression of lysosomal genes, the protein content of a microglia/macrophage-specific lysosomal marker (CD68), and microglial PGRN RNA and protein levels. Amyloid-β may drive both PGRN and AA-BMP increases as part of a generalized lysosomal response. However, our data extend this paradigm by showing that microglia-specific PGRN localization near plaques correlates with AA-BMP accumulation, implicating a spatially coordinated mechanism.
Lysophospholipids have long been considered markers of neuroinflammation63,64,65,66. Since microglia are the major drivers of neuroinflammation, we hypothesized that they would be major generators of lysophospholipids, especially in a pathological context. Surprisingly, our study found that microglial depletion does not reduce the two major lysophospholipid classes (i.e., LPC and LPE) under either physiological or AD pathological conditions. Unbiased correlation analyses revealed that LPC content highly correlates with astrocytic gene expression pathways. These results align with the established inflammatory role of LPCs, as astrocytes are also known to be major players in neuroinflammatory responses. LPC accumulated under amyloidosis conditions, including in the brains of AD subjects and two cohorts of 5xFAD transgenic mice with different genetic backgrounds. However, pharmacological and genetic microglial depletion had no impact on LPC levels, if anything, LPC levels tended to increase. Similarly, microglial elimination did not ease astrocyte activation. These results suggest that LPC accumulation under amyloidosis conditions is primarily driven by astrocyte activation. We identify the calcium-dependent cPLA2 as the presumptive PLA2s responsible for the observed additional increases in LPC content after microglial deletion, due to its paralleled changes at the whole cerebrum level. We cannot rule out the possibility that some other PLA2 is responsible for LPC changes since we have not tested the entire list of lipases. In addition, certain lysophospholipid transporters (e.g., Mfsd2a80 which transports lysophospholipids into the brain) or lysophospholipid acyltransferases81 (converting lysophospholipids back into phospholipids) could also be responsible for these LPC level changes. These hypotheses should be further validated with future single-cell studies or astrocyte-specific manipulation studies. In addition, since both the amyloidosis and microglial elimination alone increase LPC levels in the genetic cohort, and 5xFIRE condition did not lead to an additive increase beyond the amyloidosis effect, this suggests that microglial elimination and amyloidosis may increase LPC through a shared pathway, likely astrogliosis.
Microglial depletion, whether induced pharmacologically or genetically, did not reduce the elevated LPE levels in amyloid-bearing brains. On the contrary, long-term PLX5622 treatment further increased LPE content in 5xFAD mice, which was not observed in the genetic cohort. These increases in LPE are likely a consequence of either increased oxidative stress or increased PE cleavage by phospholipases. Given that increases are most dramatic in PUFA-containing sn-2 acyl LPE, oxidative stress seems to be the most likely explanation72. Notably, a recent study demonstrated that PLX5622 has off-target effects on brain vasculature by altering endothelial cholesterol metabolism80. Our pathway analysis of genes negatively correlated with LPE levels identified angiogenesis as the most significant GO term. There appears to be a link between endothelial cholesterol metabolism and angiogenesis, mediated by VEGF81. Furthermore, oxidative stress, which inhibits VEGF signaling, is known to regulate angiogenesis81. Thus, supported by lipidomics data, our study suggests that PLX5622-induced LPE accumulation could be a consequence of its off-target effect on brain vasculature that may induce increases in ROS. On the other hand, unbiased correlation analyses between gene expression levels and LPE content revealed a positive correlation with Wnt signaling in the pharmacological cohort, where the strongest effects on LPE levels were observed. Among the genes that NanoString catalogs into Wnt signaling, most are neuronal-enriched. Wnt signaling is a prominent pathway at the synapse and is required for synaptic plasticity and maintenance in the adult brain, suggesting that LPE increases in the AD brain may also be driven by neurons, potentially by high neuronal oxidative stress. It has been shown that certain levels of oxidative stress can promote canonical Wnt signaling and retinal cell formation and migration82. The ROS-associated LPE accumulation and upregulated Wnt signaling observed in this study after microglial elimination might suggest a positive role of PE, particularly plasmalogen PE, in protecting from oxidative stress and maintaining synaptic function. Plasmalogens contain a vinyl-ether bond, making them effective endogenous antioxidants. This correlation agrees with our observation that PLX5622-treated 5xFAD mice had comparable levels of synaptic markers to 5xFAD mice, as previously reported28. In the genetic cohort, while microglial depletion does not impact LPE levels in the presence of amyloidosis, we observed a significant accumulation of LPE in amyloid-free brains with microglial depletion. This suggests that the presence of amyloidosis can mitigate some of the LPE-accumulating effects caused by microglial depletion.
The effects of microglia in promoting developmental neurogenesis and myelination by pruning excessive synapses and myelin sheaths are well recognized83,84. Microglia also have essential roles in clearing myelin debris and maintaining lifelong remyelination85. However, the impact of microglia in regulating adult myelin homeostasis is still underappreciated. As essential components of the myelin sheath, changes in myelin lipid levels likely indicate impaired myelin integrity. In this study, long-term partial removal of microglia under amyloidosis did not appear to cause myelin impairment, as myelin-specific/enriched lipids, i.e., cerebrosides and sulfatides, showed no statistical difference after treatment. Complete removal of microglia through genetic depletion under non-amyloidosis conditions had no impact on myelin lipids, while under amyloidosis conditions it led to a significant reduction in myelin lipids. Similarly, short-term PLX5622 treatment (which led to an almost complete elimination) also resulted in a significant loss of myelin lipids in 5xFAD but not in Non-Tg mice. These results rule out major developmental defects in myelin lipid homeostasis caused by microglia depletion and suggest the losses are likely a consequence of the combined effects of amyloid toxicity and microglia ablation. Our results suggest that microglia may play an essential role in adult myelin maintenance/remyelination, particularly under pathological conditions where toxic Aβ progressively disrupts oligodendrocytes, eventually leading to myelin disruption. Interestingly, long-term PLX5622 treatment resulted in a less extensive reduction of P2Y12+ microglia, with the vast majority of remaining microglia being DAM/WAM. Given that myelin lipids were not significantly decreased following long-term treatment in 5xFAD, it is likely that DAM/WAM protect myelin by phagocytosing myelin debris and promoting remyelination. In fact, the deficiency of microglia seems to accelerate the disruption of myelin that would normally occur at later stages in 5xFAD mice. More comprehensive future studies are needed to decipher the relationship between microglia and myelin maintenance.
Lastly, despite a significant overlap and agreement between our pharmacological and genetic mouse cohorts, particularly when comparing lipidomics and RNA profiling data between WT and 5xFAD mouse brains, we noticed that the magnitude of the effects tended to be stronger in the pharmacological cohort. This is likely due to the different genetic backgrounds used. It is well-established that 5xFAD mice develop Aβ pathology faster and more dramatically in the B6SJL background (pharmacological cohort) compared to B6 (genetic cohort), and that females develop a more aggressive pathology than males. In addition, the two cohorts were housed in different facilities (UTHSCSA and UCI), meaning they were exposed to different environments.
Methods
Study design and approval
Human Brodmann area 38 samples were provided by the NIH NeuroBioBank (Case #481, JPP and XH), all 20 samples assessed in this study were obtained from a single site, i.e., the Human Brain and Spinal Fluid Resource Center (Los Angeles, CA). The repository operates under IRB approval PCC#: 2015-060672, VA Project #: 0002, granted by the Department of Veterans Affairs – Los Angeles. Informed consent for tissue donation was obtained by the tissue bank from all donors or their legal representatives, in accordance with institutional and federal guidelines. No direct interaction with human subjects occurred in this study. All cases, except for one, were handled by the same neuropathologist (Roscoe Atkinson, MD). Frozen human BA38 samples were kept in a −80 °C freezer for storage upon receipt and were lyophilized prior to processing them for lipidomics. Both sexes were included in the analysis. No samples were excluded.
For animal studies, experiments were performed in accordance with the guidelines approved by the Institutional Animal Care and Use Committee (IACUC) of the University of Texas Health San Antonio (UT Health SA) under the protocol 20190078AP (JPP) and the University of California, Irvine. No data were excluded, all figures include all samples processed. Animals and other experimental units were assigned randomly to the experimental groups. The sample size for in vivo experiments was based on power calculations and our previous research experience.
Mice
5xFAD mice (Tg(APPSwFlLon,PSEN1*M146L*L286V)6799Vas/Mmjax), were obtained from the Mutant Mouse Resource and Research Center (MMRRC) at The Jackson Laboratory in two different genetic backgrounds (B6SJL: MMRRC_034840-JAX; and C57BL6: MMRRC_034848-JAX). Mice were housed under 12/12 h light/dark cycles with free access to food and water ad libitum. Only female mice were used for the pharmacological (PLX5622-treated) partial microglial elimination cohorts and both male and female mice were used for the genetic (FIRE) full microglial elimination cohort.
For the long-term pharmacological group, 1200 mg of PLX5622 (free base)/kg was added to OpenStandard Diet (OSD) with 15 kcal% fat (Research diets, INC., New Brunswick, NJ, USA). Control mice were fed with OSD, and experimental mice with OSD + PLX5622 from 6 weeks of age until 5 months when tissues were harvested. For the short-term pharmacological group, 1,200 mg of PLX5622 (free base)/kg was added to OpenStandard Diet (OSD) with 15 kcal% fat (Research diets, INC., New Brunswick, NJ, USA). Control mice were fed with OSD, and experimental mice with OSD + PLX5622 from 6 weeks of age until 8 weeks when tissues were harvested. Csf1r(ΔFIRE/ΔFIRE) mice were generated as previously described24,30.
At the time of collection, animals displayed no apparent health issues. Specifically, they were active, maintained good grooming habits, and had normal weight and activity levels. Prior to sacrifice, the liver, lungs, and heart were inspected, and all appeared healthy.
Brain preparation
For histological analysis, mice were anesthetized with isoflurane and perfused with PBS 1X for 4 minutes. Left hemibrains were post-fixed in 4% PFA overnight and placed in 10%, 20%, and 30% sucrose solution subsequently, followed by Tissue-Tek® O.C.T. (Sakura Finetek USA, Inc., Torrance, CA, USA) embedding using dry-ice cold isoflurane. Serial 10 μm coronal sections of the brain were collected, the hippocampus was used as a landmark. 2 brain sections from 3 animals per group were quantified (approx. Bregma −2).
Mouse right hemi-cerebra were dissected out, placed in cryotubes, and flash-frozen in liquid nitrogen. Frozen brains were lyophilized using a benchtop freeze dryer (Labconco, Kansas City, MO, USA) under 0.5 vacuum for 48 hours. Lyophilized brain samples were weighted and transferred to Precellys 0.5 ml tubes pre-filled with small beads. Dried tissues were powdered using Precellys® Evolution Tissue Homogenizer (Bertin technologies, Montigny-le-Bretonneux, France) through one round of manufacture’s “soft program” at 0 °C. Powdered dry cerebrum tissues were weighted and split for lipidomics ( ~5 mg), RNA profiling ( ~4 mg), and Western blotting ( ~10 mg) using disposable anti-static spatulas.
Lipidomics analysis
Lipidomics analysis was conducted using multi-dimensional mass spectrometry-based shotgun lipidomics (MDMS-SL) following previously described protocols86. Briefly, dried and powdered tissues were homogenized in 0.1X PBS. Protein concentrations were measured using a bicinchoninic acid (BCA) assay. Lipid extraction from the homogenates, standardized by protein content, employed a modified Bligh and Dyer procedure with added internal standards. Lipid quantification was achieved using triple-quadrupole and orbitrap mass spectrometers (Thermo Fisher Scientific, Waltham, MA, USA), both coupled with a Nanomate device (Advion, Ithaca, NY, USA) and controlled by the Xcalibur system87. Data processing, including ion peak selection, baseline correction, data transfer, peak intensity comparison 13C deisotoping, and quantitation, was facilitated by a custom-programmed Microsoft Excel macro as previously described88, ensuring accurate analysis of lipid molecular species. BMP derivatization and measurement were previously described89. Raw lipidomics data was uploaded in Metabolomics Workbench90, which can be accessed via: https://doi.org/10.21228/M8DR87, under study ID# ST004057.
Gene expression analysis
Dried and powdered brain samples underwent RNA extraction using the Maxwell® RSC simplyRNA Tissue Kit. RNA concentration was measured with Qubit RNA BR Assay Kit and RNA Integrity (RIN) was assessed using a TapeStation 4150 and RNA ScreenTape. Subsequently, the multiplex gene expression analysis was conducted using Glial Profiling and Metabolic Pathways Panels and the NanoString nCounter® Technology and nCounter® SPRINT™ Profiler (NanoString Technologies, Seattle, WA, USA). Data processing was performed using the NanoString nSolver 4.0 software, incorporating background reduction based on the average of the Negative Controls, along with standard normalization through Positive Control Normalization and CodeSet Content Normalization techniques. Relative gene expression was calculated after normalization by housekeeping genes. GEO accession code: GSE278634.
Western blotting
Dried and powdered brain samples were homogenized in 1X NP40 lysis buffer with Halt Protease and Phosphatase Inhibitor Cocktails (Thermo Fisher Scientific, Waltham, MA, USA) using Precellys® Evolution Tissue Homogenizer (Bertin technologies, Montigny-le-Bretonneux, France). Homogenates were centrifuged at 12,000 g for 30 min at 4 °C; the protein concentration of supernatants was determined using the Bio-Rad protein assay (Bio-Rad, Hercules, CA, USA). Supernatants were run with NuPage 4–12% Bis-Tris gels (Life Technologies, Grand Island, NY, USA) under reducing conditions. PageRuler Plus Prestained Protein Ladder (Thermo Fisher Scientific, Waltham, MA, USA) was used as indicator. PVDF membranes (CliniSciences, Nanterre, France) with the transferred protein were incubated with primary antibodies of anti-6E10 (1:1000, BioLegend, catalog# 803001), anti-Homer1 (1:1000, CST, catalog# 8231S), anti-CD68 (E307V) (1:2000, CST, catalog# 97778S), anti-LAMPl (1D4B) (1:1000, Thermo Fisher, catalog# 14-1071-85); anti-4HNE (12F7) (1:1000, Thermo Fisher, catalog# MA5-27570), anti-PGRN (1:500, R&D, catalog# AF2557), anti-Phospho-PLA2G4A (Ser505) (1:3000, Proteintech, catalog# 28925-1-AP), anti-iPLA2 (D-4) (1:1000, Santa Cruz, catalog# SC376563), anti-Nrf2 (1:1000, Abcam, catalog# ab31163), anti-GFAP (1:1000, Thermo Fisher, catalog# PA1-10019), anti-GAPDH (1:5000, CST, catalog# 2118S) overnight at 4 °C, followed by horseradish peroxidase (HRP)-linked secondary antibodies (Cell Signaling Technology, Boston, MA, USA) for 1 h at room temperature. Pierce™ ECL Western Blotting Substrate was used for protein detection followed by autoradiography film exposure (HyBlot CL). A subset of these PVDF membranes underwent a reblotting process with a stripping buffer (Thermo Fisher Scientific, Waltham, MA, USA). Protein expression levels were quantified utilizing ImageJ software normalized relative to GAPDH expression.
Immunofluorescence staining
Frozen brain slices were blocked using 10% normal goat serum (Sigma, USA) for 1 h at room temperature, then incubated with the following primary antibodies: anti-Iba1 (1:1000, FUJIFILM Wako, catalog# 019-19741), anti-PGRN (1:250, R&D, catalog# AF2557), anti-MOAB-2 (1:1000, MilliporeSigma, catalog# MABN254), anti-GFAP (1:2000, MilliporeSigma, catalog# AB5541), DRAQ5 (1:1000, CST, catalog# 4084S), anti-NeuN (1:1000, MilliporeSigma, ABN90P), anti-Clec7a (1:100, InvivoGen, catalog# mabg-mdect), anti-Tmem119 (1:100, Abcam, catalog# AB209064), anti-BACE1 (1:500, CST, catalog# 5606S), anti-P2Y12 (1:1000, CST, catalog# 69766S) at 4 °C overnight, washed three times, then incubated with fluorescence-labeled Alexa Fluor secondary antibodies (Invitrogen, USA) 1 h at room temperature; washed three times, and mounted with DAPI. Images were captured with a confocal laser-scanning microscope (Zeiss LSM710, USA) or Fluorescence Microscope BZ-X800 (KEYENCE, Japan).
Statistics
Data in the figures are presented as mean ± SEM. All the statistical analyses for gene transcript counts from Nanostring were performed using the NanoString nSolver recommended test (heteroscedastic Welch’s t-test). All other statistical analyses were performed using Prism (GraphPad) and MetaboAnalyst (https://www.metaboanalyst.ca/). Specific tests and multiple comparison corrections performed are specified in the figure legends. Covariates for human data were selected via MetaboAnalyst’s metadata correlation heatmap.
Reporting summary
Further information on research design is available in the Nature Portfolio Reporting Summary linked to this article.
Data availability
The authors declare that the data supporting the findings of this study are available within the paper and its Supplementary Information files. Source data are provided with this paper. NanoString data are accessible in GEO under accession code GSE278634. Lipidomics data are accessible in Metabolomics Workbench (https://doi.org/10.21228/M8DR87, under study ID# ST004057). Should any raw data files be needed in another format they are available from the corresponding author upon request. Source data are provided with this paper.
References
-
Winblad, B. et al. Defeating Alzheimer’s disease and other dementias: a priority for European science and society. Lancet Neurol. 15, 455–532 (2016).
-
Mosher, K. I. & Wyss-Coray, T. Microglial dysfunction in brain aging and Alzheimer’s disease. Biochem Pharm. 88, 594–604 (2014).
-
Udeochu, J. C., Shea, J. M. & Villeda, S. A. Microglia communication: Parallels between aging and Alzheimer’s disease. Clin. Exp. Neuroimmunol. 7, 114–125 (2016).
-
Chen, G. F. et al. Amyloid beta: structure, biology and structure-based therapeutic development. Acta Pharm. Sin. 38, 1205–1235 (2017).
-
Bok, E. et al. Role of the Lipid Membrane and Membrane Proteins in Tau Pathology. Front Cell Dev. Biol. 9, 653815 (2021).
-
Chan, R. B. et al. Comparative lipidomic analysis of mouse and human brain with Alzheimer disease. J. Biol. Chem. 287, 2678–2688 (2012).
-
Grosgen, S., Grimm, M. O., Friess, P. & Hartmann, T. Role of amyloid beta in lipid homeostasis. Biochim Biophys. Acta 1801, 966–974 (2010).
-
Ferre-Gonzalez, L., Lloret, A. & Chafer-Pericas, C. Systematic review of brain and blood lipidomics in Alzheimer’s disease mouse models. Prog. Lipid Res 90, 101223 (2023).
-
Kaya, I. et al. Novel Trimodal MALDI Imaging Mass Spectrometry (IMS3) at 10 mum Reveals Spatial Lipid and Peptide Correlates Implicated in Abeta Plaque Pathology in Alzheimer’s Disease. ACS Chem. Neurosci. 8, 2778–2790 (2017).
-
Kaya, I. et al. Delineating Amyloid Plaque Associated Neuronal Sphingolipids in Transgenic Alzheimer’s Disease Mice (tgArcSwe) Using MALDI Imaging Mass Spectrometry. ACS Chem. Neurosci. 8, 347–355 (2017).
-
Han, X. et al. Substantial sulfatide deficiency and ceramide elevation in very early Alzheimer’s disease: potential role in disease pathogenesis. J. Neurochem 82, 809–818 (2002).
-
Blanchard, J. W. et al. APOE4 impairs myelination via cholesterol dysregulation in oligodendrocytes. Nature, https://doi.org/10.1038/s41586-022-05439-w (2022).
-
Grimm, M. O. et al. Regulation of cholesterol and sphingomyelin metabolism by amyloid-beta and presenilin. Nat. Cell Biol. 7, 1118–1123 (2005).
-
Bellenguez, C. et al. New insights into the genetic etiology of Alzheimer’s disease and related dementias. Nat. Genet 54, 412–436 (2022).
-
Kunkle, B. W. et al. Genetic meta-analysis of diagnosed Alzheimer’s disease identifies new risk loci and implicates Abeta, tau, immunity and lipid processing. Nat. Genet 51, 414–430 (2019).
-
Jonsson, T. et al. Variant of TREM2 associated with the risk of Alzheimer’s disease. N. Engl. J. Med 368, 107–116 (2013).
-
Guerreiro, R. et al. TREM2 variants in Alzheimer’s disease. N. Engl. J. Med 368, 117–127 (2013).
-
Sims, R. et al. Rare coding variants in PLCG2, ABI3, and TREM2 implicate microglial-mediated innate immunity in Alzheimer’s disease. Nat. Genet 49, 1373–1384 (2017).
-
Perry, D. C. et al. Progranulin mutations as risk factors for Alzheimer disease. JAMA Neurol. 70, 774–778 (2013).
-
Venegas, C. et al. Microglia-derived ASC specks cross-seed amyloid-beta in Alzheimer’s disease. Nature 552, 355–361 (2017).
-
Yang, I., Han, S. J., Kaur, G., Crane, C. & Parsa, A. T. The role of microglia in central nervous system immunity and glioma immunology. J. Clin. Neurosci. 17, 6–10 (2010).
-
Elmore, M. R. et al. Colony-stimulating factor 1 receptor signaling is necessary for microglia viability, unmasking a microglia progenitor cell in the adult brain. Neuron 82, 380–397 (2014).
-
Hume, D. A. et al. Phenotypic impacts of CSF1R deficiencies in humans and model organisms. J. Leukoc. Biol. 107, 205–219 (2020).
-
Rojo, R. et al. Deletion of a Csf1r enhancer selectively impacts CSF1R expression and development of tissue macrophage populations. Nat. Commun. 10, 3215 (2019).
-
Sosna, J. et al. Early long-term administration of the CSF1R inhibitor PLX3397 ablates microglia and reduces accumulation of intraneuronal amyloid, neuritic plaque deposition and pre-fibrillar oligomers in 5XFAD mouse model of Alzheimer’s disease. Mol. Neurodegener. 13, 11 (2018).
-
Spangenberg, E. et al. Sustained microglial depletion with CSF1R inhibitor impairs parenchymal plaque development in an Alzheimer’s disease model. Nat. Commun. 10, 3758 (2019).
-
Shi, Y. et al. Microglia drive APOE-dependent neurodegeneration in a tauopathy mouse model. J. Exp. Med 216, 2546–2561 (2019).
-
Spangenberg, E. E. et al. Eliminating microglia in Alzheimer’s mice prevents neuronal loss without modulating amyloid-beta pathology. Brain 139, 1265–1281 (2016).
-
Romero-Molina, C. et al. Should We Open Fire on Microglia? Depletion Models as Tools to Elucidate Microglial Role in Health and Alzheimer’s Disease. Int. J. Mol. Sci. 22, https://doi.org/10.3390/ijms22189734 (2021).
-
Kiani Shabestari, S. et al. Absence of microglia promotes diverse pathologies and early lethality in Alzheimer’s disease mice. Cell Rep. 39, 110961 (2022).
-
Jay, T. R. et al. Disease Progression-Dependent Effects of TREM2 Deficiency in a Mouse Model of Alzheimer’s Disease. J. Neurosci. 37, 637–647 (2017).
-
Michael, J. et al. Microglia depletion diminishes key elements of the leukotriene pathway in the brain of Alzheimer’s Disease mice. Acta Neuropathol. Commun. 8, 129 (2020).
-
Murakami, M. & Kudo, I. Phospholipase A2. J. Biochem 131, 285–292 (2002).
-
Palavicini, J. P. et al. Oligomeric amyloid-beta induces MAPK-mediated activation of brain cytosolic and calcium-independent phospholipase A(2) in a spatial-specific manner. Acta Neuropathol. Commun. 5, 56 (2017).
-
Sanchez-Mejia, R. O. et al. Phospholipase A2 reduction ameliorates cognitive deficits in a mouse model of Alzheimer’s disease. Nat. Neurosci. 11, 1311–1318 (2008).
-
Kapustin, A. N. et al. Antisense oligonucleotide activity in tumour cells is influenced by intracellular LBPA distribution and extracellular vesicle recycling. Commun. Biol. 4, 1241 (2021).
-
Cataldo, A. M. et al. Down syndrome fibroblast model of Alzheimer-related endosome pathology: accelerated endocytosis promotes late endocytic defects. Am. J. Pathol. 173, 370–384 (2008).
-
Zhang, L. J. et al. Identification of lipid senolytics targeting senescent cells through ferroptosis induction. bioRxiv, https://doi.org/10.1101/2024.10.14.618023 (2024).
-
Kobayashi, T. et al. Separation and characterization of late endosomal membrane domains. J. Biol. Chem. 277, 32157–32164 (2002).
-
Linke, T. et al. Stimulation of acid sphingomyelinase activity by lysosomal lipids and sphingolipid activator proteins. Biol. Chem. 382, 283–290 (2001).
-
Linke, T. et al. Interfacial regulation of acid ceramidase activity. Stimulation of ceramide degradation by lysosomal lipids and sphingolipid activator proteins. J. Biol. Chem. 276, 5760–5768 (2001).
-
Zorzano, A. et al. Semicarbazide-sensitive amine oxidase activity exerts insulin-like effects on glucose metabolism and insulin-signaling pathways in adipose cells. Biochim Biophys. Acta 1647, 3–9 (2003).
-
Joutti, A., Vainio, P., Brotherus, J. R., Paltauf, F. & Kinnunen, P. K. The active site and the phospholipid activation of rat liver lysosomal lipase are not stereospecific. Chem. Phys. Lipids 29, 235–239 (1981).
-
Nyame, K. et al. PLA2G15 is a BMP hydrolase and its targeting ameliorates lysosomal disease. Nature, https://doi.org/10.1038/s41586-025-08942-y (2025).
-
Davidson, J. W. et al. Hepatic lipid remodeling in cold exposure uncovers direct regulation of bis(monoacylglycero)phosphate lipids by phospholipase A2 group XV. Cell Metab, https://doi.org/10.1016/j.cmet.2025.04.015 (2025).
-
Hullin-Matsuda, F. et al. De novo biosynthesis of the late endosome lipid, bis(monoacylglycero)phosphate. J. Lipid Res 48, 1997–2008 (2007).
-
Anderson, D. M. G. et al. Bis(monoacylglycero)phosphate lipids in the retinal pigment epithelium implicate lysosomal/endosomal dysfunction in a model of Stargardt disease and human retinas. Sci. Rep. 7, 17352 (2017).
-
Hullin-Matsuda, F., Luquain-Costaz, C., Bouvier, J. & Delton-Vandenbroucke, I. Bis(monoacylglycero)phosphate, a peculiar phospholipid to control the fate of cholesterol: Implications in pathology. Prostaglandins Leukot. Ess. Fat. Acids 81, 313–324 (2009).
-
Safaiyan, S. et al. White matter aging drives microglial diversity. Neuron 109, 1100–1117.e1110 (2021).
-
Roseborough, A. D., Jaremek, V. M. & Whitehead, S. N. Editorial Focus: White matter-associated microglia (WAMs) represent an important link between aging, white matter disease and microglial activity. Geroscience 44, 63–65 (2022).
-
Youmans, K. L. et al. Intraneuronal Abeta detection in 5xFAD mice by a new Abeta-specific antibody. Mol. Neurodegener. 7, 8 (2012).
-
Gotzl, J. K., Lang, C. M., Haass, C. & Capell, A. Impaired protein degradation in FTLD and related disorders. Ageing Res Rev. 32, 122–139 (2016).
-
Baker, M. et al. Mutations in progranulin cause tau-negative frontotemporal dementia linked to chromosome 17. Nature 442, 916–919 (2006).
-
Schymick, J. C. et al. Progranulin mutations and amyotrophic lateral sclerosis or amyotrophic lateral sclerosis-frontotemporal dementia phenotypes. J. Neurol. Neurosurg. Psychiatry 78, 754–756 (2007).
-
Wightman, D. P. et al. A genome-wide association study with 1,126,563 individuals identifies new risk loci for Alzheimer’s disease. Nat. Genet 53, 1276–1282 (2021).
-
Logan, T. et al. Rescue of a lysosomal storage disorder caused by Grn loss of function with a brain penetrant progranulin biologic. Cell 184, 4651–4668.e4625 (2021).
-
Ahmed, Z., Mackenzie, I. R., Hutton, M. L. & Dickson, D. W. Progranulin in frontotemporal lobar degeneration and neuroinflammation. J. Neuroinflammation 4, 7 (2007).
-
Lee, J. H. et al. Faulty autolysosome acidification in Alzheimer’s disease mouse models induces autophagic build-up of Abeta in neurons, yielding senile plaques. Nat. Neurosci. 25, 688–701 (2022).
-
Emre, C. et al. Age-related changes in brain phospholipids and bioactive lipids in the APP knock-in mouse model of Alzheimer’s disease. Acta Neuropathol. Commun. 9, 116 (2021).
-
Khorani, M. et al. The Impact of the hAPP695SW Transgene and Associated Amyloid-beta Accumulation on Murine Hippocampal Biochemical Pathways. J. Alzheimers Dis. 85, 1601–1619 (2022).
-
Miranda, A. M. et al. Effects of APOE4 allelic dosage on lipidomic signatures in the entorhinal cortex of aged mice. Transl. Psychiatry 12, 129 (2022).
-
Hong, J. H. et al. Global changes of phospholipids identified by MALDI imaging mass spectrometry in a mouse model of Alzheimer’s disease. J. Lipid Res 57, 36–45 (2016).
-
Ojala, P. J., Hirvonen, T. E., Hermansson, M., Somerharju, P. & Parkkinen, J. Acyl chain-dependent effect of lysophosphatidylcholine on human neutrophils. J. Leukoc. Biol. 82, 1501–1509 (2007).
-
Murohara, T., Scalia, R. & Lefer, A. M. Lysophosphatidylcholine promotes P-selectin expression in platelets and endothelial cells. Possible involvement of protein kinase C activation and its inhibition by nitric oxide donors. Circ. Res 78, 780–789 (1996).
-
Murugesan, G. et al. Lysophosphatidylcholine regulates human microvascular endothelial cell expression of chemokines. J. Mol. Cell Cardiol. 35, 1375–1384 (2003).
-
Tan, S. T., Ramesh, T., Toh, X. R. & Nguyen, L. N. Emerging roles of lysophospholipids in health and disease. Prog. Lipid Res 80, 101068 (2020).
-
Huang, L. S., Hung, N. D., Sok, D. E. & Kim, M. R. Lysophosphatidylcholine containing docosahexaenoic acid at the sn-1 position is anti-inflammatory. Lipids 45, 225–236 (2010).
-
Hung, N. D., Sok, D. E. & Kim, M. R. Prevention of 1-palmitoyl lysophosphatidylcholine-induced inflammation by polyunsaturated acyl lysophosphatidylcholine. Inflamm. Res 61, 473–483 (2012).
-
Lee, J. M., Park, S. J. & Im, D. S. Calcium Signaling of Lysophosphatidylethanolamine through LPA(1) in Human SH-SY5Y Neuroblastoma Cells. Biomol. Ther. (Seoul.) 25, 194–201 (2017).
-
Nishina, A. et al. Lysophosphatidylethanolamine in Grifola frondosa as a neurotrophic activator via activation of MAPK. J. Lipid Res 47, 1434–1443 (2006).
-
Chen, L. et al. Enhanced defense against ferroptosis ameliorates cognitive impairment and reduces neurodegeneration in 5xFAD mice. Free Radic. Biol. Med 180, 1–12 (2022).
-
Hu, C., Wang, M. & Han, X. Shotgun lipidomics in substantiating lipid peroxidation in redox biology: Methods and applications. Redox Biol. 12, 946–955 (2017).
-
Yavin, E. & Gatt, S. Oxygen-dependent cleavage of the vinyl-ether linkage of plasmologens. 1. Cleavage by rat-brain supernatant. Eur. J. Biochem 25, 431–436 (1972).
-
Lessig, J. & Fuchs, B. Plasmalogens in biological systems: their role in oxidative processes in biological membranes, their contribution to pathological processes and aging and plasmalogen analysis. Curr. Med Chem. 16, 2021–2041 (2009).
-
Jackman, N., Ishii, A. & Bansal, R. Oligodendrocyte development and myelin biogenesis: parsing out the roles of glycosphingolipids. Physiol. (Bethesda) 24, 290–297 (2009).
-
Xu, Z., He, S., Begum, M. M. & Han, X. Myelin Lipid Alterations in Neurodegenerative Diseases: Landscape and Pathogenic Implications. Antioxid. Redox Signal 41, 1073–1099 (2024).
-
He, S., Xu, Z. & Han, X. Lipidome disruption in Alzheimer’s disease brain: detection, pathological mechanisms, and therapeutic implications. Mol. Neurodegener. 20, 11 (2025).
-
Showalter, M. R. et al. The Emerging and Diverse Roles of Bis(monoacylglycero) Phosphate Lipids in Cellular Physiology and Disease. Int. J. Mol. Sci. 21, https://doi.org/10.3390/ijms21218067 (2020).
-
Boland, S. et al. Deficiency of the frontotemporal dementia gene GRN results in gangliosidosis. Nat. Commun. 13, 5924 (2022).
-
Nguyen, L. N. et al. Mfsd2a is a transporter for the essential omega-3 fatty acid docosahexaenoic acid. Nature 509, 503–506 (2014).
-
Hishikawa, D. et al. Discovery of a lysophospholipid acyltransferase family essential for membrane asymmetry and diversity. Proc. Natl Acad. Sci. USA 105, 2830–2835 (2008).
-
Rosso, S. B. & Inestrosa, N. C. WNT signaling in neuronal maturation and synaptogenesis. Front Cell Neurosci. 7, 103 (2013).
-
Nayak, D., Roth, T. L. & McGavern, D. B. Microglia development and function. Annu Rev. Immunol. 32, 367–402 (2014).
-
Butovsky, O. & Weiner, H. L. Microglial signatures and their role in health and disease. Nat. Rev. Neurosci. 19, 622–635 (2018).
-
Lloyd, A. F. & Miron, V. E. The pro-remyelination properties of microglia in the central nervous system. Nat. Rev. Neurol. 15, 447–458 (2019).
-
Wang, M. & Han, X. Multidimensional mass spectrometry-based shotgun lipidomics. Methods Mol. Biol. 1198, 203–220 (2014).
-
Yang, K., Cheng, H., Gross, R. W. & Han, X. Automated lipid identification and quantification by multidimensional mass spectrometry-based shotgun lipidomics. Anal. Chem. 81, 4356–4368 (2009).
-
Wang, M., Wang, C. & Han, X. Selection of internal standards for accurate quantification of complex lipid species in biological extracts by electrospray ionization mass spectrometry-What, how and why?. Mass Spectrom. Rev. 36, 693–714 (2017).
-
Wang, M., Palavicini, J. P., Cseresznye, A. & Han, X. Strategy for Quantitative Analysis of Isomeric Bis(monoacylglycero)phosphate and Phosphatidylglycerol Species by Shotgun Lipidomics after One-Step Methylation. Anal. Chem. 89, 8490–8495 (2017).
-
Sud, M. et al. Metabolomics Workbench: An international repository for metabolomics data and metadata, metabolite standards, protocols, tutorials and training, and analysis tools. Nucleic Acids Res 44, D463–D470 (2016).
Acknowledgements
Human brain tissue specimens were obtained through the NIH NeuroBioBank (Case #481, JPP and XH) from the Human Brain and Spinal Fluid Resource Center located at the VA Greater Los Angeles Healthcare System, West Los Angeles Healthcare Center, Los Angeles, CA 90073. This center is sponsored of Mental Health (NIMH), the National Multiple Sclerosis Society, and the Department of Veterans Affairs. This study was partially supported by National Institute on Aging grants AG085545 (X.H.), R01 AG061872 (X.H.), RF1 AG061729 (X.H.), P30 AG066546, P30 AG013319, and P30 AG044271, and UT Health SA intramural institutional research funds (J.P.P and X.H.), Methodist Hospital Foundation (X.H.), Cure Alzheimer’s Fund (X.H.), William and Ella Owens Medical Research Foundation (X.H. and J.P.P), NIH grant U2C-DK119886 and OT2-OD030544.
Ethics declarations
Competing interests
The authors declare no competing interests.
Peer review
Peer review information
Nature Communications thanks the anonymous reviewer(s) for their contribution to the peer review of this work. A peer review file is available.
Additional information
Publisher’s note Springer Nature remains neutral with regard to jurisdictional claims in published maps and institutional affiliations.
Supplementary information
Source data
Rights and permissions
Open Access This article is licensed under a Creative Commons Attribution-NonCommercial-NoDerivatives 4.0 International License, which permits any non-commercial use, sharing, distribution and reproduction in any medium or format, as long as you give appropriate credit to the original author(s) and the source, provide a link to the Creative Commons licence, and indicate if you modified the licensed material. You do not have permission under this licence to share adapted material derived from this article or parts of it. The images or other third party material in this article are included in the article’s Creative Commons licence, unless indicated otherwise in a credit line to the material. If material is not included in the article’s Creative Commons licence and your intended use is not permitted by statutory regulation or exceeds the permitted use, you will need to obtain permission directly from the copyright holder. To view a copy of this licence, visit http://creativecommons.org/licenses/by-nc-nd/4.0/.
About this article

Cite this article
Xu, Z., Kiani Shabestari, S., Barannikov, S. et al. Microglia-specific regulation of lipid metabolism in Alzheimer’s disease revealed by microglial depletion in 5xFAD Mice. Nat Commun 16, 9156 (2025). https://doi.org/10.1038/s41467-025-64161-z
-
Received:
-
Accepted:
-
Published:
-
DOI: https://doi.org/10.1038/s41467-025-64161-z