
Introduction
The coupling between brain energy metabolism and neurotransmission is essential for maintaining function, relying on complex metabolic interactions among neurons, astrocytes, oligodendrocytes, and microglia1. Neurons primarily depend on oxidative phosphorylation (OXPHOS) for ATP production, while glial cells (such as astrocytes and microglia) flexibly utilize OXPHOS, glycolysis, or fatty acid metabolism depending on functional demands2,3. In addition to meeting their own metabolic needs, glial cells regulate both neuronal function and inter-glial interactions4,5. Unlike astrocytes, which possess a robust antioxidant system, neurons have limited glutathione (GSH) regeneration capacity and a lower NADPH pool6, making them more susceptible to oxidative stress. Astrocytes support neurons by supplying lactate7 and, GSH precursors8, and participating in the glutamate-glutamine cycle, which is essential for synaptic function and neuronal metabolism9, and alleviating neuronal fatty acid toxicity10. Microglia dynamically respond to extracellular signals, adjusting their metabolism to modulate nutrient availability and influence both neuronal and astrocytic activity3,11. These highly coordinated metabolic exchanges ensure homeostasis and functional stability within the nervous system. Therefore, elucidating cell-specific metabolic dynamics and their intercellular interactions is crucial for advancing our understanding of brain function and developing tools to assess metabolic adaptation under various physiological conditions.
Understanding metabolic heterogeneity, dynamics, and interactions in brain cells requires non-destructive single-cell resolution methods. Non-invasive imaging techniques, such as positron emission tomography (PET), functional magnetic resonance imaging (fMRI), nuclear magnetic resonance (NMR) spectroscopy, and optical imaging12,13,14, provide insights into metabolic activity and functional connectivity. However, their limited spatial resolution prevents single-cell metabolic analysis and characterization of intercellular metabolic coupling. In contrast, single-cell transcriptomics and mass spectrometry-based metabolomics can resolve metabolic states at the single-cell level15,16, offering insights into metabolic reprogramming and energy utilization. However, these methods are invasive, making it impossible to track metabolic changes in living cells in real-time. High-resolution two-photon imaging overcomes these limitations, enabling dynamic assessments in living animals, including studies on spontaneous behavior17, memory formation and learning18, and inflammatory responses in astrocytes and microglia19. Most two-photon imaging studies rely on exogenous fluorescent markers, such as Ca²⁺-sensitive probes for neuronal and astrocytic activity or genetically encoded fluorescent indicators (GEFIs) to track metabolites like NAD⁺/NADH, glucose, lactate, amino acids, and nucleotides20. However, GEFIs require viral vector delivery, which has limited efficiency in primary human cells and only captures a subset of the metabolome, requiring calibration for accuracy. Label-free two-photon excited fluorescence (TPEF) imaging provides a powerful alternative by detecting autofluorescence from endogenous chromophores, allowing real-time metabolic analysis in brain slices and in vivo21,22,23. Since it does not rely on exogenous probes, TPEF enables the study of neuronal and glial metabolism without cellular manipulation. This imaging strategy holds great promise for advancing the analysis of brain cell metabolism and investigating metabolic remodeling in neurological diseases.
Britton Chance and colleagues pioneered studies decades ago using the natural fluorescence of NAD(P)H and flavins to assess brain metabolism, establishing their essential roles in redox pathways24,25. We use “NAD(P)H” to refer to fluorescence from both NADH and NADPH, as their excitation/emission characteristics are indistinguishable. Fluorescence from FAD and flavoproteins, such as LipDH, is collectively referred to as flavoprotein (FP) signal, the dominant source of flavin fluorescence in cells26. The redox ratio (RR), defined as FP/(NAD(P)H + FP), serves as a key metric of the cellular redox state, ensuring values remain between 0 and 1, which is useful for statistical analyses and comparisons of results acquired over different time points27. While alternative RR definitions exist, our choice aligns with biochemical redox potential, where a higher RR correlates with increased OXPHOS activity relative to glycolysis28,29,30. Beyond RR, other metrics derived from label-free TPEF intensity and lifetime imaging (FLIM), provide additional metabolic insights21,22,23,24,25. TPEF-based NAD(P)H intensity fluctuations reflect mitochondrial organization, as NAD(P)H fluorescence quantum efficiency is enhanced 2–10-fold in its bound state, predominantly localized in mitochondria31. To assess mitochondrial clustering, we rely on a Fourier-based method quantifying spatial NAD(P)H intensity fluctuations. The exponent, β, value of an inverse power law expression (f(k) = A × k−β, where k is spatial frequency and A is a constant) fit to the power spectral density (PSD) (i.e., the squared amplitude of the Fourier transform of the image intensity fluctuations) is proportional to the overall levels of mitochondrial fragmentation, with higher β values reflecting more fragmented mitochondrial states, associated with enhanced glycolysis, while lower β indicates higher levels of mitochondrial networking, and enhanced OXPHOS. This type of analysis has been validated in a range of specimens and studies, including cell cultures29,32, tissues30,33,34,35, as well as in vivo human imaging32,36. FLIM further refines metabolic characterization by distinguishing bound/free NAD(P)H and is sensitive to microenvironmental factors such as pH and viscosity28. Higher levels of protein-bound NAD(P)H, reflected in longer fluorescence lifetimes, are typically associated with increased OXPHOS activity28,37. While these established optical biomarkers are highly sensitive to metabolic shifts, integrating multiple parameters improves specificity in interpreting metabolic changes28,38. However, specificity can still be compromised by overlapping endogenous signals. One prominent example is lipofuscin, an oxidized macromolecular aggregate of proteins, lipids, and sugars39, which interferes with brain metabolic imaging due to spectral overlap with NAD(P)H and flavins40. It accumulates with oxidative stress, aging, and neurodegenerative diseases41,42,43, confounding metabolic measurements. During elevated OXPHOS, increased electron flux through the electron transport chain (ETC) may raise the likelihood of ROS generation via complexes I and III44,45,46,47. Correction strategies are therefore essential to improve analytical accuracy.
Despite the unique advantages of brain cell metabolic function assessments via TPEF, such measurements cannot be performed in vivo in humans because of penetration depth limitations. In this study, we focus on its utilization in engineered tissue models comprising a silk-collagen hydrogel seeded with human induced neural stem cells (hiNSCs), alone or in combination with human astrocytes, and microglia48. Silk-collagen hydrogels provide a tunable 3D microenvironment, supporting neuronal–glial interactions as well as neurodegenerative and traumatic brain injury studies48,49,50,51,52. Neurons in this system exhibit stable action potentials and spontaneous/evoked firing49, in vivo engraftment ability49, and functional network stability for over 2.3 years53. While these tissues lack vasculature and important brain functional features, such as a blood-brain barrier (BBB), they also offer a number of features that enable unique opportunities for understanding human brain function and responses to various stimuli, treatments, and environmental conditions. Prior studies and reviews have summarized the strengths and limitations of brain models—ranging from traditional brain slices (which preserve neuronal networks but lack long-term metabolic stability54), 2D cultures, to more advanced organoids (which self-organize into region-specific populations and support studies of development and degeneration55,56), microfluidic systems (which allow perfusion control and BBB modeling57), and silk–collagen hydrogels (used in the current study48,49,50,51,52)—for applications in traumatic brain injury58,59, disease modeling, and drug screening60. Within this landscape, silk–collagen hydrogels uniquely combine human-relevant cellular composition, long-term stability, and a controllable 3D microenvironment, making them a powerful platform for dissecting dynamic brain energy metabolism and cell–cell interactions.
For this study, the use of human brain cells and the ability to monitor the impact of cell maturation and interactions over approximately three months in a three-dimensional, well-controlled environment are particularly relevant. Specifically, we demonstrate how label-free spectral imaging informs analysis of multi-modal (intensity and fluorescence lifetime) TPEF images to enable identification of key fluorophores and the development of an analysis pipeline to quantify their respective contributions and associated metabolic function assessments. With detailed characterization of the excitation/emission properties of NAD(P)H, LipDH, FAD, and lipofuscin, we establish important methods to: (a) identify lipofuscin and remove its contribution to signals that we typically attribute to NAD(P)H and Fp, and (b) remove contributions from the overlap of spectral emission of NAD(P)H and FP into our estimates of their corresponding levels. Finally, we integrate multiple metabolic parameters, including redox state, mitochondrial fragmentation, and NAD(P)H binding characteristics, to formulate a more accurate assessment of the nature of the dynamic cell metabolic changes and interactions than relying on a single metric.
Results
Approach for long-term metabolic profiling of cell interactions in engineered brain tissue models
To compare the metabolic interactions between neurons and glial cells, we established two types of 3D engineered brain tissue models, consisting of silk-collagen hydrogels embedded either with human induced neural stem cells (hiNSCs) alone (referred to as Monocultures or “Mono”) (Fig. 1Aa), or with hiNSCs, primary human astrocytes, and human HMC3 microglia (referred to as NAM) (Fig. 1Ab). Cell seeding methods and ratios followed previously established protocols, leading to reasonably stable cell populations in long-term cultures48,52 (Supplementary Material SM1). After seeding, cells randomly distributed within the 3D model rather than forming a predefined clustering pattern48, as further supported by consistent cell-type counts across time (Table S1) and spatial density analysis (Fig. S1). To account, at least partially, for heterogeneities in the spatial distributions of the cells throughout the scaffolds, we selected three regions of interest (ROI) per scaffold (center, middle, edge; Fig. 1Ac) and performed weekly or biweekly two-photon imaging for up to three months (Fig. 1Ad).
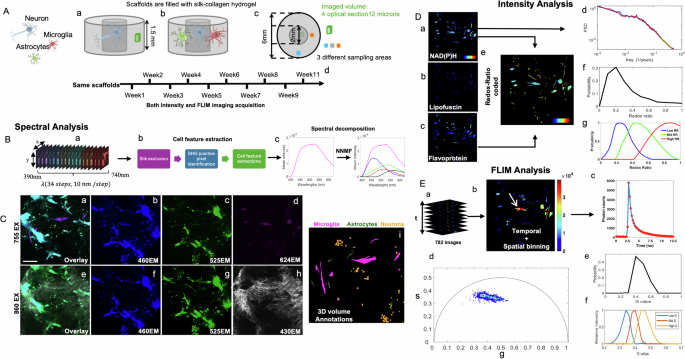
For the main results presented in this study, we acquired and analyzed three types of two photon images: (a) spectral images acquired over 390–740 nm at 755 and 860 nm excitation with a descanned detector equipped with a tunable prism-based bandpass filter, (b) TPEF and SHG images collected using four non-descanned detectors at two excitation wavelengths, and (c) FLIM images acquired with a non-descanned detector at 755 nm excitation and 435–485 nm emission using single photon counting electronics. Table S2 summarizes key experimental parameters, including excitation/emission wavelengths, detection hardware, and metabolic interpretations, differentiating spectral TPEF, SHG/TPEF, and FLIM imaging. We conducted spectral imaging to identify key endogenous fluorophores and their excitation/emission characteristics (Fig. 1B). Full-field images were acquired at 755 and 860 nm excitation over an emission range of 390–740 nm (Fig. 1Bb), and processed to isolate the cell features (SM2) and to spectrally deconvolve the associated emission spectra at the two excitation wavelengths into components attributed to major cellular fluorophores (Fig. 1Bc) (see “Methods” and SM3). Based on these spectral features, we established an approach to analyze label-free TPEF images, collected at two emission bands (500–550 nm and 435–485 nm) at 755 and 860 nm excitation to quantify lipofuscin, NAD(P)H, and FPs (see “Methods”).

Schematic representation of 3D neuronal monocultures (Aa) and tricultures (Ab), along with imaging areas and sampling volumes (Ac) indicated by green, blue, and orange squares to capture heterogeneity. Ad shows imaging acquisition periods for both tissue types. Spectral data acquisition was performed at 755 nm and 860 nm excitation, covering 390–740 nm emission (Ba), with a workflow for cell feature extraction from spectral data (Bb) and spectral decomposition using non-negative matrix factorization to identify key fluorophores (Bc). Images were acquired at 755 nm (Ca–d) and 860 nm (Ce–h), at four distinct emission ranges. Representative max intensity projections of a 465 × 465 × 12 µm image stack (projected over the 12 µm z-axis) are shown, together with the corresponding overlays acquired at 755 nm excitation. (Ca: overlap of Cb–d) and 860 nm (Ce: overlap of Cf–h). Individual panels show 755ex/525em (Cb), 755ex/460em (Cc), 755ex/624em (Cd), 860ex/525em (Cf), 860ex/460em (Cg), and 860ex/430em (Ch). Ci presents annotated cell features in the same volume. D Intensity-based analyses feature NAD(P)H images at 755ex/460em (Da), lipofuscin images at 860ex/460em (Db), flavoprotein images at 860ex/525em (Dc), redox ratio (RR) color-coded images (RR = FP/(NAD(P)H + FP)) generated from Da and Dc (De), mitochondrial clustering analyses from Da (Dd), redox ratio distributions from redox ratio maps (Df), and decomposed redox distribution components (Dg). FLIM analyses include fluorescence lifetime data illustration (Ea), temporal and spatial binning (Eb) with a color bar representing photon counts, a lifetime decay trace from a single pixel highlighted in white and pointed by the white arrow in (Eb). (Ec), phasor analysis (Ed), g distribution derived from g values in Ed (Ee), and g component evaluation (Ef). All images in (C–E) are maximum projections of a 3D volume from the same ROI. Ca–h images are pseudo-colored; Da–d images use the “jet” colormap, where blue represents lower values and red represents higher values. The color scale for Da-c ranges from 0 to 0.001, while Dd ranges from 0 to 1. Note: A includes a schematic scaffold adapted from our previously published work (Yang Zhang et al., “Synergistic label-free fluorescence imaging and miRNA studies reveal dynamic human neuron-glial metabolic interactions following injury,” Science Advances 10, eadp1980 (2024); DOI: 10.1126/sciadv.adp1980). Reused under a Creative Commons Attribution–NonCommercial (CC BY-NC 4.0) license from the American Association for the Advancement of Science (AAAS).
Figure 1C presents full-field images under different excitation-emission wavelengths, capturing cellular structures and non-cellular components (e.g., collagen fibers and silk scaffolds). Neurons exhibited similar fluorescence intensities in the 755/460 nm and 860/525 nm excitation/emission regimes, whereas glial cells had weaker signals in the 860/525 nm region associated with flavins (Fig. 1Cf). Thus, in composite pseudocolor images (Fig. 1Ca), neurons appeared green, astrocytes cyan, and microglia magenta due to mCherry expression, allowing for manual annotation (Fig. 1Ci, “Methods”). Based on annotated cell features, we calculated the optical redox ratio (RR = FP/(NAD(P)H + FP)) using the extracted NAD(P)H and FP signals (Fig. 1De). In addition, we used Fourier-based analysis of NAD(P)H TPEF intensity fluctuations to quantify mitochondrial fragmentation (Fig. 1Dd). Finally, we performed FLIM imaging (Fig. 1Ea–c) and phasor analysis (Fig. 1Ed–f), which transforms fluorescence lifetime decays into a 2D coordinate space without requiring multi-exponential fitting, to evaluate NAD(P)H fluorescence lifetime characteristics61 (see “Methods”). Combining FLIM with TPEF intensity metrics, we assessed NADPH utilization, oxidative stress, and changes in the relative of key metabolic pathways, such as OXPHOS, glycolysis, and fatty acid oxidation.
Decomposition of spectral images identifies key fluorophores and distinct excitation/emission profiles
We analyze fluorescence emission spectra from 390 to 620 nm collected at two excitation wavelengths, 755 and 860 nm, to capture contributions from NAD(P)H and FPs, essential for metabolic function assessments. We ignore emission beyond 620 nm to avoid artifacts introduced by the 755 nm excitation line. The porous silk hydrogel and the collagen fibers also exhibit strong autofluorescence due to cross-links (Fig. S2)62. We rely on the strong autofluorescence of silk scaffold features to manually exclude such contributions and define the region of interest (ROI) where cells reside, utilizing the maximum projection per imaged volume (Fig. S2E). Then, we use an Image Segmentation Baseline Algorithm (ISBA) to identify cells (SM2, Figs. S2–S4). The mean spectra from these segmented cells are shown in Fig. 2A, B for select time points (weeks 5, 7, 9, and 11), with total cellular intensity normalized by cell pixel count. Red lines represent spectra from neuronal monocultures, while blue lines represent the mean spectra from NAM tissues with all three cell types. We observe significant differences between monoculture and NAM tissues under 755 nm excitation, likely due to variations in NAD(P)H and FP content, both effectively excited at this wavelength. Both cultures also show time-dependent red shifts. At 860 nm excitation, where NAD(P)H excitation is minimal63, these time-dependent shifts suggest the presence of more than one fluorophore.

Cell spectra from neuronal monocultures (Mono-red) and tri-cultures (NAM-blue) acquired at 755 nm (A) and 860 nm (B) excitation wavelengths at 5,7,9, and 11 weeks from the onset of tissue culture. Spectral components at 755ex (C) and 860ex (D), derived from NNMF analysis of all cell spectra, attributed to NAD(P)H-blue, LipDH-red, FAD-black, and lipofuscin-green. E Representative NAM spectra from a sample 9 weeks in culture (solid magenta) with corresponding fit (dashed magenta), reconstructed using derived component shapes and their corresponding weights, showing the contributions from each fluorophore. Lipofuscin is a dominant contributor at both excitation wavelengths. (n = 174 spectra for A–E). F Spectrally deconvolved lipofuscin amounts from neuronal monocultures, indicating a significant increase, especially during the last month of culture (n = 52 spectra). Error bars denote the standard error of the mean (SEM). Statistical comparisons were performed using one-way ANOVA with Tukey’s post hoc test; *P < 0.05, **P < 0.01.
To identify the number of key fluorophores and their spectra, we use non-negative matrix factorization (NNMF) on the combined emission spectra from 755 nm and 860 nm excitation obtained from the same locations (see “Materials and Methods,” SM3). To facilitate meaningful spectral extraction, we rely on three assumptions: (a) negligible NAD(P)H TPEF excitation at 860 nm based on previous studies63, (b) similar NAD(P)H spectral profiles in epithelial cells and brain cells since NAD(P)H participates in similar cellular reactions, and (c) consistent emission spectra of fluorophores such as NAD(P)H and FPs under different excitation wavelengths (i.e., 755 and 860 nm) (SM3). This NNMF analysis yields excellent fits with a minimum of four components, which we attribute to NAD(P)H, lipofuscin, and two flavins (Figs. 2C, D and S5–7). The shapes and relative intensities of the four components at 755 and 860 nm excitation are derived from the NNMF analysis, described in detail in SM3. The NAD(P)H component is derived from analysis of highly proliferative epithelial cells, rich in NAD(P)H64 (SM4, Fig. S5). The two flavin profiles, assigned as lipoamide dehydrogenase (LipDH) and flavin adenine dinucleotide (FAD), are based on their distinct 860 nm profiles due to minimal NAD(P)H interference and established spectral and lifetime characteristics63,65 (SM4, Fig. S7). Lipofuscin shows broad emission and strong excitation at both wavelengths. As lipofuscin is associated with oxidative stress, we validate its spectral identity through experiments inducing oxidative stress in microglial cultures (Fig. S8 and SM5).
As shown in Fig. 2C, D, our analysis yields the wavelength-dependent excitation efficiency of each fluorophore. The four spectral components accurately represent spectral variations in neuronal monocultures and NAM brain tissues (N = 174), capturing 96% of variation with a residual of 0.03 (Fig. 2E). Lipofuscin contributions are significant at both excitation wavelengths, increasing over culture time (Fig. 2F). Removing lipofuscin fluorescence from signals typically attributed to NAD(P)H and flavins is important for accurate metabolic assessments. Despite overlapping spectral emissions, excitation efficiencies differ significantly at 860 nm vs. 755 nm: ~0:1 for NAD(P)H, ~0.54:1 for LipDH, ~0.14:1 for FAD, and ~0.96:1 for lipofuscin. These differences are exploited to establish robust fluorophore quantification approaches from images at two emission ranges (shaded areas in Fig. 2C, D) for each excitation wavelength.
Spectra inform extraction of more accurate fluorophore contributions in TPEF images from a limited number of excitation/emission wavelengths
In most label-free metabolic imaging TPEF studies, a combination of two excitation and emission wavelength ranges is used to collect signals efficiently by non-descanned detectors that are typically attributed to NAD(P)H and flavins. In Fig. 2C, D, we overlay with the fluorophore spectra the shaded wavelength regions that correspond to the bandpass filters that we typically use to collect NAD(P)H and flavin TPEF (Figs. 2C, D and S9). Excitation below 800 nm captures NAD(P)H, emitting near 450–460 nm, avoiding major flavin contributions. TPEF from excitation above 850 nm, more specific to flavins, is collected beyond 500 nm. Considering fluorophore spectra characteristics and non-descanned detector emission ranges, we set a conservative threshold of 0.8 for the 500–550 nm intensity ratio at 860 nm vs. 755 nm to identify pixels with substantial lipofuscin contributions, even when the overall intensity is low due to minimal lipofuscin content.
Following lipofuscin pixel removal, we attribute the remaining signal to NAD(P)H and flavins. NAD(P)H primarily contributes to the 435–485 nm detector at 755 nm excitation, though LipDH (flavin 1) may also contribute, especially in neurons with active OXPHOS driven by NADH use, resulting in similar levels of NAD(P)H and flavins. Using full spectra, we accurately quantify the contribution of each fluorophore from four images across the two emission bands and excitation wavelengths, as detailed in the crosstalk adjustment section (SM7). Finally, we confirm accuracy by comparing intensity-based and spectral-based RR calculations in neuronal monocultures (Fig. S10) and validate NAD(P)H intensity, mitochondrial clustering, and redox metrics with hypoxia measurements in microglial cultures (Fig. S11)28,32.
Endogenous TPEF intensity-based metabolic assessments reveal differential metabolic profiles and interactions between neurons and glial cells
To systematically evaluate metabolic changes over time, we categorize the 3-month culture period into three distinct phases, based on prior studies supporting this classification48,66. The decision to monitor up to 3 months is informed by findings demonstrating long-term structural and functional stability beyond this period49. Phase 1 (W3–W5) corresponds to early differentiation48,66, during which neuronal networks begin to form, and structural organization emerges (Fig. S12C–E). Phase 2 (W6–W8) represents metabolic stabilization (Fig. S12F–H), characterized by a fully developed network and the establishment of immune homeostasis53. Phase 3 (W9–W11) marks long-term metabolic adaptation (Fig. S12I–K), where stabilized axonal outgrowth and sustained metabolic plasticity reflect prolonged energy regulation mechanisms46. Representative RR-coded projections from tricultures and monocultures at weeks 3, 7, and 11 show neurons with higher redox ratios (Fig. 3A–D) and lower mitochondrial fragmentation (Fig. 3E) compared to astrocytes and microglia, indicating greater OXPHOS and/or glutaminolysis activity28. Neurons also show higher lipofuscin levels (Fig. 3F), suggesting increased oxidative stress from their reliance on OXPHOS and limited antioxidant capacity due to lower GSH and NADPH levels than astrocytes1,10. Astrocytes and microglia show similar metabolic function readouts, though astrocytes have lower mitochondrial fragmentation during weeks 6–8, indicating increased glutaminolysis/OXPHOS (Fig. 3E). Interestingly, astrocytes but not microglia show an increase in lipofuscin levels at weeks 9–11 (Fig. 3F), indicating greater oxidative stress, possibly because of elevated OXPHOS activity during the earlier time point. Although microglia are generally expected to rely on OXPHOS for energy67, in this model, they show metabolic profiles more similar to astrocytes than neurons. This could indicate some functional limitations for the type of microglia used in this model, which have been reported previously68. We note that in Fig. 3A–C, each image represents a max projection which includes only segmented cells from a particular cell type. The ROI for each panel is distinct and selected to illustrate the RR differences and heterogeneities among different cell types.

Maximum projections of representative redox ratio images for different cell populations at Week 3 (A), Week 7 (B), and Week 11 (C). All images share the same color bar and scale bar. D redox ratio of different cell types as a function of time. Weeks were separated into three groups: W3–W5 (ROIs acquired at weeks 3, 4, and 5), W6–W8 (weeks 6, 7, and 8), and W9–W11 (weeks 9 and 11). E Mitochondrial clustering comparisons. F Lipofuscin intensity comparisons. Weekly data are categorized into three ranges, each cell type represented by a distinct color. (*, **, and *** denote p < 0.05, p < 0.01, and p < 0.001, respectively. Black asterisks: differences for each cell group among the three time points; color asterisks: differences for comparisons at a given time point among neurons, astrocytes, microglia (ANOVA), and between Neurons in Mono and Neurons in NAM. For example, dark blue asterisks on top of W3–W5 Astrocytes for Redox Ratio indicate significant differences with the W3-W5 NAM Neuron Redox Ratio values. Note that dark green asterisks are not shown on top of the W3–W5 NAM Neuron Redox Ratio values, i.e., comparisons are shown only with one set of asterisks.) Error bars denote the standard error of the mean (SEM).
In monocultures, neurons show higher redox ratios relative to NAM neurons but also higher fragmentation, suggesting active yet stressed mitochondria. Interestingly, NAM neurons show minimal RR changes from W3–W5 to W9–W11, unlike the steady increase in monocultures, which also display significant lipofuscin accumulation. In NAM neurons, lipofuscin levels, defined by the integrated intensity of lipofuscin pixels normalized by cell pixel count, increase significantly from W3–5 to W6–8 but remain stable during W9–11. Examining the relative number of lipofuscin pixels to cell pixels, NAM neurons start with a significantly higher proportion than monocultures, with only slight increases over time, while monocultures display a continuous rise in lipofuscin pixels (Fig. S13). This pattern aligns with astrocytes supporting neurons in NAMs by supplying energy and antioxidants, such as lactate, glutamine, and GSH1,10. Monoculture neurons, on the other hand, need to maximize energy production via OXPHOS activity, further contributing to ROS generation and oxidative stress (Fig. 3E, F). Collectively, these results demonstrate the ability of label-free intensity-based TPEF imaging to identify not only dynamic metabolic behavior but also interactions between different types of brain cells with significant functional implications.
Lipofuscin autofluorescence significantly impacts optical metabolic function metrics
To demonstrate the importance of accounting for the presence of lipofuscin autofluorescence in these engineered brain tissue models, we present RR and mitochondrial fragmentation assessments performed with and without the removal of lipofuscin. Given the heterogeneity in the RR hues observed in Fig. 3A–C, we present the RR results in terms of the relative prevalence of low, mid, and high RR pixel contributions from each ROI, extracted using NNMF of the corresponding RR distributions (Fig. 4A–C). Previously, we used a similar approach with a three-component Gaussian fit to the RR distributions of neuron and astrocyte cultures treated with various Mg concentrations, finding high RR prevalence as a marker of oxidative stress69. Consistently, neurons in monocultures have the highest High RR prevalence, with neurons in NAMs characterized by increased high RR levels compared to glial cells for all time points. Interestingly, NAM neurons show a small, insignificant drop in High RR during weeks 9–11 compared to weeks 6–8, possibly due to glial support. Additionally, monoculture neurons but not NAM neurons show an increase in Low RR components over time, indicating enhanced glycolysis or fatty acid oxidation (FAO) along with sustained oxidative stress (Fig. 4A). In the current study, the increase in the High RR component in astrocytes (p = 0.06) aligns with the increase in lipofuscin (p = 0.05), suggesting higher oxidative stress in astrocytes at later weeks, also higher than in microglia (Fig. 4C). Note the dominance of the low RR pixel contributions to the glial cell RR as an indicator of high levels of glycolytic and/or FAO activity. Overall, this nuanced RR analysis enables detailed metabolic insights, which exploits more fully the high-resolution measurements afforded by this imaging modality.

A–C Low, mid, and high redox ratio (RR) components with (R group) and without (NR group) lipofuscin removal. D Mitochondrial fragmentation comparisons. Weekly data are grouped into W3–W5, W6–W8, and W9–W11, with cell types represented by distinct colors. Significance is shown with asterisks (*) for lipofuscin-removed groups, circles (°) for non-removed groups, and purple stars (★) for direct removed-versus–non-removed (NR) comparisons at the same time point. Lower-case p values refer to removed-group comparisons, whereas capitalized italic P values refer to NR-group comparisons. Black symbols indicate temporal differences within each cell type; colored symbols represent differences across cell types at each time point, including comparisons among neurons, astrocytes, and microglia, and between neurons in monoculture and NAM. n = 3 cultures per condition, with 2–3 ROIs per culture. Statistical comparisons were performed using one-way ANOVA with Tukey’s post hoc test; direct Removed–NR comparisons used two-tailed t-tests. p < 0.05, *p < 0.01, **p < 0.001; °P < 0.05, °°P < 0.01, °°°P < 0.001; ★p < 0.05, ★★p < 0.01, ★★★p < 0.001. Error bars denote the standard error of the mean (SEM).
Lipofuscin removal impacts most significantly assessments of mitochondrial fragmentation (Fig. 4D), because the bright, granule-like features of lipofuscin resemble fragmented mitochondria. Notably, neurons appear erroneously to exhibit higher levels of fragmented mitochondria compared to glial cells (Fig. 3D), which would be suggestive of enhanced glycolysis. Neurons, containing more lipofuscin than glial cells, show pronounced changes after removal, especially in mid and high RR components, though group and time differences remain similar with or without lipofuscin removal (Fig. 4B, C). These findings underscore the significant effect of lipofuscin on brain cell autofluorescence and illustrate how detailed spectral knowledge enhances the accuracy of metabolic function metrics.
Label-free fluorescence lifetime imaging is sensitive to antioxidant activity in human brain cells
We display representative mean intensity weighted fluorescence lifetime (({{{rm{tau }}}}_{{mean}}))-coded projections from each brain cell type in Fig. 5A–C, with bluer hues indicating decreasing ({{{rm{tau }}}}_{{mean}}) for all cell types over time (Fig. S14). We assumed a bi-exponential lifetime decay28 for these assessments, likely an oversimplified model. However, these changes provide a qualitative representation of some of the significant phasor lifetime changes that we observe over time (Fig. S15). To quantify these shifts, we focus on a three-component decomposition to the phasor G component distributions per ROI, the primary axis where time-dependent phasor shifts in cell features are detected (Figs. S15 and S16). In our hypoxia experiment with microglial 2D cultures, we observe a marked decrease in Mid G component prevalence and an increase in High G component contributions (Fig. S11K–M) as OXPHOS activity declines and glycolysis rises. These results suggest that mid G values are sensitive to bound NADH levels (elevated with high OXPHOS activity), while low G values reflect free NAD(P)H levels, which increase with glycolysis. Low G component values decrease slightly under hypoxia without statistical significance, yet show notable differences among brain cell types in engineered tissues, with significant variation over time. This metric may be a sensitive indicator of NADPH utilization by the GSH pathway for oxidative stress mitigation, aligning with the longer lifetimes of bound NADPH compared to bound NADH70.

Representative mean intensity weighted fluorescence lifetime images of different cell populations at Week 3 (A), Week 7 (B), and Week 11 (C), color-coded using a shared scale bar. D–F Low, mid, and high G component concentrations. Weekly data are grouped into W3–W5, W6–W8, and W9–W11, with each cell type represented by a distinct color. Black asterisks indicate differences within each cell type across time points (one-way ANOVA). Colored asterisks indicate comparisons across neurons, astrocytes, and microglia within each time window (one-way ANOVA), and between neurons in monoculture and NAM (two-tailed t-test). n = 3 independent cultures per condition, with 2–3 ROIs per sample. Statistical significance is indicated as *P < 0.05, **P < 0.01, ***P < 0.001. Error bars denote the standard error of the mean (SEM).
All cell features show reduced prevalence of Low G phasor values. NAM neurons exhibit the greatest decrease in Low G values as NADPH is heavily used by the glutathione antioxidant pathway to support ROS mitigation generated by high OXPHOS activity. Neurons have a limited capacity to regenerate NADPH via the pentose phosphate pathway, likely relying on astrocytes for replenishment71. Astrocytes exhibit higher levels of NADPH pools than microglia, especially at the initial and final time points, with astrocytes being able to maintain NADPH levels after a decrease during W6–8, consistent with their established capabilities to replenish their NADPH and maintain high anti-oxidant activity72. Astrocytes also show increased mid-G components at the final time point, aligning with higher OXPHOS and lipofuscin levels (Fig. 3F). Interestingly, microglia display higher levels of High G value phasors, indicating elevated free NAD(P)H linked to FAO, consistent with a lower RR28. The abrupt drop in low G prevalence during W6–8, alongside rising mid and high G values, continuing into W9–11, suggests that monoculture neurons upregulate OXPHOS more significantly than NAM neurons and may engage FAO to meet energy demands, consistent with lipofuscin increases and reduced mitochondrial fragmentation at the last time point (Fig. 3). These results show complementary insights from intensity and lifetime-based metabolic function metrics, with lifetime metrics uniquely capturing bound NADPH and GSH pathway activity. They underscore the complex, dynamic metabolic behavior of human brain cells even under standard conditions without added stress.
Finally, the lipofuscin FLIM phasor characteristics in human brain cells within the engineered tissue models are largely consistent across cell types (Fig. S17). Neurons in monoculture show a higher long lifetime for lipofuscin than neurons in NAMs, possibly due to differing GSH activity under oxidative stress (Fig. S17). Lipofuscin phasors significantly overlap with cell phasors, and in this study, no notable impact on derived phasor-based metrics was observed.
Combined use of optical metabolic function metrics enables visualization of dynamic, cell-dependent metabolic pathway utilization by different human brain cells
We use quadratic discriminant analyses (QDA) to reduce the dimensionality of the 12 optical metabolic function parameters we extract from analysis of label-free, intensity and lifetime images: mitochondrial clustering, RR, lipofuscin intensity, low RR, mid RR, high RR and NAD(P)H short lifetime, long lifetime, bound fraction, low G, mid G, high G. Results reveal time-dependent separation for all cell types, with astrocytes showing minimal changes over time (Fig. 6A) compared to more substantial changes in other cells (Fig. 6B–D). This stability suggests astrocytes may flexibly mobilize metabolic pathways to maintain homeostasis. Astrocytes and microglia show overlapping metabolic profiles (Fig. 6E), indicating similar baseline functions, while neurons in monoculture and tri-culture occupy distinct QDA spaces, reflecting pathway differences validated by our data. These observations demonstrate interactions between neurons and glial cells, with neuronal dynamics differing under monoculture and tri-culture conditions. Overall, our study demonstrates that label-free, TPEF imaging is a well-suited modality to monitor differences and dynamic changes in metabolic pathway utilization among different cell types, highlighting its potential to provide insights into the role of metabolic dysfunction in neurodegenerative conditions.

A combination of optical metabolic metrics—mitochondrial clustering, redox ratio, lipofuscin intensity, and redox subcomponents (low, mid, high RR) derived from TPEF intensity images; along with NAD(P)H short/long lifetimes, bound fraction, and phasor-derived G components (low, mid, high G AUC) from FLIM data—reveals cell-type-specific dynamics over 3 months in culture. Canonical plots resulting from QDA using optical metabolic function metrics from Astrocytes (A), Microglia (B), Neurons from NAM (C), and Neurons from monocultures (D) at different weeks. E Monoculture neurons are metabolically distinct from NAM Neurons, but more similar to them than to astrocytes and microglia. Astrocytes and microglia are metabolically more similar compared to neurons.
Discussion
Using TPEF and FLIM imaging, we identified the excitation-specific emission profiles of four main fluorophores, NAD(P)H, two flavins, and lipofuscin, enabling comprehensive metabolic characterization. We then developed a method to identify and exclude lipofuscin-rich pixels using just two emission bands, allowing precise cell-specific assessments of redox ratio metrics, mitochondrial fragmentation, and NAD(P)H lifetime measurements. Although the silk-collagen hydrogel model lacks vascular structures, and neurons in this system do not rely on glial nutrient transfer as they do in vivo, monoculture-triculture comparisons revealed neuronal-glial metabolic interactions. These findings demonstrate the power of label-free spectral imaging in resolving metabolic dynamics in a controlled 3D system, offering a valuable tool for studying brain function and physiology.
Lipofuscin accumulation, linked to aging and oxidative stress, is associated with neurodegenerative diseases like Parkinson’s and Alzheimer39,41, and its connection to ROS abundance has been demonstrated in genetically engineered mouse models73. This study identifies broad TPEF lipofuscin emission, excited with similar efficiency at 755 and at 860 nm, with significant contributions almost throughout the visible spectrum, overlapping highly with emission from NAD(P)H and flavins (Fig. 2). The broad, excitation-dependent emission spectra observed suggest multiple chemical species contributing to lipofuscin emission, explaining the variability in lipofuscin fluorescence reported across different tissues74. For example, the lipofuscin spectra features we extract align with those from the mouse brain cortex by Eichhoff et al.75 and isolated lipofuscin granules from human cadaver retinal pigmented epithelial (RPE) cells76, with RPE-associated studies showing wavelength- and tissue-dependent emission spectra77,78. Additionally, broad emission in the 430–490 nm and 570–620 nm ranges is reported in live APPswe:PS1dE9 mouse cortex, an Alzheimer’s disease model, with a maximum at 650 nm as shown by Chen et al.43. A broad, but also somewhat red-shifted emission with a peak at 567 nm is reported in post-mortem frontal lobe human brains79. Thus, it is important to characterize the spectral excitation-emission characteristics of lipofuscin-associated fluorescence in the cell or tissue model of interest. Lipofuscin lifetime phasor signatures in our study overlap significantly with those of NAD(P)H (Fig. S18A), showing ({tau }_{{mathrm{mean}}}) around 3–3.5 ns (Fig. S18D). Reported lipofuscin lifetimes vary widely, with Hakvoort et al. documenting 1.41–1.53 ns in the human cortex42, while isolated lipofuscin granules from retinal epithelial cells exhibit longer lifetimes due to oxidized bisretinoid products76,80. In mouse cortex studies, lipofuscin TPEF-associated lifetime phasors generally show shorter lifetimes than those of NADH-associated autofluorescence but vary significantly even within the same mouse model43,81. This highlights the sensitivity of lipofuscin fluorescence lifetimes to the microenvironment and the necessity for model-specific characterization. While fluorescence lifetime metrics may be distinct from other cellular fluorophores in some cases, this is not necessarily always the case. Isolating lipofuscin allows more accurate assessment of NAD(P)H and flavin contributions, which are crucial for understanding metabolic functions.
While NADH and NADPH have similar fluorescence emissions, their functional roles differ significantly. NADH is central to energy production and redox regulation, participating in glycolysis, OXPHOS, and the TCA cycle82. NADPH, on the other hand, is vital for synthesizing fatty acids, cholesterol, and steroids, as well as for antioxidant defense, nitric oxide production, and detoxification83,84,85. Neurons are highly vulnerable to oxidative stress due to a lower glutathione pool86 and reduced ability to regenerate NADPH through the pentose phosphate pathway87. Consequently, they rely on astrocytes for glutathione transfer2. Although NADPH fluorescence is often considered a minor contributor to cell autofluorescence compared to NADH, a mouse HPLC-MS study shows a higher NADPH/NADH ratio in brain tissue than in heart, liver, or muscle88. Additionally, FLIM studies report longer lifetimes for bound NADPH than NADH70,83. Our findings indicate that neurons, astrocytes, and microglia exhibit decrease in low G component values in lifetime phasor distributions at 755 nm excitation and 435–585 nm emission over time in culture, suggesting sensitivity to bound NADPH (Fig. 5D). This trend aligns with expected GSH pathway activity mobilized against oxidative stress, evidenced by lipofuscin accumulation and elevated redox ratios. Several studies highlight the important role of astrocytes for supplying neurons with substrates such as lactate, glutamine, cysteine, and glycine1,10, to alleviate energy demands and to improve antioxidant defenses. We observe significant intensity and lifetime-based metabolic differences, supporting that neuron-astrocyte interactions help neurons better manage oxidative stress than in isolated cultures. While bound NADH likely contributes to low G values (alongside bound NADPH), it is expected to primarily influence mid G values. The significantly higher mid G prevalence in neurons in monoculture versus NAM tissues suggests a stronger reliance on tricarboxylic acid cycle-driven metabolism for energy during the first 8 weeks in culture. This metabolic activity appears more sustainable in NAM neurons, where mid G values continue to rise through weeks 9–11. The slight, non-significant increase in mid G values along with higher high G values may indicate enhanced FAO, aligning with increased low RR values for monoculture neurons. The significant higher prevalence of high G values in astrocytes and microglia compared to neurons aligns with the glycolytic and FAO activity levels of these cells, consistent with RR and mitochondrial fragmentation observations.
The engineered brain tissue models used offer unique opportunities to study well-controlled factors that are otherwise challenging to assess. In this study, for example, we demonstrate the effect of the presence of astrocytes and microglia on the metabolic function of neurons over time in culture. As noted earlier, a number of studies have been performed to assess the impact of treatments as a means to prevent secondary injury propagation or plaque formation in an HSV-infection Alzheimer model89. There are of course limitations as these models lack key functional brain features, such as a blood-brain barrier. In the context of our studies, incorporation of other types of human microglia, such as induced pluripotent stem cell-derived microglia, may be used to improve relevance to tissue function48. Also, we could perform measurements under more physiologically relevant oxygen levels (5%)90, as oxygen tension can influence glycolytic activity and oxidative stress91. However, most studies with these models have been performed under more standard cell culture conditions (i.e., 21% oxygen). Such conditions are likely still relevant for detecting relative metabolic shifts and cell-specific pathway engagement92. Furthermore, we noted that the distributions of different cell types and distances among different cells are not well-defined or controlled in these tissues, with the selected cell seeding densities established empirically in previous studies to enable co-culture of all three cell types. Since prior studies have demonstrated that the local microenvironment and cell-to-cell distances affect metabolic exchange, signaling pathways, and cellular function, future studies could be designed to examine the impact of such factors on metabolic function more thoroughly. Finally, we note that the volumes imaged at each time point represent a small fraction of the overall scaffold, limited by the point-scanning nature of image acquisition and the low levels of endogenous autofluorescence. Higher throughput two-photon imaging implementations under development can overcome this limitation93.
In summary, our study provides key insights into label-free two-photon metabolic assessment of human brain cells. First, accurately identifying and removing lipofuscin is crucial, as it accumulates over time, especially in neurons, while glial cells help reduce oxidative stress in neurons. Second, our research demonstrates the benefits of multimodal two-photon techniques for precise cell-specific metabolic analysis, allowing quantification of NADH, NADPH, and flavoproteins. Our approach captures dynamic subcellular changes in critical metabolic pathways, including OXPHOS, glycolysis, the glutathione pathway, and fatty acid oxidation, without sample destruction. Our findings in the engineered brain tissue models highlight the presence of significantly different metabolic functional profiles among different cell types and over time. These findings lay a foundation for rigorous metabolic assessments in brain tissues more broadly, advancing our understanding of normal and diseased brain function and supporting studies of novel interventions.
Materials and methods
3D engineered brain tissue models
Neuronal monocultures (Mono) and tricultures (NAM) were established in 3D silk-collagen hydrogels, with Mono containing only human-induced neural stem cells (hiNSCs) and NAM incorporating hiNSCs, astrocytes, and microglia, following established protocols48 (details see SM1). To distinguish microglia from astrocytes in TPEF and FLIM imaging, we used mCherry-expressing HMC3 microglia. mCherry fluorescence emission is not significant below 560 nm94, and should not interfere with the detection of flavin and NAD(P)H signals at 435–485 nm and 500–550 nm (Fig. 1Cd). Cell-specific immunostaining (Tuj1, TMEM119, Vimentin) in previous studies confirmed that neurons, astrocytes, and microglia coexisted in close proximity within the hydrogel48.
Cultures were maintained at 21% O2 (~160 mmHg pO2), a standard in vitro condition that exceeds the physiological brain range (2–11% pO2)90. While 5% O2 (~38 mmHg) better mimics in vivo conditions, studies have shown that neuronal-glial metabolic interactions persist under both oxygen levels despite differences in glycolytic activity and oxidative stress responses91. Moreover, mesenchymal stem cells (MSCs) and neuronal cultures at 5% pO2 exhibit increased glucose consumption, lactate production, and glycolytic gene expression, while maintaining comparable viability and metabolic coupling to 21% pO2 conditions92. Given these findings and the widespread use of atmospheric oxygen levels for in vitro neuroscience studies90, 21% O2 remains a relevant condition for metabolic studies.
Two-photon, label-free metabolic imaging
Images were acquired using a Leica TCS SP8 microscope equipped with a tunable femtosecond laser (InSight Deep See; Spectra-Physics; Mountain View, California) that operated from 680 to 1300 nm, utilizing a water-immersion 25× objective with a numerical aperture of 0.95. Spectral images were acquired at 755 and 860 nm excitation within the 390–740 nm emission range, using a 10 nm bandwidth and a 10 nm step size, with a descanned HyD detector. TPEF and second harmonic generation (SHG) images (1024 × 1024 pixels, 465 × 465 μm) were acquired at both 755 and 860 nm excitation using four non-descanned detectors, which collected light at the following emission ranges: 430 ± 12 nm for SHG imaging at 860 nm excitation, 460 ± 25 nm, 525 ± 25 nm, and 624 ± 20 nm for mCherry autofluorescence at 755 nm excitation. Illumination power gradients were measured prior to each imaging session. Across all sessions, the incident power at the sample varied from 17.8 to 20.6 mW at 755 nm and 33.1–34.3 mW at 860 nm because of laser-output drift. Minor ROI-to-ROI fluctuations were compensated by scaling the incident power for each ROI with the real-time laser-output values logged in the microscope metadata. Eight-frame averages were acquired from each optical section at a 600 Hz scan rate. For intensity and fluorescence lifetime imaging (FLIM), the same volumes of interest were captured using four sequential 2D optical sections spaced 4 μm apart, resulted in a 465 × 465 × 12 μm3 volume. Spectral data were acquired from a single optical section within this volume. Three regions of interest (ROIs) were imaged in different areas of each scaffold to capture cellular morpho-functional heterogeneity in these tissue models. Following the acquisition of intensity data, FLIM measurements were collected at the same optical sections using 755 nm excitation, with emission collected at 460 ± 25 nm and 525 ± 25 nm with a 1-min integration time, utilizing a Picoquant Picoharp 300 time-correlated single photon counter and SymPhoTime analysis software. Instrument response function (IRF) and timing calibration were established using a 0.1 mg mL−1 umbelliferone solution prepared in Tris-buffered saline (pH 7.4). Finally, spectral acquisition was performed, with two to three ROIs acquired from each scaffold, requiring 2–3 min to complete a full spectral acquisition per wavelength. For each type of tissue, the same three scaffolds were imaged weekly or bi-weekly for a period of 11 weeks. The microscope stage was enclosed in an incubator stage chamber (Leica Microsystems) maintained at 37 °C and 5% CO2 to ensure physiological conditions during imaging. After each imaging session, tissues were put back to the original dish and maintained for further monitoring. Images were analyzed for data acquired from three independent monocultures and three independent NAM tissues weekly or biweekly from weeks 3 to 11 in culture. In total, data were acquired from 57 ROIs from neuronal monocultures and 72 ROIs from NAM tissues. A summary of imaging parameters is provided in Table S2.
Spectral analysis
Non-negative matrix factorization (NNMF) was utilized to extract cellular components from spectral shapes at both wavelengths using the nnmf function, as detailed in the MATLAB Documentation (MathWorks, 2023). NNMF decomposed each spectrum into two matrices—one representing the spectral features of N components and another containing the corresponding weights for each component. The microscope was equipped with a 650 nm short-pass filter to prevent detection of the 755 nm excitation light. This filter introduced artifacts in the detection of emissions beyond 620 nm. These artifacts were not present in spectra acquired at 860 nm excitation, where an 815 nm short-pass filter was used instead. However, to maintain consistency across conditions, we performed spectral deconvolution only within the 390–620 nm range. In total, following ISBA-based cell segmentation as described in Supplementary Material (SM2), we included 69 spectra from neuronal monocultures and 95 spectra from NAMs, acquired from weeks 2 to 11 of culture. The procedures we followed to determine the number of key fluorophores and their relative contributions are detailed in Supplementary Material (SM3).
Two-photon image analysis
All two-photon intensity data underwent pre-processing to correct for illumination power fluctuations and detector gain variations before metabolic quantifications. Spectral data were then processed to isolate cell locations (SM2) and to perform spectral decomposition (SM3). The analysis pipeline included cell feature annotations, lipofuscin quantification, optical redox ratio (RR) assessments, PSD-based mitochondrial clustering characterization, and phasor fluorescence lifetime analysis (FLIM).
Before quantifying metabolic parameters, all two-photon intensity data were subjected to a pre-processing routine to account for illumination power and detector gain calibrations. Following calibration, spectral data were processed to isolate cell locations for subsequent spectral decomposition, as detailed in Supplemental Methods. Intensity-based TPEF image analysis included (a) lipofuscin pixel identification and quantification, (b) optical redox ratio assessments based on NAD(P)H and flavin contributions, and (c) power-spectral density (PSD)-based analysis of the NAD(P)H intensity images to characterize the levels of mitochondrial clustering. Phasor analysis was performed by applying cosine and sine transformations to the fluorescence lifetime curves, generating g and s coordinate maps for each pixel. See further details below.
Cell feature annotations
Cell annotations were manually performed using Napari software on integrated intensity images from the 755ex/460em, 755ex/525em, 860ex/460em, and 860ex/525em detectors. Neurons were annotated based on their distinct round shapes. Corresponding transmittance images were used to identify highly scattering features, which likely represented debris from dead or distressed microglia or astrocytes, ensuring that such objects were not annotated. Microglia were identified and annotated based on the presence of mCherry signals in the 755ex/624em channel, focusing on cells with distinct outlines and visible branches; cells with ambiguous outlines were excluded. Astrocytes were identified based on their features, including a non-round shape, absence of mCherry signal in the 755ex/624em channel, and larger size compared to neurons. Neurons typically had a maximum soma diameter of several microns. When annotating astrocytes, we took care to consider their proximity or overlap with microglia or other cells, especially in cases where cell outlines were ambiguous. Analysis of the intensity and FLIM images was performed separately for each cell class identified within a given image stack. In monocultures, 6261 neurons were annotated. In tricultures, 3137 neurons, 368 astrocytes, and 587 microglia were annotated. The number of cells within each 3D volume was quantified using MATLAB’s bwconncomp function with 26-connectivity, which identified and counted connected voxel components corresponding to individual cells.
Image co-registration for 755 and 860, and for intensity and FLIM
To ensure results were calculated from the same cell volume for the two wavelengths, we determined adjustments for the focal plane differences of the objective at 755 and 860 nm. Specifically, for this dataset, there was a 4 μm offset in the z-direction between 755 and 860 nm data collection, so we paired the second layer of 755 nm data with the 860 nm data. FLIM data were acquired for co-registered locations with the intensity data, but there was a system shift horizontally by 4 pixels relative to the intensity data. Therefore, we shifted the annotations made based on intensity images by 4 pixels to extract the cell features for FLIM analyses.
Lipofuscin quantification
Based on the spectral decomposition results, we examined the ratio of the pixel intensities at the 860/525 nm and 755/525 nm detectors within all annotated cells, and we assigned all pixels with ratios higher than 0.8 to lipofuscin. For a given ROI, we reported the integrated intensity from all four images (755 nm, 860 nm excitations and 460 nm, 525 nm emissions), normalized to the corresponding number of pixels occupied by cells.
Optical redox ratio assessments
Following lipofuscin pixel identification and removal, we considered the relative intensities of the signals detected in the 755ex/460em, 755ex/525em, 860ex/460em, and 860ex/525em detectors, and we utilized the spectral shapes of NAD(P)H and flavins identified from the spectral decomposition results to quantify contributions from NAD(P)H and flavins in the imaged volumes, as described in Supplementary Methods (SM7). The pixel-wise redox ratio was calculated using the formula
$${{rm{FP}}}/({{rm{FP}}}+{{rm{NAD}}}({{rm{P}}}){{rm{H}}})$$
(1)
where “FP” included contributions from both LipDH and FAD.
For each 3D volume, for each cell feature, we sorted all the cellular redox ratio values into a histogram ranging from 0 to 1, with a bin size of 0.1; therefore, the redox distribution had an abscissa representing redox ratio values and an ordinate representing the frequency of each redox ratio range. The distributions of redox ratio values were further analyzed to assess relative contributions using a 3-component NNMF model to obtain three different redox distributions that peaked at ~0.2, 0.45, and 0.8 redox ratio values, corresponding to low, mid, and high RRs, respectively (Fig. 1Dg). This segmentation utilized a methodology analogous to that demonstrated in our previous work, where the redox distribution was decomposed into three different Gaussian components, with the higher redox component serving as a sensitive metric of oxidative stress69. The overall optical redox ratio was calculated from the ratio of the average FP and NAD(P)H contributions assessed from the whole field, not the pixel-wise calculations.
PSD-based mitochondrial clustering characterization
To evaluate mitochondrial clustering, we applied PSD analysis, a Fourier-transform-based approach that quantified spatial intensity fluctuations of NAD(P)H fluorescence28,32. For each 3D volume, NAD(P)H images of individual cells, post-lipofuscin removal, were cloned and randomly positioned within vacant regions of the image field (clone-stamping) to mitigate distortions from cell borders. PSD was computed as the squared amplitude of the 2D Fourier transform, and its decay profile reflected mitochondrial dynamics. The segment from 0.18 μm−1 to the frequency corresponding to 98% of the total PSD area (Fig. 1Dd) was fit using the power-law function:
$$Rleft(kright)=A{k}^{-beta }$$
(2)
where R(k) was the PSD fit, k was the spatial frequency magnitude, β was the power-law exponent, and A was a constant. Higher β values indicated increased mitochondrial fragmentation (fission), while lower values reflected enhanced network formation (fusion), while lower values reflected enhanced network formation (fusion), as validated in numerous previous studies28,31,32,38. Because clone-stamping introduced randomization, we performed it five times per image stack and computed the mean β as a quantitative measure of mitochondrial fragmentation.
Phasor fluorescence lifetime analysis
The phasor approach converted time-domain FLIM data into frequency-domain coordinates using sine and cosine transforms (Eq. 3), enabling direct visualization of complex lifetime distributions without requiring predefined exponential models61.
$$G(m,n){=}frac{mathop{{int }}^{{T}}_{{0}}{c}{o}{s}(omega t){* }{{I}}_{{m}{,}{n}}(t){d}{t}}{mathop{{int }}^{{T}}_{{0}}{{I}}_{{m}{,}{n}}(t){d}{t}};S{(}m{,},n{)}{=}frac{mathop{{int }}^{{T}}_{{0}}{s}{i}{n}(omega t){* }{{I}}_{{m}{,}{n}}(t){d}{t}}{mathop{{int }}^{{T}}_{{0}}{{I}}_{{m}{,}{n}}(t){d}{t}};$$
(3)
In Eq. 3, G(m,n) and S(m,n) represented the phasor coordinates for each pixel (m,n) in the FLIM image, where I(m,n)(t) was the fluorescence intensity decay at that pixel over time t. The angular frequency ω was defined as ω = 2πƒ, where f, the laser repetition rate in this study was 80 MHz. The transformation is typically performed at this fundamental frequency as it typically provides the most robust signal-to-noise ratio and ensures one-to-one mapping between single exponential decays and points along the universal semicircle, with shorter lifetimes positioned near (1,0) and longer lifetimes closer to (0,0)95. Because both numerator and denominator in Eq. 3 are photon counts, all downstream quantities, including bound-fraction projections and the ({{{rm{tau }}}}_{{mean}}) reported throughout this paper, are intrinsically intensity-weighted rather than molar concentration-weighted.
All pixel phasors (({g}_{i}), ({s}_{i})) were first fitted to a straight line:
$${{rm{s}}}={{rm{ag}}}+{{rm{b}}}$$
(4)
and the two intersections between this line and the universal semicircle ({(g-0.5)}^{2}) + ({{{rm{s}}}}^{2}) = 0.25 yielded the reference phasors (({g}_{s},{s}_{s})) and (({g}_{L},{s}_{L})), corresponding to the short- and long-lifetime ends (({{{tau }}}_{S}) and ({{{rm{tau }}}}_{L})).
For any pixel phasor p = (g, s), the scalar projection onto the ({P}_{S}) → ({P}_{L}) axis was:
$${{boldsymbol{LLIF}}}={{boldsymbol{f}}}=frac{left[left({{rm{g}}}-{g}_{s}right)left({g}_{L}-{g}_{s}right)+left({{rm{s}}}-{s}_{s}right)left({s}_{L}-{s}_{s}right)right]}{left[{left({g}_{L}-{g}_{s}right)}^{2}+{left({s}_{L}-{s}_{s}right)}^{2}right]}$$
(5)
which defines the long-lifetime intensity fraction (LLIF); values outside [0,1] were clipped to 0 or 1 to suppress noise. ({tau }_{{{rm{S}}}}) and ({tau }_{L}) were obtained from the phase angles of the two intersection points.
The resulting ({tau }_{{mathrm{mean}}}) was then calculated as
$${{mathrm{Mean}}}; {{mathrm{intensity}}} – {{mathrm{weighted}}} ,{{mathrm{lifetime}}},({tau }_{{mathrm{mean}}})\ = ;{{mathrm{LLIF}}}* {tau }_{{{rm{L}}}}+(1-{{mathrm{LLIF}}})* {tau }_{{{rm{S}}}}$$
(6)
To ensure sufficient photon counts, time-dependent decays were binned into 56 ranges (223 ps each) and further averaged within 61 × 61-pixel windows (~55 × 55 µm), yielding ≥1000 photons per spectrum. For lipofuscin analyses, all ROIs from the same scaffold and week were pooled before line fitting (Fig. S18).
To characterize the heterogeneity within lifetime features, particularly due to variations predominantly observed along the g axis, these maps were also decomposed using NNMF into three different g components, shown in Fig. 1Ef, with maxima at ~0.34 (low G), ~0.4 (mid G), and ~0.46 (high G). Low G values (0.2–0.4) exhibited enhanced sensitivity to bound NADPH levels96, mid G values (0.34–0.47) were associated with enhanced OXPHOS activity, and high G (0.38–0.6) values were associated with enhanced glycolysis. A hypoxia experiment validated these correlations (SM8 and Fig. S11), and classifications were summarized in Table S2.
Plotting these (g, s) pairs in phasor space also enabled the extraction of ({{{rm{tau }}}}_{S}) and ({{{rm{tau }}}}_{L}), and the bound fraction of NAD(P)H, under the assumption of biexponential decay behavior28,38. Throughout both intensity-based and FLIM-based analyses, only manually annotated cellular regions were used to ensure accurate identification and classification of cell types.
Statistics and reproducibility
Two-tailed t-tests were used to compare metabolic function metrics between neurons in monocultures and co-cultures. ANOVA followed by Tukey’s post-hoc tests was used to assess significant differences across different weeks for each cell type, as well as among different cell types within the same week. Statistical analyses were conducted using JMP 17 (SAS Institute).
Quadratic discriminant analysis (QDA)
QDA was performed using the values of 12 metabolic function parameters derived from both intensity and FLIM analyses, as a means to reduce the data and visualize the metabolic states that each combination represented. The parameters included mitochondrial clustering, redox ratio, lipofuscin intensity, low RR, mid RR, high RR, low G, mid G, high G concentrations, NAD(P)H bound fraction, long lifetime, and short lifetime.
Ethics approval
All experimental procedures were approved by the Institutional Animal Care and Use Committee (IACUC) of Tufts University and were carried out in accordance with the NIH Guide for the Care and Use of Laboratory Animals.
Data availability
All data supporting the findings of this study are included in the main article and its Supplementary Materials. Raw data have been deposited in the Dryad repository under accession number https://doi.org/10.5061/dryad.w3r228149, and source data underlying all figures are provided in the Supplementary Data files. All other data are available from the corresponding author upon reasonable request.
Materials availability
hiNSCs used in this study were generated in the Kaplan lab under Tufts University Institutional Biosafety Committee-approved protocol 2020-M86. These cells are available upon reasonable request from the Kaplan lab (David.kaplan@tufts.edu). Such cells are also commercially available from Applied Biological Materials (Cat. No: T0441).
Code availability
Custom analysis scripts and figure-generation code have been deposited in Zenodo under accession number https://doi.org/10.5281/zenodo.17228894. Analyses were performed using standard MATLAB, R, and Python environments as detailed in the repository documentation. All code necessary to reproduce the results is available without restriction.
References
-
Bonvento, G. & Bolanos, J. P. Astrocyte-neuron metabolic cooperation shapes brain activity. Cell Metab. 33, 1546–1564 (2021).
-
Perez-Sala, D. & Pajares, M. A. Appraising the role of astrocytes as suppliers of neuronal glutathione precursors. Int. J. Mol. Sci. 24 https://doi.org/10.3390/ijms24098059 (2023).
-
Bernier, L. P. et al. Microglial metabolic flexibility supports immune surveillance of the brain parenchyma. Nat. Commun. 11, 1559 (2020).
-
Liu, L. R., Liu, J. C., Bao, J. S., Bai, Q. Q. & Wang, G. Q. Interaction of microglia and astrocytes in the neurovascular unit. Front. Immunol. 11, 1024 (2020).
-
Baxter, P. S. et al. Microglial identity and inflammatory responses are controlled by the combined effects of neurons and astrocytes. Cell Rep. 34, 108882 (2021).
-
Hirrlinger, J. & Dringen, R. The cytosolic redox state of astrocytes: maintenance, regulation and functional implications for metabolite trafficking. Brain Res. Rev. 63, 177–188 (2010).
-
Bouzier-Sore, A. K., Merle, M., Magistretti, P. J. & Pellerin, L. Feeding active neurons: (re)emergence of a nursing role for astrocytes. J. Physiol. Paris 96, 273–282 (2002).
-
Takahashi, S. Neuroprotective function of high glycolytic activity in astrocytes: common roles in stroke and neurodegenerative diseases. Int. J. Mol. Sci. 22 https://doi.org/10.3390/ijms22126568 (2021).
-
Andersen, J. V. et al. Astrocyte metabolism of the medium-chain fatty acids octanoic acid and decanoic acid promotes GABA synthesis in neurons via elevated glutamine supply. Mol. Brain 14, 132 (2021).
-
Ioannou, M. S. et al. Neuron-astrocyte metabolic coupling protects against activity-induced fatty acid toxicity. Cell 177, 1522–1535.e1514 (2019).
-
Vainchtein, I. D. et al. Astrocyte-derived interleukin-33 promotes microglial synapse engulfment and neural circuit development. Science 359, 1269–1273 (2018).
-
Shan, Y. et al. Integrated positron emission tomography/magnetic resonance imaging for resting-state functional and metabolic imaging in human brain: what is correlated and what is impacted. Front. Neurosci. 16, 824152 (2022).
-
Downes, D. P. et al. Characterization of brain metabolism by nuclear magnetic resonance. ChemPhysChem 20, 216–230 (2019).
-
Shahsavarani, S. et al. Cortex-wide neural dynamics predict behavioral states and provide a neural basis for resting-state dynamic functional connectivity. Cell Rep. 42, 112527 (2023).
-
Guo, S., Zhang, C. & Le, A. The limitless applications of single-cell metabolomics. Curr. Opin. Biotechnol. 71, 115–122 (2021).
-
Svatos, A. Single-cell metabolomics comes of age: new developments in mass spectrometry profiling and imaging. Anal. Chem. 83, 5037–5044 (2011).
-
Benisty, H. et al. Rapid fluctuations in functional connectivity of cortical networks encode spontaneous behavior. Nat. Neurosci. 27, 148–158 (2024).
-
Adler, A. et al. Sleep promotes the formation of dendritic filopodia and spines near learning-inactive existing spines. Proc. Natl Acad. Sci. USA 118 https://doi.org/10.1073/pnas.2114856118 (2021).
-
Ahn, S. J., Anrather, J., Nishimura, N. & Schaffer, C. B. Diverse inflammatory response after cerebral microbleeds includes coordinated microglial migration and proliferation. Stroke 49, 1719–1726 (2018).
-
Barros, L. F., Ruminot, I., Sandoval, P. Y. & San Martin, A. Enlightening brain energy metabolism. Neurobiol. Dis. 184, 106211 (2023).
-
Chia, T. H., Williamson, A., Spencer, D. D. & Levene, M. J. Multiphoton fluorescence lifetime imaging of intrinsic fluorescence in human and rat brain tissue reveals spatially distinct NADH binding. Opt. Express 16, 4237–4249 (2008).
-
Kasischke, K. A., Vishwasrao, H. D., Fisher, P. J., Zipfel, W. R. & Webb, W. W. Neural activity triggers neuronal oxidative metabolism followed by astrocytic glycolysis. Science 305, 99–103 (2004).
-
Yaseen, M. A. et al. Fluorescence lifetime microscopy of NADH distinguishes alterations in cerebral metabolism in vivo. Biomed. Opt. Express 8, 2368–2385 (2017).
-
Chance, B., Cohen, P., Jobsis, F. & Schoener, B. Intracellular oxidation-reduction states in vivo. Science 137, 499–508 (1962).
-
Mayevsky, A. & Chance, B. Metabolic responses of the awake cerebral cortex to anoxia hypoxia spreading depression and epileptiform activity. Brain Res. 98, 149–165 (1975).
-
Rocheleau, J. V., Head, W. S. & Piston, D. W. Quantitative NAD(P)H/flavoprotein autofluorescence imaging reveals metabolic mechanisms of pancreatic islet pyruvate response. J. Biol. Chem. 279, 31780–31787 (2004).
-
Shiino, A., Haida, M., Beauvoit, B. & Chance, B. Three-dimensional redox image of the normal gerbil brain. Neuroscience 91, 1581–1585 (1999).
-
Liu, Z. et al. Mapping metabolic changes by noninvasive, multiparametric, high-resolution imaging using endogenous contrast. Sci. Adv. 4, eaap9302 (2018).
-
Quinn, K. P. et al. Quantitative metabolic imaging using endogenous fluorescence to detect stem cell differentiation. Sci. Rep. 3, 3432 (2013).
-
Varone, A. et al. Endogenous two-photon fluorescence imaging elucidates metabolic changes related to enhanced glycolysis and glutamine consumption in precancerous epithelial tissues. Cancer Res. 74, 3067–3075 (2014).
-
Pouli, D. et al. Label-free, high-resolution optical metabolic imaging of human cervical precancers reveals potential for intraepithelial neoplasia diagnosis. Cell Rep. Med. 1 https://doi.org/10.1016/j.xcrm.2020.100017 (2020).
-
Pouli, D. et al. Imaging mitochondrial dynamics in human skin reveals depth-dependent hypoxia and malignant potential for diagnosis. Sci. Transl. Med. 8, 367ra169 (2016).
-
Xylas, J., Quinn, K. P., Hunter, M. & Georgakoudi, I. Improved Fourier-based characterization of intracellular fractal features. Opt. Express 20, 23442–23455 (2012).
-
Xylas, J. et al. Noninvasive assessment of mitochondrial organization in three-dimensional tissues reveals changes associated with cancer development. Int. J. Cancer 136, 322–332 (2015).
-
Levitt, J. M. et al. Diagnostic cellular organization features extracted from autofluorescence images. Opt. Lett. 32, 3305–3307 (2007).
-
Shiu, J. et al. Multimodal analyses of vitiligo skin identify tissue characteristics of stable disease. JCI Insight 7 https://doi.org/10.1172/jci.insight.154585 (2022).
-
Pham, D. L. et al. Development and characterization of phasor-based analysis for FLIM to evaluate the metabolic and epigenetic impact of HER2 inhibition on squamous cell carcinoma cultures. J. Biomed. Opt. 26 https://doi.org/10.1117/1.JBO.26.10.106501 (2021).
-
Liu, Z. et al. Label-free, multi-parametric assessments of cell metabolism and matrix remodeling within human and early-stage murine osteoarthritic articular cartilage. Commun. Biol. 6, 405 (2023).
-
Moreno-Garcia, A., Kun, A., Calero, O., Medina, M. & Calero, M. An overview of the role of lipofuscin in age-related neurodegeneration. Front. Neurosci. 12, 464 (2018).
-
Georgakoudi, I. & Quinn, K. P. Label-free optical metabolic imaging in cells and tissues. Annu. Rev. Biomed. Eng. 25, 413–443 (2023).
-
Brunk, U. T. & Terman, A. Lipofuscin: mechanisms of age-related accumulation and influence on cell function. Free Radic. Biol. Med. 33, 611–619 (2002).
-
Hakvoort, K. et al. Shedding light on human cerebral lipofuscin: an explorative study on identification and quantification. J. Comp. Neurol. 529, 605–615 (2021).
-
Chen, C. et al. In vivo near-infrared two-photon imaging of amyloid plaques in deep brain of Alzheimer’s disease mouse model. ACS Chem. Neurosci. 9, 3128–3136 (2018).
-
Chance, B. & Williams, G. R. Respiratory enzymes in oxidative phosphorylation. I. Kinetics of oxygen utilization. J. Biol. Chem. 217, 383–393 (1955).
-
Turrens, J. F. Mitochondrial formation of reactive oxygen species. J. Physiol. 552, 335–344 (2003).
-
Murphy, M. P. How mitochondria produce reactive oxygen species. Biochem. J. 417, 1–13 (2009).
-
Brand, M. D. The sites and topology of mitochondrial superoxide production. Exp. Gerontol. 45, 466–472 (2010).
-
Liaudanskaya, V. et al. Mitochondria dysregulation contributes to secondary neurodegeneration progression post-contusion injury in human 3D in vitro triculture brain tissue model. Cell Death Dis. 14, 496 (2023).
-
Cairns, D. M. et al. Expandable and rapidly differentiating human induced neural stem cell lines for multiple tissue engineering applications. Stem Cell Rep. 7, 557–570 (2016).
-
Cairns, D. M. et al. A 3D human brain-like tissue model of herpes-induced Alzheimer’s disease. Sci. Adv. 6, eaay8828 (2020).
-
Liaudanskaya, V. et al. Modeling controlled cortical impact injury in 3d brain-like tissue cultures. Adv. Health. Mater. 9, e2000122 (2020).
-
Snapper, D. M. et al. Development of a novel bioengineered 3D brain-like tissue for studying primary blast-induced traumatic brain injury. J. Neurosci. Res. 101, 3–19 (2023).
-
Rouleau, N. et al. A long-living bioengineered neural tissue platform to study neurodegeneration. Macromol. Biosci. 20, e2000004 (2020).
-
Piehler, T. et al. Effects on neurons and hippocampal slices by single and multiple primary blast pressure waves from detonating spherical cyclotrimethylenetrinitramine (RDX) explosive charges. Mil. Med. 183, 269–275 (2018).
-
Mansour, A. A. et al. An in vivo model of functional and vascularized human brain organoids. Nat. Biotechnol. 36, 432–441 (2018).
-
Shi, W. et al. Design and evaluation of an in vitro mild traumatic brain injury modeling system using 3D Printed mini impact device on the 3D cultured human iPSC derived neural progenitor cells. Adv. Health. Mater. 10, e2100180 (2021).
-
Pavlou, G. et al. Engineered 3D human neurovascular model of Alzheimer’s disease to study vascular dysfunction. Biomaterials 314, 122864 (2025).
-
Hamilton, K. A. & Santhakumar, V. Current ex vivo and in vitro approaches to uncovering mechanisms of neurological dysfunction after traumatic brain injury. Curr. Opin. Biomed. Eng. 14, 18–24 (2020).
-
Morrison, B. 3rd, Elkin, B. S., Dolle, J. P. & Yarmush, M. L. In vitro models of traumatic brain injury. Annu. Rev. Biomed. Eng. 13, 91–126 (2011).
-
Xie, R. et al. A comprehensive review on 3D tissue models: Biofabrication technologies and preclinical applications. Biomaterials 304, 122408 (2024).
-
Digman, M. A., Caiolfa, V. R., Zamai, M. & Gratton, E. The phasor approach to fluorescence lifetime imaging analysis. Biophys. J. 94, L14–L16 (2008).
-
Zhang, Y. et al. Factors associated with obesity alter matrix remodeling in breast cancer tissues. J. Biomed. Opt. 25, 1–14 (2020).
-
Huang, S., Heikal, A. A. & Webb, W. W. Two-photon fluorescence spectroscopy and microscopy of NAD(P)H and flavoprotein. Biophys. J. 82, 2811–2825 (2002).
-
Sanchez-Hernandez, A., Polleys, C. M. & Georgakoudi, I. Formalin fixation and paraffin embedding interfere with the preservation of optical metabolic assessments based on endogenous NAD(P)H and FAD two-photon excited fluorescence. Biomed. Opt. Express 14, 5238–5253 (2023).
-
Chorvat, D. Jr & Chorvatova, A. Spectrally resolved time-correlated single photon counting: a novel approach for characterization of endogenous fluorescence in isolated cardiac myocytes. Eur. Biophys. J. 36, 73–83 (2006).
-
Tang-Schomer, M. D. et al. Bioengineered functional brain-like cortical tissue. Proc. Natl Acad. Sci. USA 111, 13811–13816 (2014).
-
Ghosh, S., Castillo, E., Frias, E. S. & Swanson, R. A. Bioenergetic regulation of microglia. Glia 66, 1200–1212 (2018).
-
Gumbs, S. B. H. et al. Human microglial models to study HIV infection and neuropathogenesis: a literature overview and comparative analyses. J. Neurovirol. 28, 64–91 (2022).
-
Stuntz, E. et al. Endogenous two-photon excited fluorescence imaging characterizes neuron and astrocyte metabolic responses to manganese toxicity. Sci. Rep. 7, 1041 (2017).
-
Blacker, T. S. et al. Separating NADH and NADPH fluorescence in live cells and tissues using FLIM. Nat. Commun. 5, 3936 (2014).
-
Jimenez-Blasco, D., Santofimia-Castano, P., Gonzalez, A., Almeida, A. & Bolanos, J. P. Astrocyte NMDA receptors’ activity sustains neuronal survival through a Cdk5-Nrf2 pathway. Cell Death Differ. 22, 1877–1889 (2015).
-
Becerra-Calixto, A. & Cardona-Gomez, G. P. The role of astrocytes in neuroprotection after brain stroke: potential in cell therapy. Front. Mol. Neurosci. 10, 88 (2017).
-
Lopez-Fabuel, I. et al. Aberrant upregulation of the glycolytic enzyme PFKFB3 in CLN7 neuronal ceroid lipofuscinosis. Nat. Commun. 13, 536 (2022).
-
Rozanowska, M. B. Lipofuscin, its origin, properties, and contribution to retinal fluorescence as a potential biomarker of oxidative damage to the retina. Antioxidants 12, 2111 (2023).
-
Eichhoff, G., Kovalchuk, Y., Varga, Z., Verkhratsky, A. & Garaschuk, O. in Calcium Measurement Methods (eds A. Verkhratsky & O. H. Petersen) 205–220 (Humana Press, 2010).
-
Rozanowska, M. B. & Rozanowski, B. Photodegradation of lipofuscin in suspension and in ARPE-19 cells and the similarity of fluorescence of the photodegradation product with oxidized docosahexaenoate. Int. J. Mol. Sci. 23, 922 (2022).
-
Palczewska, G. et al. Noninvasive multiphoton fluorescence microscopy resolves retinol and retinal condensation products in mouse eyes. Nat. Med. 16, 1444–1449 (2010).
-
Palczewska, G., Wojtkowski, M. & Palczewski, K. From mouse to human: accessing the biochemistry of vision in vivo by two-photon excitation. Prog. Retin Eye Res. 93, 101170 (2023).
-
Lochocki, B. et al. Multimodal, label-free fluorescence and Raman imaging of amyloid deposits in snap-frozen Alzheimer’s disease human brain tissue. Commun. Biol. 4, 474 (2021).
-
Yakovleva, M. A. et al. Fluorescence characteristics of lipofuscin fluorophores from human retinal pigment epithelium. Photochem. Photobiol. Sci. 19, 920–930 (2020).
-
Gomez, C. A., Fu, B., Sakadzic, S. & Yaseen, M. A. Cerebral metabolism in a mouse model of Alzheimer’s disease characterized by two-photon fluorescence lifetime microscopy of intrinsic NADH. Neurophotonics 5, 045008 (2018).
-
Xiao, W., Wang, R. S., Handy, D. E. & Loscalzo, J. NAD(H) and NADP(H) redox couples and cellular energy metabolism. Antioxid. Redox Signal 28, 251–272 (2018).
-
Bonora, M. et al. A mitochondrial NADPH-cholesterol axis regulates extracellular vesicle biogenesis to support hematopoietic stem cell fate. Cell Stem Cell 31, 359–377.e310 (2024).
-
Forstermann, U. & Sessa, W. C. Nitric oxide synthases: regulation and function. Eur. Heart J. 33, 829–837 (2012).
-
Wang, X. X. et al. NADPH is superior to NADH or edaravone in ameliorating metabolic disturbance and brain injury in ischemic stroke. Acta Pharmacol. Sin. 43, 529–540 (2022).
-
Raps, S. P., Lai, J. C., Hertz, L. & Cooper, A. J. Glutathione is present in high concentrations in cultured astrocytes but not in cultured neurons. Brain Res. 493, 398–401 (1989).
-
Bolanos, J. P. & Almeida, A. The pentose-phosphate pathway in neuronal survival against nitrosative stress. IUBMB Life 62, 14–18 (2010).
-
Lu, W., Wang, L., Chen, L., Hui, S. & Rabinowitz, J. D. Extraction and quantitation of nicotinamide adenine dinucleotide redox cofactors. Antioxid. Redox Signal 28, 167–179 (2018).
-
Cairns, D. M. et al. Repetitive injury induces phenotypes associated with Alzheimer’s disease by reactivating HSV-1 in a human brain tissue model. Sci. Signal 18, eado6430 (2025).
-
Xu, K., Boas, D. A., Sakadzic, S. & LaManna, J. C. Brain tissue PO(2) measurement during normoxia and hypoxia using two-photon phosphorescence lifetime microscopy. Adv. Exp. Med. Biol. 977, 149–153 (2017).
-
Fernandez, E. et al. Transcriptomic and metabolic signatures of neural cells cultured under a physiologic-like environment. J. Biol. Chem. 300, 107937 (2024).
-
Egger, D. et al. Development of a novel high-throughput culture system for hypoxic 3D hydrogel cell culture. Sci. Rep. 14, 9904 (2024).
-
Zunino, A. et al. Structured detection for simultaneous super-resolution and optical sectioning in laser scanning microscopy. Nat. Photonics 19, 888–897 (2025).
-
Hong, K. P., Spitzer, N. C. & Nicol, X. Improved molecular toolkit for cAMP studies in live cells. BMC Res. Notes 4, 241 (2011).
-
Torrado, B., Malacrida, L. & Ranjit, S. Linear combination properties of the phasor space in fluorescence imaging. Sensors 22 https://doi.org/10.3390/s22030999 (2022).
-
Zhang, Y. et al. Synergistic label-free fluorescence imaging and miRNA studies reveal dynamic human neuron-glial metabolic interactions following injury. Sci. Adv. 10, eadp1980 (2024).
Acknowledgements
The authors acknowledge funding from the Department of Defense Technology for the Warfighter Program (HU0001-20-2-0015), NIH R01 EB030061, NIH P30CA023108, NIH Research Infrastructure grant (NIH S10OD021624), NIH (P41EB027062), DoD (W911NF-23-1-0276), and DoD (W81XWH2211065). I.G. is a coauthor of a patent U.S. Patent No: 10,712,272, entitled System and Method for Assessing Cellular Metabolic Activity, issued on Jul 14, 2020.
Ethics declarations
Competing interests
I.G. is a co-inventor on U.S. Patent No. 10,712,272 (“System and Method for Assessing Cellular Metabolic Activity”). The remaining authors declare no competing interests.
Peer review
Peer review information
Communications Biology thanks Mohammad Yaseen and the other anonymous reviewer(s) for their contribution to the peer review of this work. Primary handling editor: Ophelia Bu. [A peer review file is available].
Additional information
Publisher’s note Springer Nature remains neutral with regard to jurisdictional claims in published maps and institutional affiliations.
Supplementary information
Rights and permissions
Open Access This article is licensed under a Creative Commons Attribution-NonCommercial-NoDerivatives 4.0 International License, which permits any non-commercial use, sharing, distribution and reproduction in any medium or format, as long as you give appropriate credit to the original author(s) and the source, provide a link to the Creative Commons licence, and indicate if you modified the licensed material. You do not have permission under this licence to share adapted material derived from this article or parts of it. The images or other third party material in this article are included in the article’s Creative Commons licence, unless indicated otherwise in a credit line to the material. If material is not included in the article’s Creative Commons licence and your intended use is not permitted by statutory regulation or exceeds the permitted use, you will need to obtain permission directly from the copyright holder. To view a copy of this licence, visit http://creativecommons.org/licenses/by-nc-nd/4.0/.
About this article

Cite this article
Zhang, Y., Savvidou, M., Liaudanskaya, V. et al. Multi-modal label-free imaging of cellular metabolism and oxidative stress in 3D brain tissue models. Commun Biol 8, 1737 (2025). https://doi.org/10.1038/s42003-025-09122-4
-
Received:
-
Accepted:
-
Published:
-
Version of record:
-
DOI: https://doi.org/10.1038/s42003-025-09122-4