
Main
Accurate protein quantification is essential for understanding the state of a biological system and translating those insights into diagnostic, prognostic and therapeutic advances. While genomics and transcriptomics offer valuable information and often serve as proxies for protein profiling, they fail to capture key aspects of protein biology, such as posttranscriptional regulation, differential translation, degradation and spatiotemporal dynamics1. This underscores the need for direct protein profiling approaches that generate data that reflect the full complexity of biological systems.
Existing proteomic tools face considerable limitations, including difficulty resolving proteins across their wide dynamic range of expression and capturing multiple proteoforms, posttranslational modifications and interactions in protein complexes. These challenges have prevented the development of broadly applicable, high-throughput and multiplexed protein analysis technologies that offer high fidelity, precision and cost-effectiveness.
Proteomics has made substantial strides in improving throughput and multiplexing. Mass spectrometry (MS)-based approaches are valuable for discovering proteins and posttranslational modifications but face limitations in throughput, sensitivity and a bias toward high-abundance proteins1. Sandwich immunoassays, or enzyme-linked immunosorbent assays (ELISAs), remain a mainstay for protein quantification in both research and clinical settings owing to their high specificity and quantitative output. This specificity is achieved through the combined use of a capture antibody and a detection antibody that bind the target analyte and produce a measurable signal.
Efforts to scale ELISAs for multiplexed detection across the proteome are hindered by reagent-driven cross-reactivity (rCR). rCR occurs when noncognate antibodies are mixed and incubated together, enabling combinatorial interactions that can form mismatched sandwich complexes from even a single nonspecific binding event. These interactions increase exponentially with the number of antibody pairs, elevating background noise and reducing assay sensitivity2,3. As a result, rCR remains the primary barrier to multiplexing immunoassays beyond ~25-plex, with many kits limited to ~10-plex and few exceeding 50-plex, even with careful antibody selection1,2,4.
To address rCR, platforms such as Olink’s proximity extension assay (PEA)5 and Somalogic’s SomaScan6 have been developed. PEA is known for its high specificity and sensitivity and reduces rCR impact by reporting only bispecific interactions via proximity-dependent DNA amplification and sequencing. SomaScan uses aptamer-based Somamers with multiple capture–release steps and detection through hybridization to DNA microarrays. Both can quantify thousands of proteins per assay and are increasingly adopted. However, converting protein binding into oligonucleotide signals remains costly, low-throughput, inflexible for target customization and not well suited for detecting posttranslational modifications or protein complexes.
We previously described methods that spatially separate miniature ELISAs to prevent antibody mixing and minimize rCR3,7,8. Yet, these approaches involved complex spotting protocols and had technical challenges with reproducibility and throughput, mirroring the trade-offs of PEA and SomaScan. A clear need remains for a platform that enables high-specificity, high-plex protein analysis without compromising throughput, cost efficiency or versatility.
Here, we introduce the nELISA, a next-generation bead-based assay platform that enables high-fidelity, high-plex protein detection by integrating two key technologies. We developed a novel sandwich immunoassay design, termed CLAMP (colocalized-by-linkage assays on microparticles), that eliminates rCR by preimmobilizing antibody pairs on microparticles and using a DNA-based detection-by-displacement mechanism. CLAMP supports quantification of protein levels as well as detection of posttranslational modifications and protein complexes.
We pair CLAMP with a scalable bead encoding–decoding system for flow cytometry, previously described by our group9, to create the nELISA. As a first demonstration, we developed a 191-plex inflammation-focused panel targeting low-abundance cytokines, chemokines and growth factors. We validated its sensitivity, specificity and reproducibility and profiled 191 proteins across 7,392 samples in under 1 week, highlighting its suitability for high-throughput screening (HTS).
We further integrated nELISA with Cell Painting to perform phenotypic screening of a reference compound set, demonstrating seamless compatibility with existing HTS workflows. Finally, we demonstrate that nELISA not only recapitulates hundreds of expected immune phenotypes in a single run but also uncovers novel insights with direct implications for drug discovery.
Results
CLAMP: miniaturized, rCR-free sandwich assay on microbeads
To address rCR and throughput limitations in multiplexed immunoassays, we developed CLAMP, a miniaturized ELISA on the surface of microparticles (Fig. 1). CLAMP departs from the classical sandwich ELISA in three key ways with (1) preassembled antibody pairs, (2) releasable detection antibodies and (3) conditional signal generation.

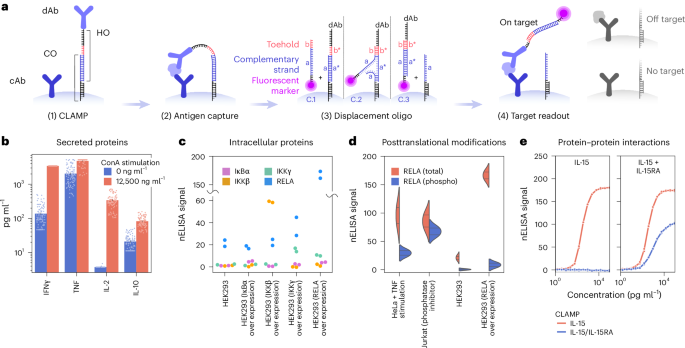
a, Each barcoded microparticle has preassembled, miniaturized ELISAs for a single target. (1) CLAMP: the detection antibody (dAb) is bound to a hook oligo (HO) that is tethered to the surface via partial hybridization with a capture oligo (CO) strand. (2) Antigen capture: the assay is carried out by incubating the biological sample with barcoded CLAMPs generating sandwich binding in the presence of the target analyte only. (3) Displacement oligo: after washing, a fluorescently labeled displacement oligo (DO) is added to displace HOs from their prehybridized COs via toehold-mediated displacement. The toehold region on DO (b) binds the complementary single-stranded region (b*) on HO, initiating strand displacement. This interaction unzips CO (a) from its complementary HO sequence (a*), as DO (a) replaces it, releasing HO from CO and fluorescently labeling it. (4) Target readout: labeling of the sandwich complexes that remain on the surface due to target presence and sandwich formation (left) or washing away of the dAb-DO hybrid in the case of off-target binding/absence of target (right). cAb, capture antibody. b–e, Examples of nELISA configurations enabling multiplexed measurements. b, Secreted proteins. Increased levels of inflammatory markers IL-2 and IL-10 upon stimulation of PBMCs with ConA at 0 ng ml−1 and 12,500 ng ml−1; n = 108 samples from 6 donors for each stimulation condition; Bar height represents the mean; error bars indicate the s.e.m. c, Intracellular proteins. Configuration is identical to that of secreted proteins, but with antibodies targeting intracellular proteins; swarm plot with nELISA measurements (n = 2) of total levels of indicated proteins in HEK293 cells or HEK293 cells overexpressing one of the target proteins. d, Posttranslational modification. The dAb is specific to a PTM (for example, phosphorylation); shown are violin plots with measurements (n = 2, indicated with line) for total RELA and phosphorylated RELA in cell lines with indicated treatments resulting in distinct levels of RELA expression and phosphorylation. e, Protein–protein interactions. Each antibody of an ELISA pair binds to a distinct member of a PPI; shown are four parameter logistic curve fits of total IL-15 and the IL-15–IL-15RA dimer with their respective sensors, in the presence of recombinant IL-15 (left) or IL-15–IL-15RA (right).
First, detection antibodies are preloaded onto their corresponding capture antibody-coated beads using flexible, releasable DNA oligo tethers (Fig. 1a, (1) CLAMP). Spatially confining antibody pairs to individual beads prevents noncognate interactions. Upon sample addition, target proteins bridge the antibody pairs, forming a ternary sandwich complex (Fig. 1a, (2) antigen capture).
Second, CLAMP enables detection via a novel detection-by-displacement mechanism using toehold-mediated strand displacement10. A fluorescently tagged displacer-oligo simultaneously releases the detection antibody from the bead surface and labels it (Fig. 1a, (3) displacement oligo), with a release efficiency of >98% (Supplementary Fig. 1).
Third, fluorescent signal is conditionally generated only when a target-bound sandwich complex is present: the displacement oligo both labels and releases the detection antibody, and the resulting complex remains anchored to the bead surface. By contrast, in the absence of target (or with nonspecific binding) the fluorescent probe is washed away, ensuring low background signal (Fig. 1a, (4) target readout).
During displacement, released detection antibody remain at femtomolar concentrations (orders of magnitude lower than in conventional assays) minimizing off-target binding (Supplementary Information, calculation 1). While the local antibody concentration at the bead surface is high to facilitate sandwich formation, the overall amount released remains extremely low due to the small number of microparticles (~50 per assay) and the limited antibody loading per bead. As a result, the detection antibody concentration in solution remains below the threshold of off-target binding, effectively preventing nonspecific interactions (Supplementary Information, calculation 1).
As the CLAMP format inherently excludes mismatched interactions by design, any potential cross-reactivity could only occur after antibody release, when antibody concentrations are femtomolar and transient. We tested CLAMPs with intentionally mismatched capture and detection antibodies (Supplementary Fig. 2). Even under high concentrations of PSA and uPA antigens, mismatched CLAMPs produced no quantifiable signal, while correctly matched CLAMPs yielded specific detection. These results reinforce the notion that nELISA’s dual-antibody recognition mechanism ensures high specificity, even under conditions designed to favor nonspecific interactions.
We present proof-of-concept experiments, demonstrating CLAMP’s versatility for detecting secreted and intracellular proteins, posttranslational modifications and protein–protein interactions. (1) Secreted inflammatory markers were detected from peripheral blood mononuclear cells (PBMCs) stimulated with concanavalin A (ConA), a well-known T cell stimulus (Fig. 1b). (2) Intracellular targets were measured in HEK293 lysates overexpressing IκBα, IKKγ, IKKβ and RELA (Fig. 1c), confirming known stabilization of NF-κB components through partner overexpression (RELA and IKKγ stabilized each other). (3) Posttranslational modifications were detected using phospho-specific antibodies; phospho-RELA increased following TNF stimulation (NF-κB pathway activation) or phosphatase inhibition, while total RELA remained stable (Fig. 1d). CLAMPs distinguished total from phosphorylated IκBα and IKKβ, with total levels increasing upon overexpression (or co-expression with a binding partner for IκB-α), and phosphorylation rising in response to TNF stimulation or phosphatase inhibition (Supplementary Fig. 3). (4) Protein complexes, such as IL-15–IL-15RA, IL-12p70 (a heterodimer of IL-12p35 and IL-12p40) and IL-23 (IL-23p19 and IL-12p40), were detected using antibodies specific to each subunit (Fig. 1e and Supplementary Fig. 4). These data highlight CLAMP’s versatility in measuring soluble proteins, posttranslational modifications and protein interactions, capturing both intracellular signaling dynamics and intercellular communication.
nELISA: CLAMP + emFRET for high-throughput multiplexing
To fully harness the rCR-free multiplexing capacity of CLAMP, we combined it with our previously developed fluorescent barcoding method, emFRET9 (Fig. 2a). emFRET enables high-density bead barcoding by varying ratios of four standard fluorophores, AlexaFluor 488 (N1), Cy3 (N2), Cy5 (N3) and Cy5.5 (N4), to generate thousands of unique spectral signatures. The emFRET model predicts Förster resonance energy transfer (FRET) between dyes (Fig. 2b), allowing accurate prediction and decoding of barcode identities.

a, CLAMPs contain a ratio of fluorophore-conjugated oligos bound to the surface. The ratio of N1, N2, N3 and N4 dyes provides a unique spectral barcode assigned to a CLAMP for a specific protein target. Following sample incubation, the addition of a displacement oligo adds a fifth dye that is used for quantification. Barcoded CLAMPs are read out by high-throughput, four-laser flow cytometry. b, The emFRET model compensates for interdye energy transfer upon excitation (hv) of each spectral dye, such as energy transfer (E) from dye 1 to 2 (E12) upon excitation of dye 1. This enables accurate modeling of barcode positioning and decoding of each barcode to its target assay. c, Cytometry data showing mean fluorescence intensity (MFI) from a 384 spectral barcode universe. Each decoded barcode is labeled with a color. Markers (circle) of a matching color indicate the emFRET model prediction of the barcode position. Barcodes with spectral overlap in N1/N2 (left) are spectrally distinct in N3/N4 (inset shows barcodes outlined with dotted line). Likewise, barcodes with overlap in N3/N4 (right) are distinct in N1/N2 (inset).
For large-scale nELISA encoding, dyes N1–N4 are conjugated to DNA oligos in programmable ratios (0–70 parts per dye) using automated liquid handling. These are hybridized to complementary oligos on microparticles to produce spectrally barcoded beads. which are then assigned to specific protein targets and combined with their respective CLAMP reagents. Assembled CLAMPs are pooled and dispensed into 384-well plates for profiling.
Using just four partially overlapping dyes, we generated 384 distinct barcodes (Fig. 2c), with ambiguity resolved by orthogonal signal patterns across channels (Fig. 2c, insets). The fluorescent readout is compatible with flow cytometry, enabling rapid analysis in 384-well format. Our optimized workflow enables profiling of 1,536 wells per day on a single cytometer, demonstrating suitability for high-throughput multiplexed immunoassays. With additional dyes and further spectral optimization, the barcode space can be scaled to thousands, paving the way for the nELISA to profile thousands of proteins without sacrificing throughput.
Assay fidelity is maintained at high-plex
To demonstrate high-fidelity multiplexing, we built a 191-plex inflammation panel targeting cytokines, chemokines and growth factors (Supplementary Table 1). Secreted proteins were selected as a proof of concept due to their biological importance, low abundance and context-dependent effects—traits that require broad, multiplexed profiling to yield meaningful insights11.
To assess the ability of the nELISA and the spatial colocalization of capture and detection antibodies to overcome rCR common in conventional multiplexed sandwich assays (Fig. 3a), we directly compared single-plex and 191-plex measurements (Fig. 3b). Calibration curves in single-plex and 191-plex were indistinguishable, and measurements were highly correlated (R2 = 0.988), suggesting that nELISA measurements are insensitive to multiplexing.

a, A schematic representation of rCR in traditional multiplexed ELISAs and its abrogation by CLAMP. b, Correlation of signal-to-noise ratio (SNR) values for CLAMP(s) in 1-plex or 191-plex format; an example standard curve is also shown (inset). c, Spike-one-in assay: heatmap displays SNR values for each nELISA sensor in the 191-plex for each individually spiked antigen; diagonal displays specific signals; cross-reactive events are numbered. d, Leave-some-out assay: six pools of recombinant proteins consisting of either all the targets in the 191-plex panel (A1) or lacking a subset of targets (A2–A5) were profiled; outlined boxes indicate absence of target proteins; colors represent SNR. e, Overlaid standard curves for one example CLAMP (CCL5) using (red) standard and (blue) xDR protocols. f, Distribution of SNR values for all 191-plex across 80 cell culture supernatants from stimulated PBMCs quantified using (red) standard or (blue) xDR protocols. g, Distribution of the lower limits of detection (LLOD) and upper limits of detection (ULOD) of 191 sensors using standard or xDR protocols. h, Distribution of coefficients of variation (CV) of all nELISA sensors in repeat measurements of a single sample across wells in a single plate (well to well) and across plates profiled on different days (day to day). i, Cell culture supernatants from stimulated PBMCs were analyzed with nELISA and xMAP platforms; shown is the distribution of Spearman correlation coefficients for shared assays with detectable protein concentrations and an example of correlating IL-1β concentrations (inset). j, Cross-reactivity comparison on xMAP and nELISA platforms: 100 recombinant antigens were pooled and spiked in cell culture media at increasing concentrations; shown are the quantification of seven proteins that are not detectable in the sample using the nELISA (top) and xMAP (bottom).
We next tested for rCR using a ‘spike-one-in’ approach, where each recombinant antigen was spiked individually and measured with the full 191-plex panel. Among 36,000+ possible noncognate interactions, only 5 were detected (Fig. 3c); 3 had clear biological explanations due to shared epitopes (for example, IL-12 p40 detecting IL-12 p70 and IL-23; CXCL12α/β isoforms). Two unexpected cross-reactivities (CCL13 → CCL17 and CCL3 → PCSK9) are presumably due to sample cross-reactivity and would yield the same cross-reactivity in single-plex ELISA; this could be addressed by selecting alternative antibody pairs.
Detecting such rare cross-reactivities is traditionally laborious for ELISA developers. Our results show that nELISA could be leveraged to streamline and accelerate this process. We further confirmed specificity by ‘leave-some-out’ testing using pooled antigens missing select targets. Even in the presence of complex protein mixtures, rCR remained minimal in the presence of other abundant proteins (Fig. 3d). These results establish the specificity and quantitative accuracy of the 191-plex nELISA panel and show that its fidelity is maintained beyond the limits of conventional multiplex sandwich immunoassays.
Dynamic range, sensitivity and precision of the nELISA
To assess nELISA performance at 191-plex, we analyzed standard curves for each target. nELISA produced robust, sigmoidal dose–response curves resembling classical ELISA and remained resistant to the Hook effect up to 100 µg ml−1 (Fig. 3e), which can otherwise compromise quantification at high concentrations12. These properties enabled us to achieve extended dynamic range (xDR) by merging data from two dilutions (Methods), allowing accurate quantification of proteins up to 10 µg ml−1 without impacting throughput (Fig. 3e,f). At low analyte concentration, we observed limits of detection down to 0.1 pg ml−1 (Fig. 3g). Binding ranges were generally governed by antibody affinities, and we observed concordance between CLAMP and classical ELISA formats. Combined with xDR, nELISA achieved quantification across seven orders of magnitude, with each CLAMP spanning 3–5 logs.
nELISA signals are highly reproducible. Repeated measurements of the same sample across wells, plates and profiling days yielded low coefficients of variation of ~3% well to well and ~5% plate to plate and day to day (Fig. 3h). These minimal technical variabilities are substantially lower than typical biological variation and make nELISA well suited for large-scale cell-based screening.
To ensure long-term signal stability, nELISA assays include multiple controls (Supplementary Fig. 5). Each well includes a displacement control (non-human-targeting CLAMPs) to confirm signal dependence on target binding, and signal normalization controls (CLAMPs lacking a detection antibody that directly hybridize with the displacer oligo). A separate calibration plate includes (1) serial dilutions of recombinant antigens to generate standard curves for each CLAMP and (2) reference samples for quality control.
These controls consistently performed well across time and reagent lots, as shown by overlapping standard curves from different days (Supplementary Fig. 6) and stable quantification in reference samples across 42 nELISA runs using four independent CLAMP lots (Supplementary Fig. 7).
nELISA performance comparison with multiplex assays
To validate the ability of nELISA to quantify proteins in biological samples, we analyzed cell culture supernatants from PBMCs using the 191-plex nELISA and a 48-plex panel on the widely used xMAP platform. Among the 36 targets common to both assays, 24 were detected by both. Quantification of these shared targets showed strong agreement, with a median Spearman correlation of 0.92 (Fig. 3i and Supplementary Fig. 8). Leave-some-out testing revealed that discordant targets were often associated with high levels of rCR on the xMAP platform as off-target concentrations approached 1 ng ml−1 (Fig. 3j), illustrating the superior specificity of nELISA in multiplexed quantification.
We further benchmarked nELISA against Olink’s PEA. PBMCs from four donors were stimulated with four concentrations of lipopolysaccharide (LPS), ConA, polyinosinic:polycytidylic acid (poly(I:C)) or phorbol 12-myristate 13-acetate/ionomycin (PMA/i), or left unstimulated for 24 h. Secreted cytokines were quantified using both the 191-plex nELISA and the Olink Explore 384 Inflammation panel. Among the 85 overlapping targets, 36 were consistently detected above the limit of detection on both platforms, while 31 showed no expression on either (>95% of datapoints). Across all shared and expressed targets, we observed a median correlation above 0.95 (Supplementary Fig. 9), confirming strong concordance.
Together, these comparisons highlight the robustness and specificity of nELISA and demonstrate its strong performance relative to two of the most widely adopted multiplex protein profiling technologies, xMAP and Olink.
nELISA profiling of PBMC functional perturbation screen
To evaluate the utility of nELISA, we applied it to profile cytokine responses and interactions in PBMCs, an easily accessible and highly versatile immune cell population. PBMCs can be subjected to a wide range of experimental conditions, making them ideal for applications such as functional genomics, where tunable experimental inputs offer richer insights than the static snapshots provided by plasma or serum profiling13,14. However, the broad experimental flexibility of PBMCs also presents a major scaling challenge as conventional tools for protein-level cytokine profiling are constrained by high costs, limited throughput and narrow target panels. Although transcriptomics is often used to track cytokine responses, it may inaccurately reflect cytokine protein levels owing to extensive posttranscriptional and posttranslational regulation.
To illustrate nELISA’s potential, we profiled PBMCs from six donors stimulated with four different inflammatory agents across multiple doses. In addition, we screened 80 recombinant immunomodulatory proteins as perturbagens to further probe immune signaling, generating 7,392 high-content profiles of cytokines, chemokines and growth factors (Fig. 4a). Uniform manifold approximation and projection (UMAP) projection of the full dataset revealed clear phenotypic clustering by stimulation type, donor identity and stimulus concentration (Fig. 4b). Notably, several cytokine perturbagens with strong immunomodulatory effects (such as IL-4, IL-10, IL-1RA, IFNα2 and IFNβ) produced distinct phenotypic clusters (Fig. 4b, cytokine perturbation), underscoring the application of nELISA for high-throughput phenotypic screening of immune responses.

a, Screen design. PBMCs isolated from six donors were treated with inflammatory stimuli at indicated concentrations and further perturbed with 80 recombinant cytokine perturbagens, generating a total of 7,392 samples. After 24 h, concentrations of 191 secreted proteins were measured in the supernatant of each sample using the nELISA. b, UMAP dimensionality reduction of the data; data points are colored (from top left to bottom right) by stimulation condition, by donor, by stimulus concentration or by individual cytokine perturbagens with strong effects, as indicated. c, Correlation between cytokine interactions detected by nELISA and CytoSig in PBMCs, according to the fold change in expression of a protein in response to a perturbagen. Examples of cytokine response to IFNγ, IL-15, IL-4, IL-10 and perturbagens inducing CCL5 are indicated. d,e, PBMC response to myeloid and T cell stimulus; normalized signals represent differences in SNR compared with control wells; boxplot center line shows median; limits show upper and lower quartiles; whiskers show 1.5× interquartile range; points show outliers; n = 108 samples from 6 PBMC donors per stimulation condition; each sample was normalized to the donor-matched unstimulated control (n = 74 samples per donor): PBMC expression of indicated proteins, in response to myeloid stimuli (LPS or poly(I:C)), in the absence of recombinant cytokine perturbagens (d), and PBMC expression of indicated proteins, in response to T cell stimuli (ConA or PMA/i), in the absence of recombinant cytokine perturbagens (e). f,g, Fold change in the expression of IFNγ (f) and IL-1β (g) in response to indicated perturbagens, across all donors and stimulation conditions.
nELISA recapitulates classical immune responses
Different stimulatory agents preferentially activate distinct immune cell subsets within PBMCs, for example, myeloid versus T cells. As expected, myeloid-derived cytokines such as IL-1α and IL-1β were upregulated in response to myeloid-specific stimuli (Fig. 4d), while T cell-derived cytokines such as IL-17A and IL-2 increased following T cell stimulation (Fig. 4e). Cytokines produced by multiple cell types, including TNF and IFNγ, were elevated across all stimulation conditions15 (Fig. 4d,e).
Next, we analyzed cytokine interactions, defined as changes in PBMC-derived cytokine levels in response to recombinant cytokine perturbagens, measured across donors and stimulation contexts (Methods). Classic proinflammatory cytokines such as IFNγ and IL-1β were modulated by multiple perturbagens in ways consistent with known biology (Fig. 4f,g). For example, IFNγ increased following treatment with IFNα2, IFNβ, IL-2, IL-18, IL-15 and IL-7 (all known inducers of IFNγ)16,17,18,19, but was suppressed by anti-inflammatory cytokines IL-4 and IL-1020,21.
To further validate the biological fidelity of nELISA, we compared our cytokine interaction data with CytoSig, an established database of transcriptomic cytokine activity signatures22. While mRNA and protein levels often diverge, we expected that well-characterized immune responses would be reflected in both platforms. Indeed, among the 447 cytokine interactions detected by nELISA and 137 identified in CytoSig PBMC data, 45 were shared. Of these, 87% showed consistent directionality: 29 were upregulated and 10 were suppressed in both datasets (Fig. 4c). These included hallmark responses such as (1) the induction of IFNγ-responsive chemokines CXCL9 and CXCL10, and (2) the potent immunostimulatory effects of IL-15, which upregulated a broad panel of innate and adaptive cytokines (for example, IFNγ, TNF, CXCL9, CXCL10, CCL5, IL-17F, IL-22 and IL-1β) (Fig. 4c).
nELISA reveals cytokine insights beyond transcriptomics
Interestingly, the CytoSig dataset lacked several hallmark effects of TH1 and TH2 cytokine modulators. For example, the strong suppressive effect of IL-4 (a TH2 cytokine) on IFNγ, TNF and IL-1β was absent from the mRNA data, as was the ability of IL-4 to induce CCL22 and CCL2420,23,24,25. By contrast, nELISA data clearly captured these effects (Fig. 4c), detecting substantially more cytokine interactions in PBMCs than CytoSig (449 versus 137). This discrepancy is largely attributable to the inclusion of inflammatory stimuli in the nELISA data, enabling the detection of suppressive responses in cytokines with low baseline expression. Consequently, whereas 81% of CytoSig interactions reflect increases in expression, nELISA shows a more balanced profile. This may explain why CytoSig fails to capture many well-established anti-inflammatory effects of IL-10 on targets such as IFNγ, TNF, IL-1β, IL-12p40, CCL1, CCL3–CCL5, CCL19, CXCL5, G-CSF and MMP-126 (Fig. 4c).
Furthermore, CCL5 (a protein highly responsive to IFNγ) was robustly induced by IFNγ and IFNγ-associated conditions in the nELISA dataset. However, CytoSig failed to detect its induction by IL-2, IL-7, IL-18 and IFNα2/β (Fig. 4c). This may reflect posttranscriptional regulation of CCL5 by IFNγ27,28 or temporal differences in experimental design that mask secondary effects in CytoSig. Posttranscriptional regulation may also account for discrepancies in IL-1β measurements. Because IL-1β activation primarily occurs through cleavage and release of a presynthesized precursor29, transcriptomic methods like CytoSig may miss its dynamic changes. Consistent with this, IL-1β emerged as the most responsive protein in the nELISA PBMC screen, responding to 35 cytokines but showing responsiveness only to IL-15 and IFNβ in CytoSig (Fig. 4c).
Such posttranscriptional regulation probably underpins broader inconsistencies between CytoSig and nELISA. In six interactions, nELISA detected protein suppression where CytoSig showed mRNA upregulation, most notably for TNF, IL-1α, CCL2 and CXCL1. These cytokines are known to be regulated at the level of translation and mRNA stability30,31,32,33, potentially explaining the observed discordance. Overall, while nELISA aligns with known biology captured by transcriptomic databases like CytoSig, it may offer a more accurate reflection of signaling states at the protein level across cell populations.
nELISA adds mechanistic depth to phenotypic screening
Profiling the inflammatory secretome using nELISA is highly compatible with a wide range of downstream cell-based assays. After cell supernatants are collected and analyzed using nELISA, the remaining cells can subsequently undergo additional multiplex profiling, including assays targeting mRNA expression, chromatin accessibility or cellular morphology. Such multimodal approaches substantially enrich the biological insights gained from individual samples. To illustrate this capability, we combined nELISA with Cell Painting, a high-content imaging assay that captures detailed morphological phenotypes using fluorescent dyes targeting multiple cellular components, producing comprehensive image-based profiles of cell states34. Specifically, we applied this combined profiling strategy to A549 cells (human lung adenocarcinoma) prepared by the JUMP-Cell Painting Consortium35. These cells were treated with a library of 306 well-characterized compounds from the Broad Institute’s drug repurposing library, which includes extensive annotations of their gene targets and mechanisms of action (MOAs)36.
To assess how effectively each assay could identify compounds sharing known MOAs or gene targets, we leveraged the available compound annotations. We first evaluated the phenotypic activity of compounds based on their capacity to reproducibly generate distinctive profiles in replicate wells compared with vehicle-treated (dimethyl sulfoxide) controls. Compounds exhibiting high self-retrieval demonstrate highly reproducible and distinct phenotypes compared with control (vehicle-treated) wells, reflecting strong biological activity captured by the assay. Among these phenotypically active compounds, nELISA and Cell Painting independently retrieved MOA annotations with similar effectiveness, achieving MOA retrieval rates of 21–27% and gene target retrieval rates of 15–16%. As anticipated, Cell Painting detected phenotypic activity in more compounds overall, probably due to the limited secretory response of unstimulated A549 cells (Supplementary Fig. 10). Importantly, the assays demonstrated distinct strengths: certain compounds’ MOAs were better identified by one platform or the other. Combining nELISA with Cell Painting therefore led to a substantial increase (approximately 33%) in overall MOA retrieval compared with either method alone, underscoring their complementary nature (Supplementary Fig. 10).
However, it is important to acknowledge the inherent limitations of relying solely on annotated MOA labels, which may be incomplete or insufficient to capture all biologically relevant effects. For example, within the annotated class of CDK inhibitors, nELISA revealed that one compound exhibited a notably distinct secretome profile compared with other class members. Further analysis indicated that the selective specificity of this compound for CDK437 resulted in a secreted protein profile that was unique from the rest of the class (Supplementary Fig. 11). These findings showcase the ability of nELISA to enhance conventional compound annotation by generating rich, complementary data from the same samples.
To further leverage the unbiased capabilities of nELISA without reliance on existing annotations, we reanalyzed the dataset based purely on the similarity of cytokine response profiles, without a priori knowledge of MOAs or gene targets (Methods). This annotation-free approach uncovered additional mechanistic relationships. For instance, CHK inhibitors AZD7762 and 7-hydroxystaurosporine clustered closely together, alongside the Aurora B/C kinase inhibitor GSK1070916 (Supplementary Fig. 12). This grouping aligns well with known biological pathways, as Aurora B functions downstream of CHK138. Indeed, GSK1070916 treatment partially mimicked the secretome profile elicited by CHK inhibition, characterized by decreased IL-11, CXCL16, TNFR1 and FLRG expression, accompanied by increased MIF expression (Supplementary Fig. 12). Conversely, pan-Aurora kinase inhibitors AMG900 and danusertib did not cluster with GSK1070916, further highlighting the distinctive molecular effects of these compounds39. Collectively, these findings illustrate the substantial added value of integrating nELISA with high-content imaging assays like Cell Painting, enhancing mechanistic insights and the resolution of complex phenotypes in drug discovery screens.
nELISA identifies cytokines with similar response profiles
To assess whether nELISA could uncover consistent cytokine response profiles across diverse donor backgrounds and stimulus conditions, we applied our similarity analysis pipeline to the PBMC screen data. Specifically, we calculated the fold change in expression for each protein within our 191-plex panel in response to each cytokine perturbagen, considering all donors within a given stimulation condition (Supplementary Fig. 13). We compiled results across all stimulation conditions to identify perturbagen effects that were reproducible and consistent. UMAP-based clustering highlighted perturbagens eliciting similar cytokine response profiles (Fig. 5b) and having underlying similar protein-expression profiles (Fig. 5a). While recombinant proteins can sometimes cause unintended immune activation due to bacterial impurities, the predictable and biologically coherent cytokine responses observed here indicate minimal interference from such contaminants.

a, Heatmap dendrogram of perturbagen effects on cytokine expression across all stimulation and donor conditions; the color scale indicates log2-transformed fold change (log2FC) for each sensor over no perturbagen control. Column coloring corresponds to clusters in b. b, UMAP of PBMC secretome phenotypes in response to perturbagens. The UMAP includes data across all stimulation and donor conditions, with clusters labeled based on shared features in the PBMC secretome. c, Applicability to drug repurposing, as seen by correlating effects of IFNβ and IL-1RA on unstimulated PBMCs. Shown are cytokines inhibited by both perturbagens, cytokines (IFNγ and CXCL10) induced by IFNβ but inhibited by IL-1RA, and the induction of IL-1RA by IFNβ (in log2FC). d,e, Markers of target engagement in response to chemokine perturbagens; boxplots are overlaid with datapoints; boxplot center line shows median; limits show upper and lower quartiles; whiskers show 1.5× interquartile range. Shown are the significantly regulated cytokines by C5a in unstimulated PBMCs (n = 6 from 6 unstimulated PBMC donors) (d) and by CX3CL1 in PBMCs stimulated with poly(I:C) at 400, 2,000 and 10,000 ng ml−1 (n = 18 from 6 PBMC donors) (e).
We observed clear and biologically interpretable clustering of classical immune response profiles. Notably, prototypical T helper 1 (TH1) and TH2 cytokine responses formed distinct but neighboring clusters, centered respectively around IFNγ (TH1) and IL-4 (TH2). The TH1 response was characterized primarily by elevated levels of IFNγ, CXCL10 and CCL5, whereas the TH2 response involved increased expression of CCL17, CCL22 and CCL24 (Fig. 5b). The close proximity of these two clusters can be explained by their shared suppression of innate inflammatory cytokines, such as IL-1β, TNF and G-CSF.
An additional notable cluster encompassed perturbagens including recombinant C5/C5a, EMMPRIN, GDNF, MMP-3, MMP-7, uPA, PTX3 and soluble FAS-L, which specifically suppressed IL-1β and TNF expression but had minimal impact on other cytokines. Another clearly defined cluster consisted of cytokines primarily inducing IFNγ, such as IL-2, IL-7, IL-15, IL-18, IL-23, IL-27 and CXCL12β. Interesting, the closely related isoform CXCL12α clustered separately with proteins mainly inducing IL-1β secretion, which was the largest cluster and included IL-1α, LIF, IL-33, PDGF-BB, sCD40L, CCL21, TRAIL and IL-17 isoforms (C/D/F) (Fig. 5a). The remaining clusters were defined by perturbagens that either induced TNF, IL-10 and IL-1α/β expression or selectively inhibited TNF and/or CCL24, highlighting diverse and nuanced cytokine regulatory patterns captured robustly by nELISA.
nELISA identifies cytokines with therapeutic relevance
Our analytical pipeline highlighted overlooked dimensions of cytokine biology, including chemokine functions beyond their traditional role in chemotaxis40. Chemokines such as CX3CL1, CCL1, CCL5, CCL11, CCL26, CXCL10, CCL24, CXCL12α/β and complement component C5a significantly modulated cytokine secretion, including IFNγ, TNF, IL-1β, GM-CSF and IL-10, even in the absence of a chemotactic gradient (Fig. 5a,d). Furthermore, these chemokine-driven cytokine responses exhibited clear stimulus dependence (Supplementary Fig. 13). These observations align with emerging evidence of broader chemokine roles extending beyond leukocyte migration, involving signaling pathways mediated by distinct G-protein interactions41. A prime example is CXCL12, previously identified as a T cell co-stimulatory factor operating via Gq and G11 pathways rather than the classical Gi protein-coupled chemotactic signaling42. Thus, nELISA provides critical molecular insights that could inform the development and therapeutic deployment of chemokine-based interventions.
Furthermore, nELISA-based clustering revealed functional similarities among therapeutic cytokines, uncovering potential avenues for drug repurposing. Notably, IL-1 receptor antagonist (IL-1RA, also known as IL-1RN) and IFNβ formed a distinct cluster due to their shared inhibitory effects on innate immune responses. However, unlike IFNβ, IL-1RA did not induce proinflammatory cytokines such as IFNγ and CXCL10 (Fig. 5a–c). This observation carries implications for multiple sclerosis treatment, as IFNβ, despite causing flu-like adverse effects, partially mediates its therapeutic efficacy through induction of IL-1RA43,44,45. Conversely, recombinant IL-1RA (anakinra), known for a favorable safety profile, is undergoing evaluation in a phase 1 clinical trial for multiple sclerosis46,47. Consistent with these clinical observations, our data revealed that IL-1RA inhibited the same inflammatory cytokines and chemokines as IFNβ, except for CCL22 and CCL24, while also suppressing IFNβ-induced cytokines thought to be harmful in multiple sclerosis, such as IFNγ and CCL7 (Fig. 5c). These findings support the rationale for anakinra’s therapeutic potential in multiple sclerosis and highlight the capability of nELISA protein profiling to inform therapeutic strategies and facilitate drug discovery.
Discussion
Although high-throughput genomic and transcriptomic tools have transformed our understanding of biological systems and disease, comparable approaches for protein profiling have lagged. Here, we described the development of nELISA, a high-throughput protein assay that leverages CLAMP to overcome rCR, a key limitation of traditional multiplex immunoassays. This enabled robust scaling to a 191-plex panel. Miniaturizing the ELISA onto bead surfaces enabled flow-cytometry-based readout on standard platforms, achieving throughputs of up to ~10,000 samples per week per cytometer (1 h per 384-well plate)48. nELISA maintains or exceeds conventional immunoassay performance, matching sensitivity, specificity and dynamic range while greatly reducing detection antibody usage. As reagents are a primary cost driver in protein profiling, this translates into substantial cost savings.
Given that protein levels more directly reflect cellular state and function than mRNA, high-throughput proteomics is essential for capturing comprehensive biological insights. This is especially true in cell-based assays where protein secretion and expression are tightly regulated at the posttranscriptional level. The nELISA is particularly well suited for these assays, offering sensitive and precise measurement of secreted proteins in response to perturbation. In addition, its nondestructive sampling capability enables temporal analysis of secretion dynamics, allowing clearer resolution of primary versus downstream biological effects without added experimental complexity.
We found that nELISA can robustly report biological activities in HTS across diverse types of perturbagens and cell models, highlighting its broad applicability. Its capacity to consistently capture biologically relevant phenotypes and cellular interactions underlines its potential value in extensive screening campaigns, including those involving gene modulation and immunotherapeutics. These characteristics position nELISA effectively for scaling to larger cohorts in extensive functional genomics and drug discovery efforts, such as those used in the Human Functional Genomics Project13.
Importantly, nELISA’s compatibility with complementary cell-based assays enriches phenotypic data by adding mechanistic depth at the protein level. Integration with other modalities, such as transcriptomics, functional assays (for example, cytotoxicity assays) or cell surface staining, enables comprehensive and cost-effective multimodal screening, greatly enhancing biological insights.
nELISA-based quantification of secreted proteins in response to chemokine stimulation offers a compelling alternative to chemotaxis assays for therapeutic chemokine development. Traditional chemotaxis assays suffer from low throughput and poor signal-to-noise ratios, making them challenging for screening applications49,50. By contrast, measuring protein expression changes via nELISA is both more scalable and robust. If these protein expression changes serve as reliable markers of target engagement, they could enhance various drug discovery efforts, including combinatorial screens, structure–activity relationship studies and pharmacodynamic assessments, where chemotaxis-based methods typically fall short. Furthermore, the ability of nELISA to cluster biologically similar responses may facilitate drug repurposing and mechanism-of-action studies.
As a cytometry-based technique, nELISA offers major cost and efficiency advantages over MS and sequencing-based proteomic platforms. High-plex MS is resource intensive, requiring elaborate sample preparation, costly reagents and specialized instrumentation, all of which increase the time and financial investment needed for large-scale studies. Similarly, methods such as SomaScan and PEA convert protein signals into oligonucleotide concentrations and rely on DNA microarrays or sequencing for readout, adding complexity, cost and time. By contrast, cytometry allows direct, multiplexed protein detection with faster turnaround and lower per-sample costs. While conventional bead-based immunoassays also use cytometry, they are constrained by rCR, often requiring multiple separate panels to reach higher plex levels. nELISA uniquely overcomes this limitation by combining the specificity of CLAMP with the parallelization power of cytometry, delivering truly multiplexed, single-run profiling. This makes it ideally suited for applications such as biomarker discovery, immune monitoring and clinical diagnostics.
While nELISA offers considerable advancements in protein profiling, its performance depends on the quality and availability of antibodies. Sensitivity is largely influenced by antibody affinity, which determines the lower detection limit for each target; antibodies with lower affinity may reduce assay sensitivity and dynamic range, particularly for low-abundance proteins. Some challenging targets, such as transient, unstable or subtly modified proteins, remain difficult to measure due to the limited availability of optimized antibodies. These considerations underscore the ongoing need for advances in antibody development, particularly to enhance detection of posttranslational modifications, thereby expanding the comprehensive protein coverage of the assay.
In conclusion, nELISA provides cost-effective, high-plex protein data, supporting its application in large-scale applications such as drug discovery. Its modular design, where each CLAMP functions as a self-contained sensor, and its scalable barcoding strategy make the system flexible and expandable. The 191-plex inflammation-focused panel presented here showcases the platform’s performance and sets the stage for future panels targeting the full secretome, intracellular proteins, posttranslational modifications and protein–protein interactions. These capabilities position nELISA to support diverse biological analyses of primary cells, organoids, organs-on-chips, and tissue samples with high throughput and efficiency.
Methods
This study did not involve human subjects, animal experimentation or the use of patient samples and therefore did not require ethical approval.
Recombinant sample generation
Recombinant protein stocks and protein pools (Nomic Bio) were prepared in sample buffer, consisting of RPMI and 10% fetal bovine serum (FBS), containing 1–191 proteins at 100 ng ml−1 per protein. For standard curves in single-plex and in multiplex, individual protein stocks and protein pools were serially diluted in sample buffer from 100 ng ml−1 to 0.1 pg ml−1 per protein. For ‘spike-one-in’ assays, individual protein solutions were prepared at 10 ng ml−1. For ‘leave-some-out’ assays, protein pools containing 130–191 proteins at 100 pg ml−1 per protein were prepared in Sample Buffer. Each pool contained either all the targets in the 191-plex panel or lacked a subset of targets in the 191-plex panel. For cross-reactivity comparisons with xMAP, protein pool A4 was serially diluted from 200 ng ml−1 to 0.1 pg ml−1 (per protein), and aliquots were stored at −80 °C for profiling by nELISA and xMAP platforms. For reproducibility testing, a reference cell culture supernatant sample was distributed across the wells of four 384-well plates; for each plate, nELISA profiling was performed on a different day, and variation was calculated across wells on the same day and across plates on different days.
Cell culture
PBMCs
Preparation, incubation and collection of cell supernatants from PBMCs was performed at the High-Throughput Screening Core Facility of the Institute for Research in Immunology and Cancer of the Université de Montréal. Frozen PBMCs from healthy donors (StemCell, Hu PB MNC, Cryo) were thawed in a 37 °C water bath and transferred to a 50-ml Falcon tube with 40 ml prewarmed medium (RPMI plus 10% FBS), centrifuged 10 min at 200g, then resuspended in 10 ml prewarmed medium. Viability was assessed by trypan blue exclusion (>95% viability for all donors), and 50,000 viable cells (25 µl at 2 million cells ml−1) were transferred to each well of a 384-well plate, containing 50 µl per well of prewarmed media ± stimulus ± perturbagens, and incubated for 24 h at 37 °C. Perturbagens (Nomic Bio) were present at 50 ng ml−1. For stimulation conditions, LPS (InvivoGen) was present at 5 ng ml−1, 100 ng ml−1 or 2,000 ng ml−1; poly(I:C) (InvivoGen) was present at 400 ng ml−1, 2,000 ng ml−1 or 10,000 ng ml−1; ConA (InvivoGen) was present at 5 ng ml−1, 2,500 ng ml−1 or 12,500 ng ml−1; for PMA/i (InvivoGen), PMA was present at 1 ng ml−1 or 5 ng ml−1, while ionomycin was present at 100 ng ml−1 or 500 ng ml−1. After 24 h, 70 µl of cell supernatant was collected per sample. Aliquots of 35 µl per sample were frozen in 384-well plates and shipped on dry ice for nELISA profiling at Nomic’s facilities or xMAP profiling at EVE Technologies facilities.
A549
A549 cells (ATCC CCL-185) were obtained from the American Type Culture Collection and cultured at the Broad Institute’s Center for the Development of Therapeutics. Cells were seeded in 4 replicate 384-well plates and cultured for 24 h in Dulbecco’s modified Eagle medium and 10% FBS in the presence or absence of reference compound library. Compounds were present at a single dose (5 μM). Supernatants were collected, frozen and shipped on dry ice to Nomic’s facilities for nELISA profiling. Cells were fixed and stained for Cell Painting as previously described51.
HEK293, HeLa and Jurkat
Cell lysates were purchased from commercial sources: HEK293 and HEK293-RELA overexpression lysates were from Origene, TNF-treated HeLa extracts were from Bio-Rad and phosphatase-treated Jurkat cells were from Cell Signaling Technologies. Aliquots of 35 µl per lysate sample were transferred into 384-well plates for nELISA profiling.
DNA oligos and tethers
All DNA oligos and tethers were purchased from BioIVT.
Barcoding oligos
Barcoding oligos were acquired with the sequence 5′-CACCGCCGCC ACAAAAAAAAA-[Dye]-3′ and a fluorescent dye (AlexaFluor 488, Cy3, Cy5, Cy5.5) at the 3′ end. Barcoding oligos are annealed to a biotinylated oligo on the surface of nELISA beads (with sequence 5′-Biotin-TTTTTTTTT GTGGCGGCGGTG-3′) in 10 μM in PBS plus 350 mM NaCl.
Capture oligos
Capture oligos have the sequence 5′-biotin-TTTTTTTTTGTGGCGGCGGTGATTGGTTATTGAGAGTTTATG-3′ and bind to the nELISA bead via the biotinylated 5′ end.
Hook oligos
Hook oligos with sequence 5′-ThioMC6-D/TTTTTTACT TTTCAACCA CCACTCAAC CATATTCAA AGCTTACGA TGCCGACTC ATTCGCCAT AAACTCTCA ATAACCAAT-3′ are terminated with a thiol modifier C6 CE-phosphoramidite (ThioMC6) at the 5′ end. Hook oligos are conjugated to a primary amine on a detection antibody by reduction of the hook oligo thiol modifier with dithiothreitol and activation with sulfosuccinimidyl 4-(N-maleimidomethyl)cyclohexane-1-carboxylate (sulfo-SMCC) to form a reactive NHS-ester. Forty microliters of 30 μM thiol-modified HOs are reduced in 200 mM dithiothreitol in PBST at 37 °C for 1 h. Reduced oligos are (1) buffer-exchanged into PBS pH 7.0 using a Zeba desalting spin-column (7 kDa molecular mass cutoff, Thermo), (2) activated for 10 min using 8 μl of 9 mM sulfo-SMCC dissolved in 80% PBS pH 7.0 and 20% anhydrous dimethyl sulfoxide, (3) buffer-exchanged again into PBS pH 7.0 to remove excess sulfo-SMCC, and (4) a 1–10-μl fraction is reacted with 10 μl of 1 mg ml−1 antibodies. The reaction is left at room temperature for 1 h and incubated overnight at 4 °C. The conjugates are purified in two sequential steps: first antibody purification, followed by DNA purification.
Protein profiling
Samples of recombinant proteins or cell culture supernatants profiled using the nELISA were frozen and shipped on dry ice to Nomic’s Montreal facilities and profiled using the 191 nELISA assay targets and standard protocols. Barcoded CLAMPs were pooled and dispensed into 384-well plates at a concentration of approximately 200 beads per target per well. Sample plates were profiled by standard nELISA assay protocol (Supplementary Information, protocol 1) in batches of four plates per day. Cytometry data were spectrally decoded using emFRET to map each barcode to its target protein (Supplementary Fig. 14).
For cell lysates, protein profiling was performed using the standard nELISA assay protocol, with the following modifications: samples were diluted twofold in M-PER (Thermo Fisher Scientific) containing 1× protease/phosphatase inhibitor tablet (Thermo Fisher Scientific), 20 mM EDTA, 20 mM EGTA and 100 μg ml−1 salmon sperm DNA.
A batch of plates containing a dilution series of calibration standards of recombinant antigens (96-well plate format) was generated to be run with each batch of sample plates on the day of profiling. Recombinant antigens (×191) were divided into five groups, pooled and diluted from 225 ng ml−1 in a 16-point dilution series. Media-only blanks (×8) and reference samples (×8) were also included on the calibration standard plate. Calibration standards were fit to a four-parameter logistic curve to derive pg ml−1 values from fluorescence units.
Samples profiled using the xMAP platform were shipped frozen to EVE Technologies and analyzed using the Luminex Human Multiplex Cytokine Array/Chemokine Array 48-Plex (HD48) and standard protocols.
xDR protocol
To extend nELISA dynamic ranges, samples were profiled at two dilutions, 2× and 50×. Standard curves were extended by stitching the linear ranges of a real standard curve and a virtual, 25× diluted, standard curve. The sum of interpolated protein concentrations from the 2× and 50× dilutions was used to derive a single protein concentration for each sample.
Data analysis pipeline
To identify compounds with significant effects on A549 cells, we calculated the fold change in expression of each protein in the 191-plex over the levels in control wells. Proteins with a fold change >1.5 and P < 0.05 by Student’s t-test in any sample were considered significant; considering the exploratory nature of the experiment, no statistical correction was performed for multiple testing. Using the median value of the significant responses, clustergrams with hierarchical clustering were generated using cosine similarity (Python package: seaborn 0.13.2). UMAPs of the median fold change values were generated using cosine similarity dimensions = 2, spread = 1.3, minimum distance = 0.2, nearest neighbors = 4, Python package: scanpy 1.11.0).
To identify cytokine interactions in our PBMC assay, we accounted for stimulus- and donor-specific effects as follows. For each perturbagen in each stimulus and stimulus concentration condition, the median concentration of each secreted protein across donors was divided by the median concentration of donors in the same stimulus and stimulus concentration condition, but the absence of perturbagen, to obtain the fold change of all targets in response to all perturbagens in each condition. Significant cytokine interactions were defined by a fold change >1.5 and P < 0.05 by Student’s t-test; considering the exploratory nature of the experiment, no statistical correction was performed for multiple testing. In addition, for all significant cytokine interactions, the median fold change across all stimulation conditions was calculated to identify cytokine interactions common across stimulus conditions. Clustergrams with hierarchical clustering were generated using cosine similarity and the default parameters included in the Seaborn Python package. UMAPs were generated using cosine similarity with dimensions = 2, spread = 0.9, minimum distance = 0.8, nearest neighbors = 4 and the scanpy Python package.
To correlate significant cytokine interactions with the CytoSig database, we identified recombinant perturbagens and responding genes or proteins that were shared in both datasets to limit comparisons to shared experimental conditions. We also limited comparisons to experiments compiled in CytoSig that were generated using PBMCs to avoid cell-type-specific distinctions. Furthermore, only ‘high-confidence’ datasets were included in our analysis. For each cytokine interaction, consisting of a recombinant perturbagen and a resulting significant fold change in the expression of a PBMC-derived cytokine, nELISA and CytoSig results were correlated.
Evaluating retrieval performance of nELISA and Cell Painting
We use average precision to report the ability of nELISA and Cell Painting to predict chemical MOA. AP is an information retrieval metric that evaluates the effectiveness of a ranking system by calculating how accurately the system ranks items based on their relevance to a query.
We use average precision for two different tasks: (1) the ability of each perturbagen to retrieve its own replicates from among negative control profiles (phenotypic activity: ‘self-retrieval’) and (2) the ability of each perturbagen to retrieve its sister compounds (that is, compounds that share at least one common MOA or gene target) (phenotypic consistency: ‘MOA retrieval’ and ‘gene target retrieval’). We note that many compounds have multiple MOA and gene annotations rather than just one of each; in addition to the fact that annotations can be incorrect and incomplete, this makes the retrieval problem challenging and retrieval rates low for sets of compounds like ours that were not chosen for selectivity. Formally, average precision is the weighted mean of precision values across all ks, where k is the number of neighbors for a given class. The definition of class varies—each perturbation is the class while computing average precision for task 1, and each MOA or gene targeted by the compound is the class for computing average precision for task 2.
We measure similarity between perturbations using cosine similarity and develop the rank-ordered similarity of all other samples to the query using this metric. Finally, we average the average precision per class, termed mean average precision (for that class). For task 2, we first filter out those perturbations that cannot be retrieved relative to negative controls in task 1 and remove classes with only a single member. To set the threshold, we first calculate the P values of each mean average precision in task 1 using a permutation test; compounds with a significance level of less than 0.05 are discarded. We summarize the success rate of a task by calculating the fraction of classes that have a P value >0.05.
Reporting summary
Further information on research design is available in the Nature Portfolio Reporting Summary linked to this article.
Data availability
Cytokine Signaling (CytoSig) data for PBMCs is publicly available via the NIH National Cancer Institute at https://cytosig.ccr.cancer.gov/. The data matrix of human cytokine treatment response was downloaded at https://hpc.nih.gov/~Jiang_Lab/CytoSig/diff.merge.gz and corresponding metadata were downloaded at https://hpc.nih.gov/~Jiang_Lab/CytoSig/meta_info.gz. The nELISA data of 191-plex protein profiling in PBMCs are available via GitHub at https://github.com/nplexbio/nELISA-PBMC. For questions about the PBMC dataset, please contact M.D. (milad@nomic.bio). nELISA and Cell Paint data for A549 cells are available via GitHub through the Broad Institute’s Cell Paint Consortium at https://github.com/carpenter-singh-lab/2024_Kalinin_mAP/tree/v0.1.0/experiments/5_nelisa. For inquiries regarding the A549 dataset, please contact A.E.C. (anne@broadinstitute.org). Source data are provided with this paper.
Code availability
The nELISA PBMC analysis code and CytoSig analysis code are available via GitHub at https://github.com/nplexbio/nELISA-PBMC. The Cell Paint and nELISA analysis code for A549 cells are available via GitHub through the Broad Institute’s Cell Paint Consortium at https://github.com/carpenter-singh-lab/2024_Kalinin_mAP/tree/v0.1.0/experiments/5_nelisa.
References
-
Buccitelli, C. & Selbach, M. mRNAs, proteins and the emerging principles of gene expression control. Nat. Rev. Genet. 21, 630–644 (2020).
-
Juncker, D., Bergeron, S., Laforte, V. & Li, H. Cross-reactivity in antibody microarrays and multiplexed sandwich assays: shedding light on the dark side of multiplexing. Curr. Opin. Chem. Biol. 18, 29–37 (2014).
-
Pla-Roca, M. et al. Antibody colocalization microarray: a scalable technology for multiplex protein analysis in complex samples. Mol. Cell. Proteom. 11, M111.011460 (2012).
-
Tighe, P. J., Ryder, R. R., Todd, I. & Fairclough, L. C. ELISA in the multiplex era: potentials and pitfalls. Proteom. Clin. Appl. 9, 406–422 (2015).
-
Assarsson, E. et al. Homogenous 96-plex PEA immunoassay exhibiting high sensitivity, specificity, and excellent scalability. PLoS ONE 9, e95192 (2014).
-
Gold, L., Walker, J. J., Wilcox, S. K. & Williams, S. Advances in human proteomics at high scale with the SOMAscan proteomics platform. N. Biotechnol. 29, 543–549 (2012).
-
Laforte, V., Lo, P.-S., Li, H. & Juncker, D. Antibody colocalization microarray for cross-reactivity-free multiplexed protein analysis. Methods Mol. Biol. 1619, 239–261 (2017).
-
Paquet-Mercier, F., Juncker, D. & Bergeron, S. Precise chip-to-chip reagent transfer for cross-reactivity-free multiplex sandwich immunoassays. Methods Mol. Biol. 2237, 141–149 (2021).
-
Dagher, M., Kleinman, M., Ng, A. & Juncker, D. Ensemble multicolour FRET model enables barcoding at extreme FRET levels. Nat. Nanotechnol. 13, 925–932 (2018).
-
Zhang, D. Y. & Winfree, E. Control of DNA strand displacement kinetics using toehold exchange. J. Am. Chem. Soc. 131, 17303–17314 (2009).
-
Liu, G., Jiang, C., Lin, X. & Yang, Y. Point-of-care detection of cytokines in cytokine storm management and beyond: significance and challenges. View 2, 20210003 (2021).
-
Dodig, S. Interferences in quantitative immunochemical methods. Biochem. Med. 19, 50–62 (2009).
-
Li, Y. et al. A functional genomics approach to understand variation in cytokine production in humans. Cell 167, 1099–1110.e14 (2016).
-
Sen, P., Kemppainen, E. & Orešič, M. Perspectives on systems modeling of human peripheral blood mononuclear cells. Front Mol. Biosci. 4, 96 (2017).
-
Klegerman, M. E. & Plotnikoff, N. P. in Biotechnology and Pharmacy (eds Pezzuto, J. M. et al.) 53–70 (Springer, 1993).
-
Strengell, M. et al. IL-21 in synergy with IL-15 or IL-18 enhances IFN-γ production in human NK and T cells. J. Immunol. 170, 5464–5469 (2003).
-
Borger, P., Kauffman, H. F., Postma, D. S. & Vellenga, E. IL-7 differentially modulates the expression of IFN-γ and IL-4 in activated human T lymphocytes by transcriptional and post-transcriptional mechanisms. J. Immunol. 156, 1333–1338 (1996).
-
Le, J., Lin, J. X., Henriksen-DeStefano, D. & Vilcek, J. Bacterial lipopolysaccharide-induced interferon-gamma production: roles of interleukin 1 and interleukin 2. J. Immunol. 136, 4525–4530 (1986).
-
Kohno, K. et al. IFN-gamma-inducing factor (IGIF) is a costimulatory factor on the activation of Th1 but not Th2 cells and exerts its effect independently of IL-12. J. Immunol. 158, 1541–1550 (1997).
-
Peleman, R., Wu, J., Fargeas, C. & Delespesse, G. Recombinant interleukin 4 suppresses the production of interferon gamma by human mononuclear cells. J. Exp. Med. 170, 1751–1756 (1989).
-
D’Andrea, A. et al. Interleukin 10 (IL-10) inhibits human lymphocyte interferon gamma-production by suppressing natural killer cell stimulatory factor/IL-12 synthesis in accessory cells. J. Exp. Med. 178, 1041–1048 (1993).
-
Jiang, P. et al. Systematic investigation of cytokine signaling activity at the tissue and single-cell levels. Nat. Methods 18, 1181–1191 (2021).
-
Czimmerer, Z. et al. The epigenetic state of IL-4-polarized macrophages enables inflammatory cistromic expansion and extended synergistic response to TLR ligands. Immunity 55, 2006–2026.e6 (2022).
-
Watanabe, K., Jose, P. J. & Rankin, S. M. Eotaxin-2 generation is differentially regulated by lipopolysaccharide and IL-4 in monocytes and macrophages. J. Immunol. 168, 1911–1918 (2002).
-
te Velde, A. A., Huijbens, R. J., Heije, K., de Vries, J. E. & Figdor, C. G. Interleukin-4 (IL-4) inhibits secretion of IL-1 beta, tumor necrosis factor alpha, and IL-6 by human monocytes. Blood 76, 1392–1397 (1990).
-
Saraiva, M., Vieira, P. & O’Garra, A. Biology and therapeutic potential of interleukin-10. J. Exp. Med. 217, e20190418 (2020).
-
Swanson, B. J., Murakami, M., Mitchell, T. C., Kappler, J. & Marrack, P. RANTES production by memory phenotype T cells is controlled by a posttranscriptional, TCR-dependent process. Immunity 17, 605–615 (2002).
-
Homma, T. et al. Cooperative activation of CCL5 expression by TLR3 and tumor necrosis factor-alpha or interferon-gamma through nuclear factor-kappaB or STAT-1 in airway epithelial cells. Int. Arch. Allergy Immunol. 152, 9–17 (2010).
-
Dinarello, C. A. Overview of the IL-1 family in innate inflammation and acquired immunity. Immunol. Rev. 281, 8–27 (2018).
-
Panganiban, R. P., Vonakis, B. M., Ishmael, F. T. & Stellato, C. Coordinated post-transcriptional regulation of the chemokine system: messages from CCL2. J. Interferon Cytokine Res. 34, 255–266 (2014).
-
Korbecki, J., Barczak, K., Gutowska, I., Chlubek, D. & Baranowska-Bosiacka, I. CXCL1: gene, promoter, regulation of expression, mRNA stability, regulation of activity in the intercellular space. Int. J. Mol. Sci. 23, 792 (2022).
-
Fan, J., Heller, N. M., Gorospe, M., Atasoy, U. & Stellato, C. The role of post-transcriptional regulation in chemokine gene expression in inflammation and allergy. Eur. Respir. J. 26, 933–947 (2005).
-
Freen-van Heeren, J. J. Post-transcriptional control of T-cell cytokine production: Implications for cancer therapy. Immunology 164, 57–72 (2021).
-
Cimini, B. A. et al. Optimizing the Cell Painting assay for image-based profiling. Nat. Protoc. 18, 1981–2013 (2023).
-
Chandrasekaran, S. N. et al. JUMP Cell Painting dataset: morphological impact of 136,000 chemical and genetic perturbations. Preprint at bioRxiv https://doi.org/10.1101/2023.03.23.534023 (2023).
-
Corsello, S. M. et al. The Drug Repurposing Hub: a next-generation drug library and information resource. Nat. Med. 23, 405–408 (2017).
-
Kubo, A. et al. The p16 status of tumor cell lines identifies small molecule inhibitors specific for cyclin-dependent kinase 4. Clin. Cancer Res. 5, 4279–4286 (1999).
-
Zuazua-Villar, P., Rodriguez, R., Gagou, M. E., Eyers, P. A. & Meuth, M. DNA replication stress in CHK1-depleted tumour cells triggers premature (S-phase) mitosis through inappropriate activation of Aurora kinase B. Cell Death Dis. 5, e1253 (2014).
-
Hardwicke, M. A. et al. GSK1070916, a potent Aurora B/C kinase inhibitor with broad antitumor activity in tissue culture cells and human tumor xenograft models. Mol. Cancer Ther. 8, 1808–1817 (2009).
-
Rivas-Fuentes, S., Salgado-Aguayo, A., Arratia-Quijada, J. & Gorocica-Rosete, P. Regulation and biological functions of the CX3CL1–CX3CR1 axis and its relevance in solid cancer: a mini-review. J. Cancer 12, 571–583 (2021).
-
Laufer, J. M. & Legler, D. F. Beyond migration—chemokines in lymphocyte priming, differentiation, and modulating effector functions. J. Leukoc. Biol. 104, 301–312 (2018).
-
Molon, B. et al. T cell costimulation by chemokine receptors. Nat. Immunol. 6, 465–471 (2005).
-
Liu, J. S., Amaral, T. D., Brosnan, C. F. & Lee, S. C. IFNs are critical regulators of IL-1 receptor antagonist and IL-1 expression in human microglia. J Immunol. 161, 1989–1996 (1998).
-
Comabella, M. et al. Induction of serum soluble tumor necrosis factor receptor II (sTNF-RII) and interleukin-1 receptor antagonist (IL-1ra) by interferon beta-1b in patients with progressive multiple sclerosis. J. Neurol. 255, 1136–1141 (2008).
-
Sciacca, F. L., Canal, N. & Grimaldi, L. M. Induction of IL-1 receptor antagonist by interferon beta: implication for the treatment of multiple sclerosis. J. Neurovirol. 6, S33–S37 (2000).
-
Ozdogan, H. et al. The efficacy of anti- IL-1 treatment in three patients with coexisting familial Mediterranean fever and multiple sclerosis. Mult. Scler. Relat. Disord. 45, 102332 (2020).
-
Lopalco, G., Schiraldi, S., Venerito, V., Guerriero, S. & Iannone, F. Effectiveness and safety profile of anakinra in a HLA-B27 positive patient with multiple sclerosis-associated uveitis. Mult. Scler. Relat. Disord. 42, 102152 (2020).
-
Wilson, R., Cossins, A. R. & Spiller, D. G. Encoded microcarriers for high-throughput multiplexed detection. Angew. Chem. Int. Ed. Engl. 45, 6104–6117 (2006).
-
Sai, J., Rogers, M., Hockemeyer, K., Wikswo, J. P. & Richmond, A. in Methods in Enzymology (ed. Handel, T. M.) Vol. 570, 19–45 (Academic Press, 2016).
-
Das, A. & Yan, L. I. in Target Validation in Drug Discovery (eds Metcalf, B. W. & Dillon, S.) 103–119 (Academic Press, 2007).
-
Bray, M.-A. et al. Cell Painting, a high-content image-based assay for morphological profiling using multiplexed fluorescent dyes. Nat. Protoc. 11, 1757–1774 (2016).
Acknowledgements
We thank D. Graham and S. Headland for their invaluable insights into the biology captured by nELISA profiling of PBMCs. We also thank the High-Throughput Screening Core Facility of the Institute for Research in Immunology and Cancer of the Université de Montréal for culturing and HTS of PBMCs. Funding for this study was provided by Nomic Bio, the Natural Sciences and Engineering Research Council of Canada (NSERC) Discovery (RGPIN-2016-06723 to D.J.) and I2I (I2IPJ 523344-18 to D.J.) grants, as well as from the Consortium Québécois sur la Découverte du Médicament (CQDM – Quantum Leap Program to D.J.), Healthy Brains Healthy Lives (HBHL) (HBHL-3d-012 to D.J.) and GSK. We also acknowledge funding from the Massachusetts Life Sciences Center Bits to Bytes Capital Call program (to A.E.C.) and the National Institutes of Health (R35 GM122547 to A.E.C.). We also gratefully acknowledge the use of the PerkinElmer Opera Phenix High-Content/High-Throughput imaging system at the Broad Institute, funded by S10 Grant NIH OD-026839.
Ethics declarations
Competing interests
The authors declare the following competing interests: G.O., N.R., W.R., I.T., A.T., J.K., J.D.M., S.B., S.M., A.T., K.E., C.S., A.H., A.L., P.D.-M., S.R., J.H., T.E., B.S., M.V., S.C. N.M.R. and M.D. are employees and have ownership interest in Nomic Bio, which markets the nELISA platform. D.J. has ownership interest in Nomic Bio. S.S. and A.E.C. serve as scientific advisors for companies that use image-based profiling and Cell Painting (A.E.C.: Recursion, SyzOnc, Quiver Bioscience, S.S.: Waypoint Bio, Dewpoint Therapeutics, DeepCell) and receive honoraria for occasional talks at pharmaceutical and biotechnology companies. All other authors declare no competing interests.
Peer review
Peer review information
Nature Methods thanks Alexander Heubeck and the other, anonymous, reviewer(s) for their contribution to the peer review of this work. Primary Handling Editor: Madhura Mukhopadhyay, in collaboration with the Nature Methods team.
Additional information
Publisher’s note Springer Nature remains neutral with regard to jurisdictional claims in published maps and institutional affiliations.
Supplementary information
Source data
Source Data Fig. 1
SourceData_Fig1b_Secreted: nELISA protein measurements from PBMCs. SourceData_Fig1c_Intracellular: nELISA protein measurements HEK293 cells. SourceData_Fig1d_PTM: nELISA protein measurements from HeLa, Jurkat and HEK293 cell lysates. SourceData_Fig1e_PPI: nELISA protein measurements of IL-15 and IL-15–IL-15RA complex.
Source Data Fig. 2c
Cytometry data of 384-plex barcoded beads.
Source Data Fig. 2c
Predicted positions of 384-plex barcoded beads.
Source Data Fig. 3
SourceData_Fig3b_1vs191: nELISA protein measurements in singleplex and 191-plex. SourceData_Fig3c_SpikeOneIn: 191-plex measurements of each recombinant antigen spiked alone. SourceData_Fig3d_LeaveSomeOut: 191-plex measurements of antigen pools. SourceData_Fig3e_xDRcurves: calibration curves (CCL5) with and without xDR. SourceData_Fig3f_xDRdata: 191-plex nELISA measurements with and without xDR. SourceData_Fig3g_LODs: limits of detection of 191-plex. SourceData_Fig3h_CV: coefficients of variation of 191-plex well to well and day to day. SourceData_Fig3i_Spearman: Spearman values of head-to-head nELISA versus XMAP. SourceData_Fig3j_nELISAvsXMAP: head-to-head nELISA versus XMAP measurements.
Source Data Fig. 4b
UMAP clustering of PBMC data.
Source Data Fig. 4c
CytoSig versus nELISA responses.
Source Data Fig. 4d,e,f,g
PBMC responses to cytokine perturbations.
Source Data Fig. 5
Fold change and P values for PBMC cytokine responses.
Rights and permissions
Open Access This article is licensed under a Creative Commons Attribution-NonCommercial-NoDerivatives 4.0 International License, which permits any non-commercial use, sharing, distribution and reproduction in any medium or format, as long as you give appropriate credit to the original author(s) and the source, provide a link to the Creative Commons licence, and indicate if you modified the licensed material. You do not have permission under this licence to share adapted material derived from this article or parts of it. The images or other third party material in this article are included in the article’s Creative Commons licence, unless indicated otherwise in a credit line to the material. If material is not included in the article’s Creative Commons licence and your intended use is not permitted by statutory regulation or exceeds the permitted use, you will need to obtain permission directly from the copyright holder. To view a copy of this licence, visit http://creativecommons.org/licenses/by-nc-nd/4.0/.
About this article

Cite this article
Dagher, M., Ongo, G., Robichaud, N. et al. nELISA: a high-throughput, high-plex platform enables quantitative profiling of the inflammatory secretome. Nat Methods (2025). https://doi.org/10.1038/s41592-025-02861-6
-
Received:
-
Accepted:
-
Published:
-
Version of record:
-
DOI: https://doi.org/10.1038/s41592-025-02861-6