Introduction
Tumors are heterogeneous diseases driven by diverse molecular abnormalities, resulting in considerable variability both across patients and within individual tumors1,2,3. With the advent of high-throughput sequencing technologies4,5, pan-cancer studies have become a powerful method for integrating large-scale multi-omics data across different malignancies, aiming to pinpoint shared molecular features and pathways6,7. These analyses have identified key oncogenic drivers common to multiple tumor types while highlighting the complexity of inter- and intra-tumor heterogeneity. Capturing this complexity effectively remains a central challenge in cancer genomics8,9.
Furthermore, parallel advancements in other machine learning paradigms10, such as Topic Modeling11,12,13, have also demonstrated significant utility in identifying latent variables and hidden structures within complex biological datasets. Originally developed for text analysis, Topic Modeling has been increasingly applied in diverse biological contexts, including single-cell genomics and microbiome analysis, to uncover underlying biological states or cellular subpopulations14,15. These methods, similar to Variational Autoencoders, aim to reduce dimensionality and reveal intrinsic patterns, making them relevant for comparison when seeking hidden disease subtypes. Incorporating such approaches has been shown to improve the resolution of biological insights16,17,18, for instance, by leveraging finer-grained class information during model training19.
Many pan-cancer studies either use normal tissues solely as a baseline to compare tumor expression patterns or exclude them entirely once differential expression analysis is complete20,21,22. While these approaches have yielded valuable insights, they often overlook the potential role of normal tissues in refining our understanding of how tumors deviate from physiological states23. By considering normal samples only peripherally, researchers may miss opportunities to contextualize tumor-related transcriptomic changes within a broader healthy reference—especially since each cancer type originates within a tissue-specific cellular and microenvironmental context23,24,25. Incorporating finer-grained tissue subtype labels during model training, as demonstrated in other contexts, could further enhance the resolution of such analyses. Consequently, a more comprehensive strategy that jointly models tumor and normal samples in a shared latent space could uncover subtle yet clinically meaningful signals related to disease progression and heterogeneity26,27,28,29.
Consequently, a more comprehensive strategy that jointly model’s tumor and normal samples in a shared latent space could uncover subtle yet clinically meaningful signals related to disease progression and heterogeneity15. To address these challenges, we developed VaDTN (Variational Autoencoder–Derived Tumor-to-Normal), a pan-cancer analytical framework based on variational autoencoders (VAEs). VaDTN was pre-trained gene expression datasets consisting of tumor and normal samples. In contrast to conventional methods that rely solely on tumor samples, our approach learns a low-dimensional representation from both tumor and normal tissue transcriptomes. This joint representation captures key molecular variations shared among different malignancies and their healthy counterparts. By positioning each tumor sample relative to a “normal tissue center” in the latent space, VaDTN quantifies tumor divergence through a distance embedding metric. We then incorporate this distance embedding into cancer subtype clustering, effectively integrating the notion of each tumor’s deviation from its normal baseline into standard molecular stratification. This distance-based embedding paradigm refines traditional tumor-only clustering methods, revealing novel aspects of intra-tumor heterogeneity and potential prognostic significance.
When applied to multiple tumor types—including SKCM, BRCA, LIHC, LUSC, STAD, and PAAD—VaDTN generated subtypes characterized by distinct gene expression patterns and, in many cases, significant survival differences. These findings underscore the potential clinical utility of measuring a tumor’s distance embedding from its normal tissue counterpart to guide risk stratification and therapeutic decisions. Future extensions could explore integrating finer-grained subtype labels or comparing VaDTN with other latent variable models like Topic Modeling to further validate its performance. Overall, VaDTN highlights the importance of treating normal tissues as active contributors in cancer genomics and points to distance-based clustering metrics as a promising avenue for uncovering the evolutionary and clinical dimensions of tumor biology.
Results
Overview of VaDTN
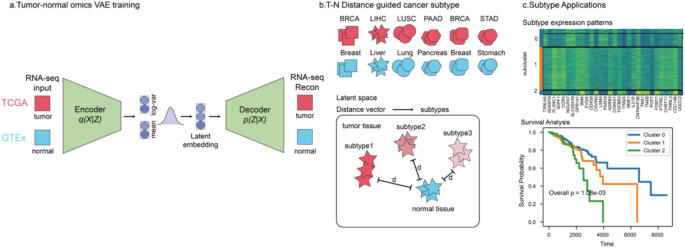
Differences between tumor and normal samples reflect both the extent of tumor divergence and the inherent heterogeneity within tumor populations23. To capture these differences, we propose VaDTN (Variational Autoencoder–Derived Tumor-to-Normal), a variational autoencoder–based pan-cancer expression profiling model (Fig. 1)30. Pre-training phase: We collected RNA-seq data from tumor and normal samples, corrected for batch effects using the ComBat algorithm, and the model learned a pan-cancer latent representation capturing key molecular patterns shared by both tumor and normal tissues (Fig. 1a). Distance-based clustering: We then used the latent space to calculate the distance between tumor and normal samples, which served as the basis for clustering tumor subtypes (Fig. 1b). Subtype characterization: As shown in subsequent analyses (Fig. 1c), these subtypes—defined by their distance to normal tissues—exhibit distinct gene expression profiles and, in many cases, significant survival differences. These results suggest that the distance between tumor and normal tissues in the latent space carries biologically meaningful information.

Overview of VaDTN.
Construction of VaDTN
We obtained gene expression data for 32 cancer types, consisting of 9,013 tumor samples from TCGA31 and 7,501 normal samples from GTEx32. Crucially, to mitigate potential batch effects and ensure comparability between these distinct datasets, we performed a rigorous batch effect correction using the ComBat algorithm on the combined TCGA and GTEx expression data prior to VAE training. We then built a VAE model to learn latent representations of these transcriptomic profiles (see Methods for details). Next, we selected six cancer types and their respective normal tissues for more in-depth analysis (see Methods for additional information)33. To visualize these latent embeddings, we employed t-SNE34 to reduce the dimensionality to two principal components.
Figure 2 shows a two-dimensional t-SNE projection of samples from six primary cancer types—SKCM, BRCA, LIHC, LUSC, STAD, and PAAD—along with their respective normal tissues (see Methods for cancer type filtering). Each cancer type forms a distinct cluster, indicating that samples from the same malignancy tend to group together while remaining separate from other cancer types. For instance, BRCA and LUSC occupy largely non-overlapping regions, whereas LIHC and STAD each form clearly bounded areas. PAAD exhibits a relatively compact distribution, whereas SKCM spans a broader yet coherent region on the right.

t-SNE Visualization of VAE latent embedding across different cancer and related normal tissues.
This visualization underscores the considerable transcriptional differences among the selected malignancies and demonstrates that our approach captures inter-tumor variation in a low-dimensional space. While these 2D projections provide a helpful visual representation of separation, it is important to note that all quantitative analyses, including clustering and distance calculations, were performed in the full-dimensional latent space to avoid potential distortions inherent in dimensionality reduction for visualization purposes. The well-defined cluster boundaries provide a strong foundation for subsequent distance-based clustering, subtype identification, and survival analyses aimed at elucidating molecular heterogeneity within and across tumor types.
Cancer subtyping bases on latent embedding distance to normal tissues
To perform cancer subtyping, we leveraged each tumor sample’s latent embedding distance to normal tissue references. First, we computed a “center” embedding for each normal tissue type by averaging the embeddings of all normal samples from that tissue. Next, for each tumor sample, we calculated its Euclidean distance to the corresponding tissue center embedding, forming a distance vector. We then used these distance vectors as input for K-means clustering. The optimal cluster number was determined using both silhouette scores and the Davies-Bouldin index, as visualized in Fig. 3. As shown in Fig. 3, the optimal cluster number for SKCM, LIHC, LUSC, and PAAD was k = 2, while for BRCA and STAD, k = 3 produced the highest silhouette scores and lowest Davies-Bouldin index values.

Silhouette scores varying from the number of cluster across cancer types.
Survival analysis of tumor subtypes across different cancers
We next evaluated the survival outcomes of the derived subtypes for each cancer using overall survival time and event status from TCGA clinical data. Figure 4 displays Kaplan–Meier curves for SKCM, BRCA, LIHC, LUSC, STAD, and PAAD. We observed varying degrees of survival stratification. In SKCM, two subtypes (Cluster 0 vs. Cluster 1) showed a marked difference in prognosis (p = 7.47 × 10⁻⁵), with Cluster 1 having notably worse outcomes. BRCA had three subtypes (Cluster 0, Cluster 1, Cluster 2) with significantly different survival curves (p = 2.71 × 10⁻³); Cluster 2 was associated with the poorest prognosis, suggesting a more aggressive subtype. In LIHC, two subtypes showed a significant but less pronounced survival discrepancy (p = 3.12 × 10⁻³). LUSC exhibited a marginal survival difference (p = 1.79 × 10⁻¹), indicating a potential trend that may require larger cohorts or more detailed molecular data to confirm. STAD again displayed a significant difference across three subtypes (p = 1.24 × 10⁻²), with one cluster showing a notably better prognosis. In contrast, PAAD revealed no evident survival stratification (p = 5.61 × 10⁻¹), suggesting that our current approach may not capture distinct prognostic subgroups in pancreatic cancer.

Survival analysis of different tumor subtype in specific cancer.
Overall, our distance-based subtype classification significantly stratified survival in four of the six cancer types (SKCM, BRCA, LIHC, and STAD), underscoring its potential utility in risk assessment and personalized therapy. To rigorously validate this central claim, we conducted a series of ablation studies which confirmed that models incorporating normal tissues—whether from GTEx or TCGA normal-adjacent samples—significantly outperformed a tumor-only baseline model in identifying prognostically distinct subtypes (see Supplementary Fig. 1 for full details on ablation studies). The borderline significance observed in LUSC and the lack of clear stratification in PAAD highlight the need for refinement and independent validation in specific tumor contexts.
Gene expression patterns of tumor subtype across different cancers
We further investigated the heterogeneous gene expression patterns of subtypes across the various cancer types. Figure 5 shows heatmaps of the top differentially expressed genes for subclusters identified in SKCM, BRCA, LIHC, LUSC, STAD, and PAAD. By incorporating our distance-to-normal metric, the model captures substantial transcriptional variability within each cancer, revealing notable intra-tumor heterogeneity.

Gene expression patterns of different subtypes of specific cancer.
For example, in LIHC cluster 0, the expression levels of ABAT, BDH1, and ARG1 are markedly lower than those in cluster 1, correlating with a worse prognosis. Consistent with previous reports showing significantly reduced expression of these genes in tumor tissues compared to normal liver tissues, our findings suggest their potential tumor-suppressive roles in hepatocellular carcinoma. ABAT is integral to gamma-aminobutyric acid (GABA) metabolism, thereby maintaining metabolic homeostasis in the liver35,36. Decreased ABAT expression disrupts GABA signaling and promotes tumor proliferation, potentially driven by hypermethylation of its promoter region. BDH1, a key enzyme in ketone body metabolism, regulates lipid homeostasis; its downregulation compromises oxidative stress defense and lipid metabolism, fostering a pro-tumor environment. Furthermore, low BDH1 expression has been associated with reduced sensitivity to PD-1/PD-L1 immune checkpoint inhibitors, underscoring its role in tumor immune evasion37,38. ARG1, an essential enzyme in the urea cycle, converts arginine into ornithine and urea; diminished ARG1 expression dysregulates nitrogen metabolism and facilitates a tumor-supportive microenvironment39,40. Notably, reduced ARG1 levels have also been linked to enhanced epithelial-mesenchymal transition (EMT), contributing to greater tumor invasiveness. These results indicated that VaDTN can reveal differential gene expression patterns compared with normal healthy tissues.
Validation of the distance-to-normal metric against a null model
To demonstrate that the prognostic stratification achieved by VaDTN is a direct result of our biology-inspired”distance-to-normal”framework and not an ad-hoc statistical artifact, we performed an extensive validation against a random null model. We formulated a null hypothesis that the”normal tissue center”contains no special information and any randomly chosen point in the latent space would yield similar results. To test this, we kept the VAE model and latent space fixed, but instead of using the true normal tissue centroid, we generated a“random center”by sampling from the global distribution of all embeddings. We then calculated each tumor’s distance to this random center and performed the identical K-means clustering and survival analysis pipeline. This entire process was repeated 1,000 times to generate an empirical null distribution of survival p-values.
The results of this robust validation, presented in Supplementary Fig. 3, are compelling. The analysis revealed that when clustering tumors based on their distance to a randomly generated center, the vast majority of the 1,000 trials resulted in subtypes with non-significant survival p-values. In stark contrast, the subtypes identified by our VaDTN framework, which uses the true healthy tissue center, showed highly significant survival stratification for SKCM, BRCA, LIHC, and STAD. The p-values for these four cancers were extreme outliers compared to the empirical null distribution, demonstrating that our findings are not due to chance. This provides direct, quantitative evidence that the prognostic power of our subtypes is not an ad hoc artifact but a direct consequence of our biology-inspired”distance from normal”framework, substantiating the clinical relevance of our approach.
Discussion
In this study, we introduce a reference-centered analytical framework that locates both tumor and normal samples in a shared latent space. By quantifying the “distance” between a tumor and the baseline molecular profile of its related healthy tissue, VaDTN can provide novel insights into cancer’s evolutionary trajectories and inherent heterogeneity. This method diverges from conventional approaches that either treat normal samples strictly as controls or exclude them after differential expression analyses, thereby overlooking critical information about a tumor’s deviation from normal physiological states. Our finding that incorporating normal tissue data improves the robustness and biological interpretability of cancer subtyping is consistent with observations from other powerful methods like topic modeling, which have also demonstrated the benefit of including healthy tissue in classification on similar datasets.
A key advantage of our approach is its capacity to uncover subtle molecular differences both within and across tumor types23,27,41. By anchoring each cancer sample relative to a normal reference, VaDTN revealed distinct subclusters marked by unique transcriptional signatures, which frequently exhibited significantly different clinical outcomes. These effects were especially pronounced in SKCM, BRCA, LIHC, and STAD, where survival stratification showed strong correlations with cluster membership. However, non-significant survival results in LUSC and PAAD suggest limitations [new subsection: Limitations in Survival Stratification]. Prognosis in these cancers may be driven by non-transcriptomic factors (e.g., mutations, epigenetics, immune interactions), or the latent space may prioritize non-prognostic features (e.g., metabolic patterns). Limited sample sizes and clinical heterogeneity may also reduce statistical power. Future work integrating multi-omics data could address these challenges. However, non-significant survival results in LUSC and PAAD suggest limitations. Prognosis in these cancers may be driven by non-transcriptomic factors (e.g., mutations, epigenetics, immune interactions), or the latent space may prioritize non-prognostic features (e.g., metabolic patterns). Limited sample sizes and clinical heterogeneity may also reduce statistical power. Future work integrating multi-omics data could address these challenges.
Despite these promising findings, there are several limitations to consider. First, our model currently uses only transcriptomic data; incorporating additional omics layers (e.g., proteomics, single-cell sequencing) may offer a more comprehensive view of tumor biology42,43. Second, the normal tissue references utilized in this study may not accurately reflect the microenvironmental or cellular composition of each cancer type23, potentially affecting the accuracy of distance metrics. Future iterations could refine these references by adopting adjacent normal samples or employing tissue-specific healthy controls. Third, our focus on publicly available datasets underscores the importance of external validation in independent cohorts and prospective studies to confirm the clinical relevance of this framework44.
Moving forward, enhancing the distance-based methodology by integrating immunological, microenvironmental, or treatment-response data could enrich our understanding of tumor progression and potential vulnerabilities45,46,47,48. Incorporating these aspects may ultimately help clinicians tailor interventions based on each patient’s subtype and molecular “distance” from healthy benchmarks. Overall, our study underscores the importance of recognizing normal tissues as active participants in cancer genomics and demonstrates how distance metrics in a shared latent space can reveal crucial aspects of tumor biology, pointing toward more precise oncology strategies.
Methods
Datasets
The RNA expression datasets used in this study are publicly available. We obtained mRNA expression data for 9,013 tumor samples from 32 different cancers and 708 normal samples from The Cancer Genome Atlas (TCGA) program, accessible through the GDC Data Portal (https://portal.gdc.cancer.gov/). To integrate TCGA and GTEx data effectively, we performed batch effect correction using the ComBat algorithm to minimize technical variation between the datasets before further analysis. For survival prediction analyses, we selected six cancer subtypes that each had (i) at least 50 patients with uncensored survival information, and (ii) a corresponding normal tissue cohort of at least 200 samples. Consequently, we focused on bladder carcinoma (BLCA), breast carcinoma (BRCA), liver hepatocellular carcinoma (LIHC), lung squamous cell carcinoma (LUSC), skin cutaneous melanoma (SKCM), and stomach adenocarcinoma (STAD) for prognostic assessments.
Variational autoencoder (VAE)-based latent representation
Model architecture
We employed a variational autoencoder (VAE) framework to learn a low-dimensional latent representation from tumor and normal samples. The encoder consists of three fully connected layers with ReLU activation: an input layer matching the gene expression dimension, two hidden layers with 512 and 256 units, respectively, and an output layer producing a 16-dimensional latent space for mean and variance. The decoder mirrors this structure to reconstruct the input. The VAE was trained using the Adam optimizer for 100 epochs with a batch size of 128 and a learning rate of 0.001, implemented in Python 3.9 using PyTorch. Training continued until validation loss converged.
Objective function
The VAE is trained by maximizing the evidence lower bound (ELBO):
$$L(theta ,phi ;x)={E}_{{q}_{phi }(z|x)}[log{p}_{theta }(x|z)]-KL({q}_{phi }(z|x)||p(z)]$$
where ({E}_{{q}_{phi }(z|x)}[log{p}_{theta }(x|z)]) is the reconstruction loss (measured by mean squared error), and (KL({q}_{phi }(z|x)||p(z)]) is the Kullback–Leibler divergence that regularizes the approximate posterior against a prior (p(z)), commonly a standard normal Gaussian distribution.
Training procedure
Data Split: We combined tumor and normal samples into a single dataset for VAE training, ensuring diverse representation from multiple cancer types and healthy tissues.
Hyperparameters: We tuned the learning rate, batch size, and other hyperparameters empirically. The Adam optimizer was typically used for gradient-based optimization.
Implementation: The VAE was implemented in Python (version 3.9) using a deep learning framework (e.g., TensorFlow or PyTorch). Model were trained for 100 epochs or until validation loss converged.
Latent space visualization
After training the VAE, we extracted the latent vector z for each sample. For two-dimensional visualizations, we applied t-SNE to the latent features, enabling clear differentiation of clusters corresponding to various tumor types and healthy tissues. We note that t-SNE is used for illustrative purposes only, and all quantitative analyses were performed in the full 16-dimensional latent space to avoid visualization-related distortions.
Distance embedding computation
We computed the Euclidean distance between each tumor sample’s latent embedding (({z}_{tumor})) and the mean embedding of the corresponding normal tissue group (({z}_{normal})). Formally:
$${d}_{i}={z}_{tumor,i}-{z}_{normal}^{(center)}$$
To assess the robustness of this metric, we also computed distances using cosine similarity, as described in the Results section.
Subtype clustering and survival analysis
Distance Vector Construction: Each tumor sample (i) was represented by its distance embedding ({d}_{i}), reflecting how far the tumor diverges from its healthy reference.
Clustering: Using ({d}_{i}) as input, we performed clustering to identify discrete tumor subtypes within each cancer cohort. We exclusively employed K-means clustering for this purpose. The optimal number of clusters k was determined by evaluating internal validation metrics, specifically the silhouette coefficient and the Davies–Bouldin index. We tested cluster solutions ranging from k = 2 to k = 6 and selected the partition that maximized the silhouette coefficient while also considering the Davies–Bouldin index to ensure robust cluster quality.
Identification of Subtype-Specific Genes: We conducted differential expression analyses (e.g., Wilcoxon rank-sum test or moderated t-test) between subtypes to identify signature genes distinguishing the distance-based subtypes. Heatmaps and pathway enrichment analyses were then used to reveal dominant functional themes within each cluster.
Survival analysis
Patient survival data (overall survival time and event status) from TCGA were linked to each subtype. We generated Kaplan–Meier curves and performed log-rank tests to evaluate statistically significant survival differences. Cox proportional hazards models were also used to compute hazard ratios (HR) and corresponding confidence intervals.
Statistical and computational considerations
All statistical analyses were performed in Python (version 3.9). Significance thresholds were typically set at p < 0.05, with multiple testing corrections (e.g., Benjamini–Hochberg) applied where necessary. Computations were run on high-performance computing clusters or local GPU workstations to expedite VAE training and large-scale differential expression analyses.
Data availability
All datasets used in this study are publicly available. TCGA tumor data are available at the GDC Data Portal (https://portal.gdc.cancer.gov/).Healthy control data can be accessed through the GTEx Portal (https://gtexportal.org/).
References
-
Stratton, M. R., Campbell, P. J. & Futreal, P. A. The cancer genome. Nature 458, 719–724. https://doi.org/10.1038/nature07943 (2009).
-
Wu, C.-I., Wang, H.-Y., Ling, S. & Lu, X. The ecology and evolution of cancer: The ultra-microevolutionary process. Annu. Rev. Genet. 50, 347–369. https://doi.org/10.1146/annurev-genet-112414-054842 (2016).
-
Jones, P. A. & Baylin, S. B. The epigenomics of cancer. Cell 128, 683–692 (2007).
-
Beane, J. et al. Characterizing the impact of smoking and lung cancer on the airway transcriptome using RNA-Seq. Cancer Prev. Res. 4, 803–817 (2011).
-
Xu, H., Wang, C., Song, H., Xu, Y. & Ji, G. RNA-Seq profiling of circular RNAs in human colorectal cancer liver metastasis and the potential biomarkers. Mol. Cancer 18, 1–6 (2019).
-
Wang, F.-A. et al. TMO-Net: An explainable pretrained multi-omics model for multi-task learning in oncology. Genome Biol. https://doi.org/10.1186/s13059-024-03293-9 (2024).
-
Wang, F.-a., Li, Y. & Zeng, T. Deep Learning of radiology-genomics integration for computational oncology: A mini review. Computational and Structural Biotechnology Journal (2024).
-
Choy, C. T., Wong, C. H. & Chan, S. L. Embedding of genes using cancer gene expression data: Biological relevance and potential application on biomarker discovery. Front. Genet. https://doi.org/10.3389/fgene.2018.00682 (2019).
-
Albaradei, S. et al. MetaCancer: A deep learning-based pan-cancer metastasis prediction model developed using multi-omics data. Comput. Struct. Biotechnol. J. 19, 4404–4411. https://doi.org/10.1016/j.csbj.2021.08.006 (2021).
-
Mazzolini, A., Caselle, M. & Osella, M. Ranking nodes in bipartite systems with a non-linear iterative map. Commun. Phys. 8, 148 (2025).
-
Valle, F., Caselle, M. & Osella, M. Exploring the latent space of transcriptomic data with topic modeling. NAR Genom. & Bioinform. 7, lqaf049 (2025).
-
Dey, K. K., Hsiao, C. J. & Stephens, M. Visualizing the structure of RNA-seq expression data using grade of membership models. PLoS Genet. 13, e1006599 (2017).
-
Valle, F., Osella, M. & Caselle, M. Multiomics topic modeling for breast cancer classification. Cancers 14, 1150 (2022).
-
Pizzini, L., Valle, F., Osella, M. & Caselle, M. Topic modeling analysis of the allen human brain atlas. Sci. Rep. 15, 6928 (2025).
-
Valle, F., Osella, M. & Caselle, M. A topic modeling analysis of tcga breast and lung cancer transcriptomic data. Cancers 12, 3799 (2020).
-
Liu, J. et al. Challenges in ai-driven biomedical multimodal data fusion and analysis. Genomics, Proteomics & Bioinformatics, qzaf011 (2025).
-
Gao, F. et al. Interpretable multimodal fusion model for bridged histology and genomics survival prediction in pan‐cancer. Advanced Science, 2407060 (2025).
-
Wang, F.-a., He, R., Liu, J. & Li, Y. scTFBridge: A disentangled deep generative model informed by TF-motif binding for gene regulation inference in single-cell multi-omics. bioRxiv, 2025.2001. 2016.633293 (2025).
-
Esteva, A. et al. Dermatologist-level classification of skin cancer with deep neural networks. Nature 542(115), 118 (2017).
-
Withnell, E., Zhang, X., Sun, K. & Guo, Y. XOmiVAE: An interpretable deep learning model for cancer classification using high-dimensional omics data. Brief Bioinform. https://doi.org/10.1093/bib/bbab315 (2021).
-
Zhang, J. et al. Single-cell analysis of multiple cancer types reveals differences in endothelial cells between tumors and normal tissues. Comput. Struct. Biotechno.l J. 21, 665–676. https://doi.org/10.1016/j.csbj.2022.12.049 (2023).
-
Shimoni, Y. Association between expression of random gene sets and survival is evident in multiple cancer types and may be explained by sub-classification. PLoS Comput. Biol. 14, e1006026 (2018).
-
Frost, H. R. Analyzing cancer gene expression data through the lens of normal tissue-specificity. PLoS Comput. Biol. 17, e1009085. https://doi.org/10.1371/journal.pcbi.1009085 (2021).
Article ADS MathSciNet CAS PubMed PubMed Central Google Scholar
-
Hosny, A. et al. Deep learning for lung cancer prognostication: A retrospective multi-cohort radiomics study. PLoS Med. 15, e1002711 (2018).
-
Swanson, K., Wu, E., Zhang, A., Alizadeh, A. A. & Zou, J. From patterns to patients: Advances in clinical machine learning for cancer diagnosis, prognosis, and treatment. Cell 186, 1772–1791. https://doi.org/10.1016/j.cell.2023.01.035 (2023).
-
Su, X. et al. Interpretable identification of cancer genes across biological networks via transformer-powered graph representation learning. Nat. Biomed. Eng. https://doi.org/10.1038/s41551-024-01312-5 (2025).
-
Wang, F., Liu, J., Gao, F. & Li, Y. Exploring multi-omics latent embedding spaces for characterizing tumor heterogeneity and tumoral fitness effects. bioRxiv, 2023.2007. 2005.547886 (2023).
-
Chari, T. & Pachter, L. The specious art of single-cell genomics. PLoS Comput. Biol. 19, e1011288 (2023).
-
Venet, D., Dumont, J. E. & Detours, V. Most random gene expression signatures are significantly associated with breast cancer outcome. PLoS Comput. Biol. 7, e1002240 (2011).
-
Tomczak, J. & Welling, M. in International conference on artificial intelligence and statistics. 1214–1223 (PMLR).
-
Tomczak, K., Czerwińska, P. & Wiznerowicz, M. Review The Cancer Genome Atlas (TCGA): An immeasurable source of knowledge. Contemp. Oncol./Współczesna Onkologia 2015, 68–77 (2015).
-
Consortium G. The GTEx Consortium atlas of genetic regulatory effects across human tissues. Science 369(1318), 1330 (2020).
-
Kim, S., Kim, K., Choe, J., Lee, I. & Kang, J. Improved survival analysis by learning shared genomic information from pan-cancer data. Bioinformatics 36, i389–i398. https://doi.org/10.1093/bioinformatics/btaa462 (2020).
-
Van der Maaten, L. & Hinton, G. Visualizing data using t-SNE. Journal of machine learning research 9 (2008).
-
Han, H., Zhou, S., Chen, G., Lu, Y. & Lin, H. ABAT targeted by miR-183-5p regulates cell functions in liver cancer. Int. J. Biochem. Cell Biol. 141, 106116 (2021).
-
Gao, X. et al. Regulation of gamma-aminobutyric acid transaminase expression and its clinical significance in hepatocellular carcinoma. Front. Oncol. 12, 879810 (2022).
-
Xu, B.-T. et al. Bdh1 overexpression ameliorates hepatic injury by activation of Nrf2 in a MAFLD mouse model. Cell Death Discov. 8, 49 (2022).
-
Liu, Z. et al. Expression and clinical significance of BDH1 in liver cancer. Medicine 100, e28013 (2021).
-
You, J. et al. The oncogenic role of ARG1 in progression and metastasis of hepatocellular carcinoma. Biomed. Res. Int. 2018, 2109865 (2018).
-
Prasad, Y. R., Anakha, J. & Pande, A. H. Treating liver cancer through arginine depletion. Drug Discov. Today 29, 103940 (2024).
-
Kreitmaier, P., Katsoula, G. & Zeggini, E. Insights from multi-omics integration in complex disease primary tissues. Trends Genet. 39, 46–58 (2023).
-
Nicora, G., Vitali, F., Dagliati, A., Geifman, N. & Bellazzi, R. Integrated multi-omics analyses in oncology: A review of machine learning methods and tools. Front. Oncol. 10, 1030 (2020).
-
Liu, J., Xu, W., Li, S., Sun, R. & Cheng, W. Multi-omics analysis of tumor mutational burden combined with prognostic assessment in epithelial ovarian cancer based on TCGA database. Int. J. Med. Sci. 17, 3200 (2020).
-
Chaudhary, K., Poirion, O. B., Lu, L. & Garmire, L. X. Deep learning–based multi-omics integration robustly predicts survival in liver cancer. Clin. Cancer Res. 24, 1248–1259 (2018).
-
Chai, H. et al. Integrating multi-omics data through deep learning for accurate cancer prognosis prediction. Comput. Biol. Med. 134, 104481 (2021).
-
Tong, L., Mitchel, J., Chatlin, K. & Wang, M. D. Deep learning based feature-level integration of multi-omics data for breast cancer patients survival analysis. BMC Med. Inform. Decis. Mak. 20, 1–12 (2020).
-
Sharifi-Noghabi, H., Zolotareva, O., Collins, C. C. & Ester, M. MOLI: multi-omics late integration with deep neural networks for drug response prediction. Bioinformatics 35, i501–i509 (2019).
-
Babu, M. & Snyder, M. Multi-omics profiling for health. Molecular & Cellular Proteomics 22 (2023).
Funding
This study was supported by the Guangxi Medical and health key discipline construction project.
Ethics declarations
Competing interests
The authors declare no competing interests.
Additional information
Publisher’s note
Springer Nature remains neutral with regard to jurisdictional claims in published maps and institutional affiliations.
Supplementary Information
Rights and permissions
Open Access This article is licensed under a Creative Commons Attribution-NonCommercial-NoDerivatives 4.0 International License, which permits any non-commercial use, sharing, distribution and reproduction in any medium or format, as long as you give appropriate credit to the original author(s) and the source, provide a link to the Creative Commons licence, and indicate if you modified the licensed material. You do not have permission under this licence to share adapted material derived from this article or parts of it. The images or other third party material in this article are included in the article’s Creative Commons licence, unless indicated otherwise in a credit line to the material. If material is not included in the article’s Creative Commons licence and your intended use is not permitted by statutory regulation or exceeds the permitted use, you will need to obtain permission directly from the copyright holder. To view a copy of this licence, visit http://creativecommons.org/licenses/by-nc-nd/4.0/.
About this article

Cite this article
Wang, H., Zhang, Y., Zhang, D. et al. Novel cancer subtyping method guided by tumor-normal sample in latent space of transcriptomic variational autoencoder. Sci Rep 15, 26444 (2025). https://doi.org/10.1038/s41598-025-07813-w
-
Received:
-
Accepted:
-
Published:
-
DOI: https://doi.org/10.1038/s41598-025-07813-w