Introduction
AAV vectors have become a cornerstone in gene therapy due to their ability to deliver genetic material with high specificity and low immunogenicity. As of recent reports, there are over 200 ongoing pipeline drug developments and 8 approved products on the market utilizing AAV vectors, making them the most widely used vector in gene therapy pipelines [1]. The majority of gene therapy products in development are AAV-driven, underscoring the critical need for efficient and scalable downstream processing methods to ensure high purity and yield of AAV vectors [2, 3].
Scaling up the downstream processing, especially separation of E and F particles of AAV, however presents several significant challenges [4,5,6,7,8].
First is the method itself, where the traditional purification methods, such as caesium chloride gradient ultracentrifugation are labour-intensive process that requires manual handling and multiple steps, making it less suitable for large-scale production [9]. The process is time-consuming, often taking several hours to complete a single run, which limits throughput [10]. Ultracentrifugation is difficult to scale up due to the limitations in rotor capacity and the need for specialized equipment, which can be costly and space-consuming [11]. Finally, the manual nature of the process can lead to batch-to-batch variability, affecting the consistency and reproducibility of the final product [12].
To address these challenges, novel techniques such as monolithic chromatography are being explored. Chromatography, particularly monolithic chromatography, can process large volumes of cell lysates quickly [13] due to open channel structure of monoliths which reduces backpressure, enabling faster flow rates without compromising the resolution and capacity, making them ideal for large-scale applications [14].
From perspective of downstream process development there is a need for consistent chromatography media where one can develop the process on smaller units and then such conditions are seamlessly scaled up to pilot or manufacturing scale. The novel CIMmultus QA HR line offers a consistent elution within ± 3% of peak’s elution conductivity for AAV. This corresponds to a difference of less than 0.6 mS/cm in elution conductivities for the elution of E AAV capsids, resulting in the highest reproducibility between batches and different scales among all prepacked chromatography media [15]. The uniform structure of monoliths ensures consistent performance across different scales, from laboratory to industrial production [16].
In the initial stages of process development, 96-well plates are often used for HTS of various conditions [17]. This approach allows for the rapid evaluation of different parameters, such as buffer compositions, pH levels, and salt concentrations [18]. The use of CIM QA HR Monolithic Well Plates enables parallel processing of multiple samples, significantly speeding up the development timeline and providing valuable data for scaling up to larger volumes [19].
Once the process is set and defined other process related challenges can still introduce a margin of error and contribute to an inconsistent scale up. One should account for sample variability [20], temperature fluctuations and differences in process development laboratories and GMP suites which can affect pH and conductivity values of prepared buffers. Important aspect is also defining loading ranges and matching the column size to chromatography skid to obtain the best results [21].
In conclusion, the adoption of novel techniques such as monolithic chromatography with stringent QC tests as seen with CIMmultus QA HR line and implementing improved analytics [22, 23] presents a significant advancement in the downstream processing of AAV. These innovations address the limitations of traditional methods, offering a scalable, efficient, and cost-effective solution for the large-scale production of AAV vectors. As the demand for gene therapies continues to grow, the development and optimization of these improved techniques will be crucial in meeting the needs of patients and advancing the field of gene therapy [24, 25].
Materials and methods
Viral material preparation and purification
The sample for this study was AAV2/8 prepared by sequence of upstream and downstream steps. This sample was prepared by triple transfection of suspension HEK293 cell line (Thermo Fisher Scientific, Waltham, Massachusetts, USA). Rep2-Cap8 and helper plasmids were used together with a cis-construct containing a GFP expression cassette flanked by inverted terminal repeats (ITRs) regions from AAV2. The plasmids were combined at a molar ratio of 1:1:1 and transfected into the cells using PEI MAX transfection reagent (Polysciences, Warrington, PA, USA). The transfection was performed in a 5 litre stirred-tank Biostat® B-DCU bioreactor (Sartorius, Goettingen, Germany) using the fed-batch method. Cell lysis was performed 48 h after transfection by adding Tween 20 (Sigma-Aldrich, Burlington, MA, USA) directly into the bioreactor. The material was harvested and frozen at −80 °C until further use.
The lysed harvest of the AAV2/8 serotype was clarified using Sartopure® GF + 1.2 µm and Sartopore® 2 0.45 µm filtration units (Sartorius) and then processed by a tangential flow filtration using Sartocon® Hydrosart 300 kDa cassette (Sartorius) in combination with DNase treatment (Blirt, Gdansk, Poland). The sample was captured and additionally purified using a cation exchange chromatography column, CIMmultus SO3 (Sartorius BIA Separations, Ajdovščina, Slovenia).
After chromatography, each main fraction was buffer exchanged for 5 to 6 diavolumes in formulation buffer (20 mM Tris, 150 mM NaCl, 2 mM MgCl2, 0.01% poloxamer 188, pH 7.5) using a centrifuge and a Vivaspin® 20, 100,000 MWCO PES membrane (Sartorius). Seven individual upstream batches were prepared and pooled after purification to obtain a total amount of 7.00E + 15 vp purified AAV2/8 used in the study.
Evaluation of purity and AAV content
Digital polymerase chain reaction (dPCR)
The dPCR method (Qiagen, Hilden, Germany) was used to determine the genome titer of the AAV vector in pre-purified AAV2/8 samples as well as in the fractions collected during the chromatographic procedures. Each sample was assayed in three 10-fold dilutions, with each dilution being analysed in duplicate. The titer of the sample was therefore calculated based on 6 measurements. The negative and positive controls were analysed in duplicate. The standard deviation was calculated, and the coefficient of variation should not exceed 10%.
Enzyme-linked immunosorbent assay (ELISA) for AAV capsid quantification
Immunotitration was performed using the AAV8 titration ELISA (Progen, Heidelberg, Germany) according to the manufacturer’s recommendations. Each sample was measured in duplicate and at two different dilutions. The average values were used to calculate the AAV titer.
Mass photometry (MP)
MP quantifies the mass of particles at the single particle level by measuring the light scattered from individual particles while they are bound to a glass surface. The technique of MP (Refeyn, Oxford, UK) was used to determine the molecular mass and corresponding percentage of individual capsids in pre-purified AAV2/8 samples as well as in the fractions collected during the chromatographic procedures used to separate the capsids of the same loading sample. There are potentially four AAV regions: empty, partial, full and overfull. The AAV thresholds were manually edited by adjusting the values for the thresholds considering the insert size (base pair) or full AAV size (kDa) information.
Each sample was buffer exchanged in formulation buffer (20 mM Tris, 150 mM NaCl, 2 mM MgCl2, 0.01% poloxamer 188, pH 7.5). For the buffer exchange process the Amicon Ultra-0.5 Centrifugal Filter Unit (Merck Millipore, Darmstadt, Germany) was used. After buffer exchange, the sample was diluted accordingly so that the sample concentration was approximately 1.00E + 11 vp/mL. Each sample was measured in three replicates and the average values were used to calculate the percentage of full AAV particles.
PATfix® analysis
PATfix analytics was performed using PATfix biochromatography system (Sartorius BIA Separations) featuring a quaternary pump and various detectors: a multi-wavelength ultraviolet (UV) detector (190–700 nm, 4 channel deuterium lamp, 50 mm low cell path length), a fluorescence (FL) detector, a multi-angle light scattering (MALS or LS) detector, and a conductivity monitor and, a pH electrode. UV absorbance was monitored at 230 nm, 260 nm, and 280 nm. Light scattering was measured at an angle of 90°. Fluorescence (FLD) was measured at excitation 280 nm and emission 348 nm (sensitivity: low, gain: 4x).
PATfix analytical method was based on anion-exchange chromatography using CIMac AAV full/empty 0.1 mL Analytical Column (1.3 µm) (Sartorius BIA Separations). Flowrate was 1 mL/min. Binding mobile phase A (20 mM Tris, 5 mM MgAc2, 1% sorbitol, 0.1% poloxamer 188, pH 8.5) and elution mobile phase B (20 mM Tris, 50 mM MgAc2, 1% sorbitol, 0.1% poloxamer 188, pH 8.5) were used. After column equilibration and conditioning, 500 µL of diluted or buffer exchanged (Amicon Ultra-0.5 Centrifugal Filter Unit (Merck Millipore)) sample was loaded and eluted in 75 CV linear gradient to 100% of elution mobile phase. After each elution, regeneration using 0.5 M Tris, 1 M NaCl pH 7.5 was performed followed by cleaning in place (CIP) using 0.1 M NaOH, 2 M NaCl solution. Data were analysed using PATfix software Version 3.1 (Sartorius BIA Separations).
PATfix—ultracentrifuge (UC)
PATfix-UC is a preparative UC using a self-forming CsCl gradient analysed by PATfix biochromatography system (Sartorius BIA Separations). Centrifugation was performed at 53,500 RPM for 23 h at temperature 20 °C. During density gradient UC, the capsid populations separate based on their density, with the genome containing full capsids being present at the bottom and the empty capsids at the top of the tube. PATfix pumps and samples the content from the bottom of the tube, which is why the full capsids elute before the partial and empty capsids in the PATfix centrifugram [10].
Charge detection mass spectrometry (CD-MS)
CD-MS measures the mass distribution of heterogeneous and high-molecular samples that are not accessible with conventional MS. In CD-MS, the masses of the individual ions are determined by simultaneously measuring the m/z ratio and the charge of each ion. To validate the MP data, some samples were subjected to parallel CD-MS measurements (Megadalton solutions, Bloomington, IN, USA). For this purpose, AAVs were electro sprayed and measured in the Orbitrap CD-MS, recording individual m/z and charge values. After classifying the particles in a 2D histogram plot using m/z and charge, AAV subtypes can be distinguished [26].
Selection of the polishing column
The screening of the chromatographic media for the polishing step was performed on three different 1 mL columns (2 µm channels): CIMmultus PrimaS®, CIMmultus PrimaT and CIMmultus QA HR. Two different methods were tested on the CIMmultus QA HR column, the conventional method and the improved method [22]. CIMmultus QA HR column is a strong anion exchanger, while CIMmultus PrimaS column and CIMmultus PrimaT column are weak anion exchangers with multimodal properties.
The volume of loaded sample for all three columns was determined by dPCR and MP such that 5.00E + 12 vg (equal to 2.07E + 13 vp) was loaded per 1 mL column. After the polishing step all the main eluates were analysed for recovery (dPCR and PATfix CIMac AAV) and percentage of full particles (PATfix CIMac AAV and MP). All columns were sanitized after the runs, regenerated, and stored in 20% ethanol for further use.
PrimaS
To condition 1 mL CIMmultus PrimaS column, 10 CV buffer A (10 mM Tris, 10 mM BTP, 2 mM MgCl2, 1% sucrose, 0.1% poloxamer 188, pH 7.0), 10 CV buffer B (10 mM Tris, 10 mM BTP, 2 mM MgCl2, 1% sucrose, 0.1% poloxamer 188, pH 10.0) and 15 CV buffer A were used. The load for the CIMmultus PrimaS column was prepared in a way that sample AAV2/8 was buffer exchanged with PD-10 columns (Cytiva, Marlborough, MA, USA) in buffer A, diluting to 10 mL final volume and then loaded onto the column. A flow rate of 10 mL/min was used throughout the method. After loading, the column was washed with buffer A for 10 CV, and then a linear pH gradient elution was performed from 0 to 100% B buffer in 20 CV, holding 100% B buffer for 10 CV. The fractions were collected, and the pH was neutralized with 1 M BTP pH 6.5. After elution, a 10 CV CIP (0.1 M NaOH, 2 M NaCl) was performed to collect the fraction, which was pH neutralized with 1 M acetic acid.
PrimaT
For conditioning the 1 mL CIMmultus PrimaT column, 10 CV buffer B2 (50 mM Tris, 12 mM boric acid, 2 M NaCl, 1% sucrose, 0.1% poloxamer 188, pH 9.0) and 10 CV buffer A1 (25 mM HEPES, 1% sucrose, 0.1% poloxamer 188, pH 7.0) were used. The load for the CIMmultus PrimaT column was prepared in a way that AAV2/8 sample was buffer exchanged with PD-10 columns (Cytiva) in A1 buffer, diluting to 20 mL final volume and then loading onto the column. A flow rate of 5 mL/min was used throughout the method. After loading, the column was washed with buffer A1 for 10 CV, followed by a pH transition in A2 buffer (50 mM Tris, 13.6 mM boric acid, 1% sucrose, 0.1% poloxamer 188, pH 9.0) for 10 CV. This was followed by a gradient salt elution from 0 to 100% B1 buffer (50 mM Tris, 9.6 mM boric acid, 50 mM MgCl2, 1% sucrose, 0.1% poloxamer 188, pH 9.0) in 20 CV and followed by a step elution for 20 CV of 100% B2 buffer. The fractions were collected, and the pH of the sample was neutralized with 1 M BTP pH 6.5. After elution, a 10 CV CIP (1 M NaOH + 2 M NaCl) was performed to collect the fraction, which was pH neutralized with 1 M acetic acid.
QA HR conventional method
To condition the 1 mL CIMmultus QA HR column, 5 CV of buffer A (25 mM BTP, 0.1% poloxamer 188, 1% sucrose, pH 9.0), 5 CV of buffer B (25 mM BTP, 0.5 M KCl, 0.1% poloxamer 188, 1% sucrose, pH 9.0) and 10 CV of buffer A were used. The load for the CIMmultus QA HR column was prepared by 30-fold dilution of AAV2/8 sample with buffer A and then loaded onto the column. A flow rate of 10 mL/min was used throughout the method. After loading, the column was washed with buffer A in 10 CV, then a linear salt gradient elution was performed from 0 to 50% buffer B in 50 CV gradient, followed by a step gradient to 100% buffer B for 5 CV. The fractions were collected, and the pH was neutralized with 1 M BTP pH 6.5. After elution, a 10 CV CIP (0.1 M NaOH, 2 M NaCl) was performed to collect the fraction, which was pH neutralized with 1 M acetic acid.
Improved QA HR method
To condition the CIMmultus QA HR 1 mL column, 5 CV of buffer A (20 mM Tris, 5 mM MgAc2, 1% sorbitol, 0.1% poloxamer 188, 2.5% EtOH, pH 8.5), 10 CV of buffer C (20 mM Tris, 2 M KAc2, 0.1% poloxamer 188, pH 8.5), 10 CV of buffer B (20 mM Tris, 50 mM MgAc2, 1% sorbitol, 0.1% poloxamer 188, 2.5% EtOH, pH 8.5) and 10 CV of buffer A were used. The load for the CIMmultus QA HR column was prepared by 30-fold dilution of AAV2/8 sample with buffer A and then loaded onto the column. A flow rate of 10 mL/min was used throughout the method. After loading, the column was washed with buffer A in 10 CV, then a linear salt gradient elution was performed from 0 to 100% buffer B in 50 CV, followed by a step gradient to 100% C buffer in 5 CV. After elution, a 10 CV CIP (0.1 M NaOH, 2 M NaCl) was performed to collect the fraction, which was pH neutralized with 1 M acetic acid.
Process parameters screening design
HTS design using CIM QA HR monolithic well plates
Different conditions (Table 1) for the optimization of the elution buffer of the polishing step were tested: two different eluting agents, buffer pH and concentration of the eluent (mM). CIM QA HR 0.2 mL Monolithic 96-Well Plate (2 μm) (Sartorius BIA Separations) with a vacuum manifold (Pall, Bad Kreuznach, Germany) and a vacuum pump (Sartorius) set to a maximum of −20 kPa were used for the experiments. As shown in Table 1 the elution buffers (B) differed in two different eluents (MgAc2 and MgCl2), pH and eluent concentration.
The plate was washed with 16 CV water and conditioned with 16 CV buffer B (20 mM Tris, 1% sorbitol, 2.5% EtOH, 0.1% poloxamer and eluent) and 16 CV buffer A (20 mM Tris, 1% sorbitol, 2.5% EtOH, 0.1% poloxamer). AAV sample in a total amount of 1.00E + 11 vg/well was then applied to the plate, followed by 10 CV buffer A wash, 4 CV elution with buffer B and final 10 CV CIP (0.1 M NaOH, 2 M NaCl). The obtained elution samples were analysed by FLD measurements at excitation 280 nm and emission 348 nm using BioTek Synergy H1 Hybrid Reader (Agilent, Santa Clara, CA, USA) and PATfix biochromatography system using CIMac AAV full/empty 0.1 mL Analytical Column (1.3 µm).
Single column screening design using CIMmultus columns
To confirm the results from HTS using CIM QA HR 0.2 mL Monolithic 96-Well Plate, a single column-based experiment with segmented step washes was performed using CIMmultus QA HR 1 mL (2 µm) column.
To condition the column, 10 CV of buffer C (20 mM Tris, 2 M KAc2, 0.1% poloxamer 188, pH 8.5), 10 CV of buffer B (20 mM Tris, 50 mM MgAc2, 1% sorbitol, 0.1% poloxamer 188, 2.5% EtOH, pH 8.5) and 10 CV of buffer A (20 mM Tris, 5 mM MgAc2, 1% sorbitol, 0.1% poloxamer 188, 2.5% EtOH, pH 8.5) were used. The load for the CIMmultus QA HR column was prepared by 30-fold dilution of AAV2/8 sample with buffer A and then loaded onto the column. The volume of loaded sample was determined by dPCR and MP such that 1.00E + 13 vg was loaded per mL of the column (4.15E + 13 vp/mL column). A flow rate of 10 mL/min was used throughout the method. After loading, the column was washed with 10 CV of buffer A. The step gradient elution was adjusted so that the concentration of eluent (MgAc2) was increased by 6% increments at each step for 15 CV (from 16% to 100% buffer B) to determine the concentration of MgAc2 for elution of empty and full particles and at the end step elution using 5 CV of buffer C was used. After elution, a 10 CV CIP (0.1 M NaOH, 2 M NaCl) was performed.
Capacity runs
Loading linearity
The loading linearity of AAV polishing using QA matrix was evaluated by Specimen QA HR column (0.2 mL monolith extract from the bulk CIMmultus QA HR 80 mL cGMP monolith). MgAc2 driven QA method and buffers were used (see section “Improved QA HR method”). Different loading amounts of the AAV2/8 viral sample were loaded separately onto the Specimen QA HR column until UV absorbance breakthrough was reached and the signal on the plateau was stable. The loading amounts loaded on the column were 2.07E + 13, 4.15E + 13, 2.07E + 14, 4.15E + 14, 2.07E + 15 vp/mL column. Linearity within 3% was determined based on conductivity of peaks elution and resolution between AAV peaks.
Confirmation runs
Since the usual loading ranges are around 1.00E + 14 vp/mL column, we have taken value 2.07E + 14 vp/mL as a reference value for confirmation runs on the CIMmultus 1 mL scale. Our QA HR line offers a consistent elution within ± 3% of peak’s elution conductivity.
The conductivity calibration curve of the elution (Supplementary Fig. 1) was designed from capacity runs using the GeoGebra® [27] and Desmos [28] programs, with a tolerance range of ± 3% (according to QA HR release test) for the conductivity derived from the reference point of 2.07E + 14 vp. Following the design of the conductivity calibration curve, a safety factor of 2 was applied to the loading conditions. Consequently, the system was subjected to a load equivalent to 50% of its calculated capacity. This means that we loaded 1.14E + 14 vg/mL column (equal to 4.73E + 14 vp/mL) for—3% and 5.30E + 12 vg/mL column (equal to 2.20E + 13 vp/mL) for + 3% (Supp. Table 1). After the runs, the main fractions (E2, E3 and E4) were collected and analysed by dPCR, MP and PATfix CIMac AAV.
Formation of step washes
Bind-elute approach
To validate step gradients, the bind-elute approach was used using CIMmultus QA HR 1 mL column with the improved method (see section “Improved QA HR method” buffer composition). The load was prepared by 30-fold dilution of AAV2/8 sample in buffer A. The volume of the loaded sample was determined by dPCR and MP such that 1.00E + 13 vg was loaded per mL of column (4.15E + 13 vp/mL column).
In bind-elute mode the AAV was bound to the column and then different step washes were used to elute the bound AAV. Step washes (40%, 60%, 85% steps of buffer B) for this method were pre-determined in screening design (see section “Method optimization”). Step wash with 40% equals 23.0 mM of MgAc2, 60% equals 32.5 mM of MgAc2 and 85% equals 43.25 mM of MgAc2.
Flow-through (FT) mode approach
Another method to validate step gradients is the FT approach on a CIMmultus QA HR 1 mL column with the selected method from screening (see section “Improved QA HR method” for buffer composition). In FT mode the AAV sample was prepared by 30-fold dilution in 50% buffer B (27.50 mM of MgAc2) to match the conductivity to that stage that the empties are present in FT. Loading amount was the same as in bind-elute approach. After displacement of empties in the FT, 60% buffer B (32.50 mM MgAc2) and 85% buffer B (43.25 mM MgAc2) step wash, pre-determined in screening design, was applied to elute the full AAV from the column.
Scale up
Scaling up from CIMmultus QA HR 1 mL to 8000 mL
CIMmultus QA HR 1 mL, 8 mL, 80 mL columns and Specimen QA HR 0.2 mL from 800 mL and 8000 mL monolith were used for the scale-up. Depending on the column used, two different systems were used: AKTA Pure 150 (1-80 mL) and AKTA Pure 25 (for Specimens), with corresponding flow rates (10 CV/min was used for the 1 mL, 8 mL columns, and Specimens, while 1.5 CV/min was used for the 80 mL column, respectively).
The AAV2/8 sample (Table 2) was prepared by 30-fold dilution in buffer A (see section “Improved QA HR method” for buffer composition). The volume of the loaded sample was determined by dPCR and MP such that 1.00E + 13 vg was loaded per mL of column (equal to 4.15E + 13 vp/mL column).
The predefined FT mode was selected for the method: loading in buffer A (27.50 mM MgAc2); wash: 10 CV buffer A; remaining empty elution: 100% buffer B (32.50 mM MgAc2) for 10 CV; full elution: 100% buffer C (43.50 mM MgAc2) for 10 CV.
Average of analytics presented for recovery (dPCR, PATfix CIMac AAV and MP) were tested in triplicates.
Results
Initial sample characterization
The initial sample was analysed for genomic titer, capsid titer and percentage of genome containing AAV capsids using various analytical methods. The genomic titer measured by dPCR was 3.69E + 12 vg/mL, while the capsid titer measured by ELISA was 1.46E + 13 vp/mL. Percentage of full AAV capsid was analysed in various ways: with dPCR/ELISA ratio; PATfix CIMac AAV; PATfix-UC; MP and CD-MS (Table 2). Additionally, transmission electron microscopy (TEM) and analytical ultracentrifuge (AUC) are commonly used as orthogonal analytical tool to evaluate percentage of full AAV capsid and are generally well aligned with techniques used in this study [29, 30].
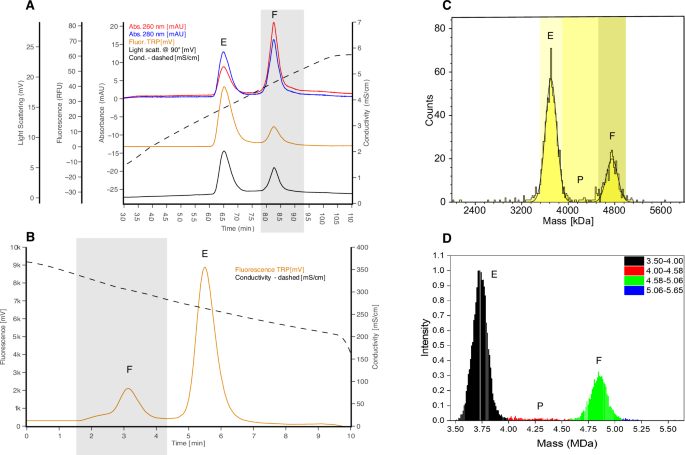
The initial AAV2/8 material was analysed using PATfix analytics in combination with CIMac AAV full/empty 0.1 mL Analytical Column (1.3 µm) with three different detectors (Fig. 1A): UV absorption, tryptophan FLD and MALS. Since the CIMac AAV column is a strong anion exchanger that separates AAV predominantly based on charge, the empty particles which have less electronegative charge elute before the full ones. Peak area integration of tryptophan FLD was used to estimate the E/F ratio (marked in grey) and showed 23.7% of full capsids. The AAV2/8 initial material was also analysed using PATfix-UC (Fig. 1B). Only the FLD signal is shown in the figure. Since UC exhibits a density gradient from denser to less dense, the full AAV capsids on PATfix-UC elute before the partial AAV and empty AAV capsids. Peak area integration of tryptophan FLD was used to estimate the E/F ratio (marked in grey) and showed 21.3% of full capsids. The ratio of empty to full capsids measured with the SamuxMP (Fig. 1C) MP showed 24.1% full AAV capsids in the initial material. The ratio of empty to full capsids measured by CD-MS (Fig. 1D) yielded in 25.1% full AAV capsids. The dPCR/ELISA ratio yielded in 25.3% full capsids. Overall, all orthogonal analytical methods for estimating the percentage of full AAV capsids gave relatively similar results.

A PATfix analytics in combination with CIMac AAV full/empty 0.1 mL Analytical Column (1.3 µm) with three different detectors: UV absorption (280 nm—blue line; 260 nm—red line); FLD (tryptophan—yellow line) and MALS (black line). The first peak corresponds to empty (E) AAV capsids and the second peak, labelled with grey paragraph, corresponds to the full (F) AAV capsids. B FLD signal from PATfix-UC analytics and peak area integration (labelled in grey) of tryptophan FLD for estimation of the E/F ratio. C Mass histogram with the ratio of empty (E), partial (P) and full capsids (F) measured with the SamuxMP. D CD-MS mass size distribution profile reflecting the relative mass and abundance of the separated species (empty (E), partial (P) and full (F) capsids) in initial sample.
Screening and selection of polishing column
After initial sample characterization, three column options with a bed volume of 1 mL were tested for AAV full capsid enrichment: CIMmultus QA HR, CIMmultus PrimaS and CIMmultus PrimaT column. Sample AAV2/8 was loaded with 5.00E + 12 vg/mL column (equal to 2.07E + 13 vp/mL column).
On the CIMmultus QA HR column, which is a strong anion exchanger, we used the conventional method with ascending KCl salt gradient and improved method, previously developed and show to work on analytical scale, which comprises of ascending MgAc2 gradient [23, 31]. The preparative chromatogram reveals that the resolution between empty and full peaks has improved with the latter. Two other columns were also screened for AAV2/8 polishing, CIMmultus PrimaS and CIMmultus PrimaT, both weak anion exchangers with multimodal properties. An ascending pH gradient with a constant salt concentration was used for the CIMmultus PrimaS column, while pH transition from neutral to alkaline conditions and ascending salt gradient using MgCl2 salt was used for the CIMmultus PrimaT (Fig. 2). In the manuscript, the figures show only the elution sections of the chromatographic profiles. For a comprehensive view, the complete chromatograms can be found in the supplementary data (Supplementary Fig. 2).

Main eluates that were collected for analytics are labelled with grey colour. A CIMmultus QA HR column with conventional method and elution by ascending KCl gradient, B CIMmultus QA HR column with improved method and elution by ascending MgAc2 gradient, C CIMmultus PrimaS column and elution by ascending pH gradient and D: CIMmultus PrimaT column and elution by ascending MgCl2 gradient at pH 9.0.
After chromatography main eluates (Fig. 2) were collected and analysed for recovery and for full percentage (Fig. 3). The highest enrichment and recovery of full AAV capsids was observed in the polishing step using the CIMmultus QA HR column using the improved method. With this method, we can observe up to 19% higher percentage of full AAV capsids based on PATfix CIMac AAV analytics due to better resolution obtained as shown on Fig. 3, while maintaining the step recovery compared to the conventional method. Based on these results, the CIMmultus QA HR column provided the best results and was used for further studies.

dPCR mass balance for QA HR conventional was 93%, for QA HR improved 93%, for PrimaS 74% and for PrimaT 100%.
Method optimization
Conditions screening using CIM QA HR Monolithic Well Plates
After selecting the best performing column, we continued with a HTS using a CIM QA HR 0.2 mL Monolithic 96-Well Plate to optimise the buffer conditions.
When evaluating the intrinsic FLD data of the 96-Well Plate eluate samples (Fig. 4), it is observed that FLD signal starts increasing around concentration of 15 mM for eluent MgAc2 and at 20 mM for eluent MgCl2. Additionally, the eluent concentration needed for elution increases with pH. This can be explained by temporarily induced charge properties of AAV capsids when exceeding their native isoelectric point (pI 6-7). At a higher pH, we are further away from the isoelectric point, having more electronegative charge, thus binding more strongly to the positively charged QA, and needing more salt to displace it from the column [32, 33]. Evaluating with a microplate reader that only provides FLD data offers valuable insights into the bind-elute characteristics of the total AAV, which is beneficial for determining the capture step. However, it does not provide information on the elution points of genome-containing capsids or other product-related impurities, such as empty, partially filled, or overfilled capsids. To predict elution of different AAV capsids additional UV absorbance of 260 nm and 280 nm should be assessed [34].

A FLD measurements of main elution samples with MgAc2 eluting agent at different pH, B FLD measurements of main elution samples with MgCl2 eluting agent at different pH.
To further identify the identity of capsids the PATfix analytics with the CIMac AAV full/empty 0.1 mL Analytical Column (1.3 µm) was introduced (Fig. 5). PATfix CIMac AAV allows simultaneous estimation of E/F ratio and cumulative elution profile for wash step selection. It was concluded that MgAc2 eluent has better selectivity for implementation of step gradients since there is a greater concentration difference between empty and full AAV capsids. In the case of MgAc2 eluent at pH 8.5, the difference is higher than 10 mM (25 mM empty and 35 mM beginning of full AAV capsids). On the other hand, when MgCl2 is used as eluent at the same 10 mM concentration the full AAV capsids are already fully eluted (Fig. 5 red curve and corresponding height of the full peak), indicating that better resolution is achieved using MgAc2.

A FLD signal of main elution samples with MgAc2 eluting agent (20 mM, 25 mM, 30 mM, 35 mM) at pH 8.5, B FLD signal of main elution samples with MgCl2 eluting agent (15 mM, 20 mM, 30 mM) at pH 8.5.
Screening using CIMmultus columns
Another approach to HTS using CIM QA HR 0.2 mL Monolithic 96-Well Plate is single column-based experiment with segmented step washes. To confirm the results from HTS the experiments were performed using the CIMmultus QA HR column, where the gradients were adjusted so that the concentration of MgAc2 eluent was increased by 6% at each step to determine the concentration of MgAc2 for elution of empty and full particles (Fig. 6).

The gradients (% of eluent) were adjusted in the way that the concentration of the MgAc2 eluent was increased by 6% at each step to determine the concentration for the elution of empty and full particles.
The majority of empty capsids eluted at 46% of MgAc2, whereas most of the full capsids eluted at around 70% of MgAc2. Converting these percentages to MgAc2 concentrations, 46% corresponds to 25.7 mM and 70% corresponds to 36.5 mM of MgAc2 (Table 3).
The results were compared to the CIM QA HR 0.2 mL Monolithic 96-Well Plate, demonstrating consistency regardless of the option chosen, with only a 4% difference in the necessary mM eluent concentration (Table 3). Both options allow for accurate prediction of the pH binding and elution conditions. If narrower increments (e.g., 3%) were used in the step gradients, the data would be even more comparable.
Capacity runs
Linearity of column challenging
When assessing the capacity, one of the most important parameters is the determination of the linearity of the loading quantity of the column. The linearity represents the range in which a consistent elution profile occurs at the expected eluent concentration. Exceeding the linear range leads to saturation phenomena of the column, which is manifested by peak migration and peak broadening. Exceeding this range further leads to a displacement/weak partitioning effect [35] of the previously eluting species (empty), which is followed by the full species, and thus to the loss of the product. Specimen QA HR (0.2 mL monolith extract from the bulk monolith of CIMmultus QA HR 80 mL cGMP) is ideal media for performing capacity experiments since it exhibits same properties as the parental column but decreases the sample consumption. The binding and elution conditions were selected based on the results in section “Method optimization”.
Figure 7 shows that as the loading amount increases, the elution profile shifts to an earlier retention time. When the column was loaded with 2.07E + 15 vp/mL, a breakthrough of empty capsids occurred (present in FT), significantly altering the chromatographic profile. From this chromatogram, the binding capacity was determined to be ~2.40E + 14 vg/mL or 1.00E + 15 vp/mL.

Column used was Specimen QA HR (0.2 mL monolith extract from the bulk monolith of CIMmultus QA HR 80 mL cGMP). Five different loading amounts of the vector were tested (vp/mL column): 2.07E + 13 (blue line), 4.15E + 13 (yellow line), 2.07E + 14 (green line), 4.15E + 14 (purple line) and 2.07E + 15 (red line). During loading at 2.07E + 15 vp a breakthrough of empty capsids occurred (present in FT).
During process development, the capacity was assessed to identify the minimum and maximum sample amounts that can be loaded onto the column (Table 4). The column loading range of 2.07E + 14 vp/mL was used as a benchmark (Supplementary Fig. 1). It was found that the CIMmultus QA HR line provides a linear loading range within 3%, which corresponds to a column loading of 2.20E + 13 to 4.73E + 14 vp/mL (Suppl. Table 1).
Confirmation runs
After determining the column linearity using the Specimen confirmation runs using the CIMmultus QA HR 1 mL column were performed with minimum (2.20E + 13 vp/mL) and maximum (4.73E + 14 vp/mL) loading range. In both cases, the linear approach was applied, and Fig. 8 shows the chromatographic profile of the two loading ranges, demonstrating that the profile is preserved in both instances.

A loading 2.20E + 13 vp/mL column, B loading 4.73E + 14 vp/mL column.
The main elution fractions (Fig. 8) (E2—empty, E3—partial, E4—full) were collected and evaluated by dPCR, MP and PATfix CIMac AAV analysis. After dPCR analysis, the recovery and mass balance were calculated. In the main eluate (E4 fraction), about 70% of vector recovery was achieved. The mass balance by dPCR, if one considers all fractions, exceeded 90% (Fig. 9). The achieved purity (% full) of the main eluate (E4 fraction) was about 95% determined by PATfix CIMac AAV analysis and about 75% using the MP in both loading ranges (Fig. 9). Higher values can be seen using the PATfix CIMac AAV analysis, which can be attributed to lower resolution between AAV species and summation effect of overlapping peaks.

Main elution fraction (E4) from preparative chromatography with a loading of 2.20E + 13 vp/mL column (grey columns) and a loading of 4.73E + 14 vp/mL column (yellow column), analysed for step recovery and mass balance by dPCR and purity by MP and PATfix CIMac AAV.
If one takes closer look to the PATfix CIMac AAV analysis chromatogram (Fig. 10), where fractions from chromatogram Fig. 8B were analysed it is possible to get an indication that the E3 fraction consists of a subpopulation of AAV whose charge properties are higher than those of the empty particles, but lower than those of the full particles.

PATfix CIMac AAV analytics (FLD shown) of main fractions (E2 fraction—yellow line, E3 fraction—blue line and E4 fraction – red line) from preparative chromatography.
Formation of step washes
Bind-elute and FT mode
To validate the step gradients, the “bind-elute and FT” approach was used using CIMmultus QA HR 1 mL column with the improved method. Before the CIMmultus QA HR line was introduced in October 2023, linear gradients were generally used to avoid differences of the column properties. The introduction of the CIMmultus QA HR column enables the application of step-wash elutions, which can be executed in two distinct modes: bind-elute and FT mode.
In the bind-elute mode (Fig. 11A), the AAV2/8 was bound and then three step washes (40%, 60% and 85% of buffer B) were applied to elute the AAV2/8, i.e. to displace first the empty, then species eluting between empty and full and lastly also the full particles. In the FT mode (Fig. 11B), the conductivity of the buffer was adjusted so that the empty particles were present in the FT and only two washes (60% and 85% of buffer B) were implemented.

A Bind-elute and B FT approach with step wash elutions using CIMmultus QA HR 1 mL column with the improved method.
Comparing the recovery (dPCR) and the percentage of full particles (MP and PATfix CIMac AAV) for the bind-elute and FT modes, it is evident that both approaches provide comparable recovery and purity of the full AAV capsid. The step recovery from dPCR analysis shows about 80% of the viral vector and a purity of about 80% for MP and about 95% for PATfix CIMac AAV (Fig. 12). The bind-elute approach offers more safety and control over loading and elution steps; however FT approach opens possibilities for less buffer consumption.

Comparison of dPCR recovery and percentage of full particles (MP and PATfix CIMac AAV) for bind-elute (grey columns) and FT mode (yellow columns).
Scale up
Specimen and parental column scaling up comparison
After optimising the method and step washes CIMmultus QA HR line was tested across entire range from 1 mL, 8 mL, 80 mL columns and due to sample availability Specimen QA HR 0.2 mL for 800 mL and 8000 mL columns were used.
Scaling from the Specimen to the parental column resulted in comparable data. Figure 13A shows a chromatogram in which the solid line represents the parental column, and the dashed line represents its Specimen. The chromatographic profile when performing step washes is the same and overlays its parental column perfectly. In the analytical comparison of Specimen and the parental column, the main fraction was analysed for recovery and for the percentage of full particles, respectively. The recovery and the percentage of full particles show the same results for the Specimen and for the parental column (Fig. 13B), indicating that the Specimen is a representative of the CIMmultus larger columns.

A Preparative chromatogram overlay of parental column—solid line and its Specimen—dashed line. B Specimen and the parental column analytical comparison of recovery by dPCR, PATfix CIMac AAV and MP, and the percentage of full particles by PATfix CIMac AAV, MP and UC.
Scaling up from CIMmultus QA HR 1 mL to 8000 mL
After confirming that the Specimen is a representative of the CIMmultus scale the scale up from CIMmultus QA HR 1 mL to 8000 mL was performed.
The step washes were conducted with individually prepared buffers based on the actual eluent concentration rather than relying on the percentage of B pump mix of a buffer set A/B. In addition, the buffer temperature was adjusted to the working temperature range during preparation and the exact amount of titrant was determined based on the temperature sensitivity of the Tris-based buffer systems. Such implementations, including adjusting the column size to the most appropriate chromatography system to avoid dispersion effects, are part of the cGMP and are crucial for control when transferring the method to production scale.
Once the peak began to elute, the peak was collected for 4 column volumes. Figure 14 shows a consistent elution profile (main eluate in C section) over the entire tested scale. The elution shift seen in Fig. 14 is due to the different chromatography systems being used and do not correspond to the column difference.

CIMmultus QA HR 1 mL (red line), 8 mL (purple line), 80 mL (blue line), Specimen QA HR extracted from 800 mL (s. 800 mL, orange line) and Specimen QA HR extracted from 8000 mL (s. 8000 mL, brown line) with flow through approach. A chromatogram for the entire elution section and B section C main elution zoom-in.
The main elution fraction was analysed in triplicates for vector genome recovery using dPCR, PATfix CIMac AAV and MP analysis. The average cross-scale recovery of the vector genome after dPCR was 75% ± 10%, after PATfix CIMac AAV 79% ± 5% and after MP 78% ± 3%, within the entire tested scale (Table 5). PATfix CIMac AAV, PATfix-UC, MP and CD-MS analysis were used to determine the percentage of the full AAV capsids. The average percentage of genome containing AAV capsids across entire scale was 99% ± 0% using PATfix CIMac AAV, 86% ± 1% using PATfix-UC, 80% ± 4% using MP and 87% ± 1% using CD-MS for the entire tested scale (Table 5). Data confirms great reproducibility across entire scale when using step washes.
By comparing the orthogonal analysis of the initial sample and the final enriched sample (QA HR eluate) side by side using the example of the 80 mL column, it can be concluded that initial sample was enriched from 25% to 75% or 100% of the full AAV capsids, depending on analytics used (Table 6).
Discussion
With AAV manufacturing, different process, and product related impurities are co-produced alongside full capsids. One of the major challenges is separation of empty, full and also other intermediate capsids. Beside this, scaling up the downstream processing is still a cumbersome task.
This study highlights the capabilities of monolithic chromatography, on example but not limited to AAV serotype 2/8, that enables using high flow rates without affecting the resolution and capacity between different AAV subpopulations, making them ideal for large-scale applications. Development of new CIMmultus QA HR line which offers a consistent elution within 3% of peak’s elution conductivity and introduction of the improved method enabled to enrich the full AAV capsids to more than 80% with the genome recovery around 80%. Additionally, successful scale up of the purification process from 1 mL to 8000 mL scale is realised.
Screening of three different polishing columns was performed. The highest enrichment and recovery of the full AAV capsids was observed using the CIMmultus QA HR column in combination with the improved method. After that HTS of various conditions was performed using CIM QA HR 96-Well Plate to define binding and elution salt concentrations. Additionally, a single column-based experiment using 1 mL CIMmultus QA HR column confirmed and aligned with the results obtained using the 96-Well Plate. In the next stage, linear range of the column capacity was determined and corresponds to a column loading of app. 2.00E + 13 to 5.00E + 14 vp/mL of column.
Due to high reproducibility of CIMmultus QA HR columns, development of step elution method with reproducible results is possible, either as bind-elute mode or FT mode. Based on recovery and purity, both approaches provide comparable recovery (81 ± 3% by dPCR) and purity (76 ± 1% by MP) for the full AAV capsids.
In conclusion, based on optimised AAV polishing method using FT and step elution approach, successful scale up of the process from CIMmultus QA HR 1 mL to 8000 mL scale was performed. The process yielded average recovery within entire scale and accounting of all analytics to be 77% ± 3% and the purity of the full AAV capsids to be 88% ± 9%.
This research underscores the importance of attaining a consistent high percentage of full vectors to produce an AAV product that is both safe and effective at all purification scales, from research, process development and up to manufacturing. The guide for successful empty and full separation starts with initial sample characterization using advanced analytical tools to understand composition and purity. Next, selecting the right column chemistry is key, with monolithic columns providing consistent elution and enhanced purity. Process optimization involves high-throughput screening to refine conditions such as buffer compositions and pH levels. This is followed by determination of the optimal AAV loading density range before step elution, using small-scale columns to minimize sample consumption. For efficient AAV E/F separation, strategies like flow-through mode can be employed to streamline the process and reduce buffer use, replacing conventional large-scale bind-elute methods for simplicity and fewer errors. Transitioning from a linear gradient to a step gradient in AAV purification processes can substantially improve both time and cost efficiency. The main advantages include increased scalability and cost-effectiveness, as step gradients with AEX chromatography columns are more scalable than traditional methods, leading to lower costs due to reduced unit requirements or labour for purification (Table 7).
Refining the purification process is crucial to eliminate product and process related impurities and guarantee that a consistently high-quality vector is provided to patients.
Data availability
Data generated and analysed during this study can be found within the published article and supplementary files, and additional data are available from the corresponding author upon reasonable request.
References
-
Wang J-H, Gessler DJ, Zhan W, Gallagher TL, Gao G. Adeno-associated virus as a delivery vector for gene therapy of human diseases. Sig Transduct Target Ther. 2024;9:1–33.
-
Hamilton BA, Wright JF. Challenges posed by immune responses to AAV vectors: addressing root causes. Front Immunol; 12. Epub ahead of print 17 May 2021. https://doi.org/10.3389/fimmu.2021.675897.
-
Leskovec M, Raspor A, Fujs V, Mihevc A, Štrancar A. Preferential exclusion chromatography as a capture step for extracellular AAV harvest from adherent and suspension productions. Electrophoresis. 2023;44:1934–42.
-
Qu G, Bahr-Davidson J, Prado J, Tai A, Cataniag F, McDonnell J, et al. Separation of adeno-associated virus type 2 empty particles from genome containing vectors by anion-exchange column chromatography. J Virol Methods. 2007;140:183–92.
-
Srivastava A, Mallela KMG, Deorkar N, Brophy G. Manufacturing challenges and rational formulation development for AAV viral vectors. J Pharmaceutical Sci. 2021;110:2609–24.
-
Meierrieks F, Weltken A, Pflanz K, Pickl A, Graf B, Wolff MW. A novel and simplified anion exchange flow-through polishing approach for the separation of full from empty adeno-associated virus capsids. Biotechnol J. 2024;19:e202400430.
-
McColl-Carboni A, Dollive S, Laughlin S, Lushi R, MacArthur M, Zhou S, et al. Analytical characterization of full, intermediate, and empty AAV capsids. Gene Ther. 2024;31:285–94.
-
Joshi PRH, Bernier A, Moço PD, Schrag J, Chahal PS, Kamen A. Development of a scalable and robust AEX method for enriched rAAV preparations in genome-containing VCs of serotypes 5, 6, 8, and 9. Mol Therapy Methods Clin Dev. 2021;21:341–56.
-
Ayuso E, Mingozzi F, Bosch F. Production, purification and characterization of adeno-associated vectors. Curr Gene Ther. 2010;10:423–36.
-
Peljhan S, Štokelj M, Prebil SD, Gagnon P, Štrancar A. Multiple-parameter profiling of density gradient ultracentrifugation for characterization of empty and full capsid distribution in AAV preparations. Cell Gene Therapy Insights. 2021;7:161–9.
-
Smith J, Grieger J, Samulski J. Overcoming Bottlenecks in AAV Manufacturing for Gene Therapy. Cell Gene Therapy Insights. 2018;4:815–27.
-
Kaludov N, Handelman B, Chiorini JA. Scalable purification of adeno-associated virus type 2, 4, or 5 using ion-exchange chromatography. Hum Gene Ther. 2002;13:1235–43.
-
Rogerson T, Xi G, Ampey A, Borman J, Jaroudi S, Pappas D, et al. Purification of a recombinant oncolytic virus from clarified cell culture media by anion exchange monolith chromatography. Electrophoresis. 2023;44:1923–33.
-
Barut M, Podgornik A, Urbas L, Gabor B, Brne P, Vidic J, et al. Methacrylate-based short monolithic columns: enabling tools for rapid and efficient analyses of biomolecules and nanoparticles. J Sep Sci. 2008;31:1867–80.
-
Miklavčič R, Simčič T, Rotar S, Komel P, Žigon R, Pavlovič D, et al. Development and validation of AAV capsids separation on specimen columns for reproducibility evaluation of large-scale chromatographic monoliths. J Separation Sci. 2025;48:e70114.
-
Komel P, Simčič T, Miklavčič R, Ipavec D, Kukanja D, Bergoč I, et al. High Reproducibility, Homogeneity, and Scalability of CIM® QA HR Chromatographic Monoliths Demonstrated by Separation of Empty and Full AAV Capsids. Sartorius BIA Separations, https://www.biaseparations.com/library_items/high-reproducibility-homogeneity-and-scalability-of-cim-qa-hr-chromatographic-monoliths-demonstrated-by-separation-of-empty-and-full-aav-capsids/ (2024, accessed 3 July 2024).
-
Keller WR, Picciano A, Wilson K, Xu J, Khasa H, Wendeler M. Rational downstream development for adeno-associated virus full/empty capsid separation – A streamlined methodology based on high-throughput screening and mechanistic modeling. J Chromatogr A. 2024;1716:464632.
-
Lavoie RA, Zugates JT, Cheeseman AT, Teten MA, Ramesh S, Freeman JM, et al. Enrichment of adeno-associated virus serotype 5 full capsids by anion exchange chromatography with dual salt elution gradients. Biotechnol Bioeng. 2023;120:2953–68.
-
Bažec K, Krašna M, Mihevc A, Leskovec M, Štrancar A, Tajnik Sbaizero M. Optimization of rAAV capture step purification using SO3 monolith chromatography. Electrophoresis. 2023;44:1943–52.
-
Heldt CL, Areo O, Joshi PU, Mi X, Ivanova Y, Berrill A. Empty and full AAV capsid charge and hydrophobicity differences measured with single-particle AFM. Langmuir. 2023;39:5641–8.
-
Rotar S, Miklavčič R, Simčič T, Černigoj U, Vidič J Influence of Chromatographic Parameters on Empty | Full AAV Separation. Sartorius BIA Separations, https://www.biaseparations.com/library_items/influence-of-chromatographic-parameters-on-empty-full-aav-separation/ (2024, accessed 3 July 2024).
-
Žvanut T, Livk AG, Štrancar A AAV capsids separation is critical for advancing gene therapies. Cell Gene Ther Insights. Epub ahead of print 20 May 2024. https://doi.org/10.18609/cgti.2024.063.
-
Žvanut T, Peljhan S, Leban S, Štrancar A. Enhanced separation of AAV capsids using analytical anion exchange monolithic columns: emphasis on organic modifiers. Anal Chim Acta.
-
Nestola P, Peixoto C, Silva RRJS, Alves PM, Mota JPB, Carrondo MJT. Improved virus purification processes for vaccines and gene therapy. Biotechnol Bioeng. 2015;112:843–57.
-
Lorek JK, Isaksson M, Nilsson B. Chromatography in downstream processing of recombinant adeno-associated viruses: a review of current and future practises. Biotechnol Bioeng. 2025;122:1067–86.
-
Barnes LF, Draper BE, Chen Y-T, Powers TW, Jarrold MF. Quantitative analysis of genome packaging in recombinant AAV vectors by charge detection mass spectrometry. Mol Ther Methods Clin Dev. 2021;23:87–97.
-
GeoGebra—the world’s favorite, free math tools used by over 100 million students and teachers. GeoGebra, https://www.geogebra.org (accessed 13 March 2025).
-
Desmos | Beautiful free math., https://www.desmos.com/ (accessed 13 March 2025).
-
Fu X, Chen W-C, Argento C, Clarner P, Bhatt V, Dickerson R, et al. Analytical strategies for quantification of adeno-associated virus empty capsids to support process development. Hum Gene Ther Methods. 2019;30:144–52.
-
Werle AK, Powers TW, Zobel JF, Wappelhorst CN, Jarrold MF, Lyktey NA, et al. Comparison of analytical techniques to quantitate the capsid content of adeno-associated viral vectors. Mol Ther Methods Clin Dev. 2021;23:254–62.
-
Štrancar A, Žvanut T, Zigon R, Leskovec M, Livk AG, Koren JM. A Method of Enhanced Separation of Full Adeno-Associated Virus (aav) Capsids, https://patentscope.wipo.int/search/en/detail.jsf?docId=WO2024252024 (2024, accessed 11 March 2025).
-
Wang C, Mulagapati SHR, Chen Z, Du J, Zhao X, Xi G, et al. Developing an anion exchange chromatography assay for determining empty and full capsid contents in AAV6.2. Mol Ther Methods Clin Dev. 2019;15:257–63.
-
Venkatakrishnan B, Yarbrough J, Domsic J, Bennett A, Bothner B, Kozyreva O, et al. Structure and dynamics of adeno-associated virus serotype 1 VP1-unique N-TErminal Domain and Its Role in Capsid Trafficking. J Virol. 87. Epub ahead of print 9 April 2013. https://doi.org/10.1128/JVI.02524-12.
-
Sommer JM, Smith PH, Parthasarathy S, Isaacs J, et al. Quantification of adeno-associated virus particles and empty capsids by optical density measurement. Mol Therapy. 2003;7:122–8.
-
Černigoj U, Martinuč U, Cardoso S, Sekirnik R, Krajnc NL, Štrancar A. Sample displacement chromatography of plasmid DNA isoforms. J Chromatograph A. 2015;1414:103–9.
-
Lyle A, Stamatis C, Linke T, Hulley M, Schmelzer A, Turner R, et al. Process economics evaluation and optimization of adeno-associated virus downstream processing. Biotechnol Bioeng. 2024;121:2435–48.
-
Jungbauer A, Wheelwright S. Downstream processing of AAV based gene therapy vectors. Separation Purification Techno. 2025;368:133051.
-
Thakur G, Mink S, Garcia AJ, Bak H, Tustian AD. A two-pass anion-exchange chromatography strategy for enrichment of full capsids in manufacturing of adeno-associated viral vectors. Mol Therapy Methods Clin Dev. 2025;33:101441.
-
Zwi-Dantsis L, Mohamed S, Massaro G, Moeendarbary E. Adeno-associated virus vectors: principles, practices, and prospects in gene therapy. Viruses. 2025;17:239.
Acknowledgements
The authors would like to express their gratitude to the following individuals for their invaluable contributions that significantly enhanced the quality of this research project. They would like to express their sincere gratitude to the members of Process Development for Viral Vectors and Vaccines. To Petra Dekleva and Ivana Petrović Koshmak for upstream AAV2/8 viral material preparation. To Maja Štokelj, Janja Merkelj Koren and Mirjam Krašna for downstream AAV2/8 viral material preparation. To Andrej Mihevc for PATfix analysis and to Sandra Potušek, Melita Semič and Marko Šnajder for their assistance with the dPCR analysis. To Maja Krapež for buffer preparation. The study would not be feasible to complete without help and guidance from Product manager for AAV Ažbe Žnidaršič.
Funding
All authors were employed by the company Sartorius BIA Separations d.o.o. The monolithic columns, consumables, liquid chromatography instruments and services used in this research were paid for and made available by Sartorius BIA Separations d.o.o.
Ethics declarations
Competing interests
The authors declare no competing interests.
Ethical approval
In this study, we utilized the HEK293 cell line, which is a widely recognized and extensively used cell line in scientific research. The HEK293 cells were employed to generate AAV sample material (E and F species). All procedures involving these cells were conducted following standard laboratory protocols and institutional guidelines.
Additional information
Publisher’s note Springer Nature remains neutral with regard to jurisdictional claims in published maps and institutional affiliations.
Supplementary information
Rights and permissions
Open Access This article is licensed under a Creative Commons Attribution-NonCommercial-NoDerivatives 4.0 International License, which permits any non-commercial use, sharing, distribution and reproduction in any medium or format, as long as you give appropriate credit to the original author(s) and the source, provide a link to the Creative Commons licence, and indicate if you modified the licensed material. You do not have permission under this licence to share adapted material derived from this article or parts of it. The images or other third party material in this article are included in the article’s Creative Commons licence, unless indicated otherwise in a credit line to the material. If material is not included in the article’s Creative Commons licence and your intended use is not permitted by statutory regulation or exceeds the permitted use, you will need to obtain permission directly from the copyright holder. To view a copy of this licence, visit http://creativecommons.org/licenses/by-nc-nd/4.0/.
About this article

Cite this article
Žigon, R., Drmota Prebil, S., Švigelj, T. et al. Optimization and scale up strategies for reproducible AAV enrichment step on CIMmultus® QA HR line. Gene Ther (2026). https://doi.org/10.1038/s41434-026-00594-5
-
Received:
-
Revised:
-
Accepted:
-
Published:
-
Version of record:
-
DOI: https://doi.org/10.1038/s41434-026-00594-5