Data availability
All generated data and analyses, information and results for this study are included in this Article’s figures, extended data figures and supplementary datasets. Data are available at GitHub (https://github.com/Prenauer/OR7A10_NK_GOF_2025). Raw sequencing data are available for download from the Gene Expression Omnibus with the super-series accession number GSE309802 (https://www.ncbi.nlm.nih.gov/geo/query/acc.cgi?acc=GSE309802). Original cell lines are available at the commercial sources listed in the Methods and/or the Reporting Summary. Source data are provided with this paper.
Code availability
The code used for data analyses and the generation of figures related to this study is available from GitHub (https://github.com/Prenauer/OR7A10_NK_GOF_2025).
References
-
Vivier, E., Tomasello, E., Baratin, M., Walzer, T. & Ugolini, S. Functions of natural killer cells. Nat. Immunol. 9, 503–510 (2008).
-
Ben-Shmuel, A., Biber, G. & Barda-Saad, M. Unleashing natural killer cells in the tumor microenvironment—the next generation of immunotherapy?. Front. Immunol. 11, 275 (2020).
-
Guillerey, C., Huntington, N. D. & Smyth, M. J. Targeting natural killer cells in cancer immunotherapy. Nat. Immunol. 17, 1025–1036 (2016).
-
Morvan, M. G. & Lanier, L. L. NK cells and cancer: you can teach innate cells new tricks. Nat. Rev. Cancer 16, 7–19 (2016).
-
Raulet, D. H. & Guerra, N. Oncogenic stress sensed by the immune system: role of natural killer cell receptors. Nat. Rev. Immunol. 9, 568–580 (2009).
-
Crinier, A., Narni-Mancinelli, E., Ugolini, S. & Vivier, E. SnapShot: natural killer cells. Cell 180, 1280–1280 (2020).
-
Lanier, L. L. Up on the tightrope: natural killer cell activation and inhibition. Nat. Immunol. 9, 495–502 (2008).
-
Myers, J. A. & Miller, J. S. Exploring the NK cell platform for cancer immunotherapy. Nat. Rev. Clin. Oncol. 18, 85–100 (2021).
-
Huntington, N. D., Cursons, J. & Rautela, J. The cancer–natural killer cell immunity cycle. Nat. Rev. Cancer 20, 437–454 (2020).
-
Bald, T., Krummel, M. F., Smyth, M. J. & Barry, K. C. The NK cell–cancer cycle: advances and new challenges in NK cell-based immunotherapies. Nat. Immunol. 21, 835–847 (2020).
-
Elahi, R., Heidary, A. H., Hadiloo, K. & Esmaeilzadeh, A. Chimeric antigen receptor-engineered natural killer (CAR NK) cells in cancer treatment; recent advances and future prospects. Stem Cell Rev. Rep. 17, 2081–2106 (2021).
-
Marofi, F. et al. Renaissance of armored immune effector cells, CAR-NK cells, brings the higher hope for successful cancer therapy. Stem Cell Res. Ther. 12, 200 (2021).
-
Dagher, O. K. & Posey, A. D. Jr. Forks in the road for CAR T and CAR NK cell cancer therapies. Nat. Immunol. 24, 1994–2007 (2023).
-
Hu, W., Wang, G., Huang, D., Sui, M. & Xu, Y. Cancer immunotherapy based on natural killer cells: current progress and new opportunities. Front. Immunol. 10, 1205 (2019).
-
Albinger, N., Hartmann, J. & Ullrich, E. Current status and perspective of CAR-T and CAR-NK cell therapy trials in Germany. Gene Ther. 28, 513–527 (2021).
-
Wrona, E., Borowiec, M. & Potemski, P. CAR-NK cells in the treatment of solid tumors. Int. J. Mol. Sci. 22, 5899 (2021).
-
Portillo, A. L. et al. Expanded human NK cells armed with CAR uncouple potent anti-tumor activity from off-tumor toxicity against solid tumors. iScience 24, 102619 (2021).
-
Shimasaki, N., Jain, A. & Campana, D. NK cells for cancer immunotherapy. Nat. Rev. Drug Discov. 19, 200–218 (2020).
-
Cozar, B. et al. Tumor-infiltrating natural killer cells. Cancer Discov. 11, 34–44 (2021).
-
Christodoulou, I. et al. Engineering CAR-NK cells to secrete IL-15 sustains their anti-AML functionality but is associated with systemic toxicities. J. Immunother. Cancer 9, e003894 (2021).
-
Vivier, E. et al. Natural killer cell therapies. Nature 626, 727–736 (2024).
-
Bernard, P. L. et al. Targeting CISH enhances natural cytotoxicity receptor signaling and reduces NK cell exhaustion to improve solid tumor immunity. J. Immunother. Cancer 10, e004244 (2022).
-
Delconte, R. B. et al. CIS is a potent checkpoint in NK cell-mediated tumor immunity. Nat. Immunol. 17, 816–824 (2016).
-
Zhu, H. et al. Metabolic reprograming via deletion of CISH in human iPSC-derived NK cells promotes in vivo persistence and enhances anti-tumor activity. Cell Stem Cell 27, 224–237 (2020).
-
Delconte, R. B. et al. NK cell priming from endogenous homeostatic signals is modulated by CIS. Front. Immunol. 11, 75 (2020).
-
Nakazawa, T. et al. CIS deletion by CRISPR/Cas9 enhances human primary natural killer cell functions against allogeneic glioblastoma. J. Exp. Clin. Cancer Res. 42, 205 (2023).
-
Morimoto, T. et al. CRISPR–Cas9-Mediated TIM3 knockout in human natural killer cells enhances growth inhibitory effects on human glioma cells. Int. J. Mol. Sci. 22, 3489 (2021).
-
Mac Donald, A. et al. KLRC1 knockout overcomes HLA-E-mediated inhibition and improves NK cell antitumor activity against solid tumors. Front. Immunol. 14, 1231916 (2023).
-
Qin, Y. et al. Developing enhanced immunotherapy using NKG2A knockout human pluripotent stem cell-derived NK cells. Cell Rep. 43, 114867 (2024).
-
Nakazawa, T. et al. Characterization of HIF-1α knockout primary human natural killer cells including populations in allogeneic glioblastoma. Int. J. Mol. Sci. 25, 5896 (2024).
-
Ni, J. et al. Single-cell RNA sequencing of tumor-infiltrating NK cells reveals that inhibition of transcription factor HIF-1α unleashes NK cell activity. Immunity 52, 1075–1087 (2020).
-
Peng, L. et al. In vivo AAV–SB-CRISPR screens of tumor-infiltrating primary NK cells identify genetic checkpoints of CAR-NK therapy. Nat. Biotechnol. 43, 752–761 (2025).
-
Rafei, H. et al. CREM is a regulatory checkpoint of CAR and IL-15 signalling in NK cells. Nature 643, 1076–1086 (2025).
-
Zhang, X. et al. Gene knockout in cellular immunotherapy: application and limitations. Cancer Lett. 540, 215736 (2022).
-
Konermann, S. et al. Genome-scale transcriptional activation by an engineered CRISPR–Cas9 complex. Nature 517, 583–588 (2015).
-
Zhou, X., Renauer, P. A., Zhou, L., Fang, S. Y. & Chen, S. Applications of CRISPR technology in cellular immunotherapy. Immunol. Rev. 320, 199–216 (2023).
-
Chen, H. et al. APLN promotes hepatocellular carcinoma through activating PI3K/Akt pathway and is a druggable target. Theranostics 9, 5246–5260 (2019).
-
Wang, Q. et al. APLN promotes the proliferation, migration, and glycolysis of cervical cancer through the PI3K/AKT/mTOR pathway. Arch. Biochem. Biophys. 755, 109983 (2024).
-
Patel, S. J. et al. Identification of essential genes for cancer immunotherapy. Nature 548, 537–542 (2017).
-
Karagiota, A., Kanoura, A., Paraskeva, E., Simos, G. & Chachami, G. Pyruvate dehydrogenase phosphatase 1 (PDP1) stimulates HIF activity by supporting histone acetylation under hypoxia. FEBS J. 290, 2165–2179 (2023).
-
Song, Y., Zhang, J., Zhang, L., Zhang, S. & Shen, C. PDP1 promotes cell malignant behavior and is associated with worse clinical features in ovarian cancer patients: evidence from bioinformatics and in vitro level. Comput. Math. Methods Med. 2022, 7397250 (2022).
-
Yuan, M. et al. PDP1 promotes KRAS mutant colorectal cancer progression by serving as a scaffold for BRAF and MEK1. Cancer Lett. 597, 217007 (2024).
-
Alshamleh, I. et al. PDP1 is a key metabolic gatekeeper and modulator of drug resistance in FLT3-ITD-positive acute myeloid leukemia. Leukemia 37, 2367–2382 (2023).
-
Marin, D. et al. Safety, efficacy and determinants of response of allogeneic CD19-specific CAR-NK cells in CD19+ B cell tumors: a phase 1/2 trial. Nat. Med. 30, 772–784 (2024).
-
Kremer, V. et al. Genetic engineering of human NK cells to express CXCR2 improves migration to renal cell carcinoma. J. Immunother. Cancer 5, 73 (2017).
-
Sun, Y. et al. Adaptive NK cells exhibit tumor-specific immune memory and cytotoxicity in ovarian cancer. Cancer Immunol. Res. 13, 1080–1097 (2025).
-
Liu, E. et al. Cord blood NK cells engineered to express IL-15 and a CD19-targeted CAR show long-term persistence and potent antitumor activity. Leukemia 32, 520–531 (2018).
-
Liu, E. et al. Use of CAR-transduced natural killer cells in CD19-positive lymphoid tumors. N. Engl. J. Med. 382, 545–553 (2020).
-
Choi, C. & Finlay, D. K. Optimising NK cell metabolism to increase the efficacy of cancer immunotherapy. Stem Cell Res. Ther. 12, 320 (2021).
-
Egli, L. et al. CAR T cells outperform CAR NK cells in CAR-mediated effector functions in head-to-head comparison. Exp. Hematol. Oncol. 13, 51 (2024).
-
Modak, S., Kramer, K., Gultekin, S. H., Guo, H. F. & Cheung, N. K. Monoclonal antibody 8H9 targets a novel cell surface antigen expressed by a wide spectrum of human solid tumors. Cancer Res. 61, 4048–4054 (2001).
-
Ahmed, M. et al. Humanized affinity-matured monoclonal antibody 8H9 has potent antitumor activity and binds to FG loop of tumor antigen B7-H3. J. Biol. Chem. 290, 30018–30029 (2015).
-
Ye, L. et al. In vivo CRISPR screening in CD8 T cells with AAV-Sleeping Beauty hybrid vectors identifies membrane targets for improving immunotherapy for glioblastoma. Nat. Biotechnol. 37, 1302–1313 (2019).
-
Langmead, B., Trapnell, C., Pop, M. & Salzberg, S. L. Ultrafast and memory-efficient alignment of short DNA sequences to the human genome. Genome Biol. 10, R25 (2009).
-
Allen, F. et al. JACKS: joint analysis of CRISPR/Cas9 knockout screens. Genome Res. 29, 464–471 (2019).
-
Lun, A. T., Chen, Y. & Smyth, G. K. It’s DE-licious: a recipe for differential expression analyses of RNA-seq experiments using quasi-likelihood methods in edgeR. Methods Mol. Biol. 1418, 391–416 (2016).
-
Li, W. et al. MAGeCK enables robust identification of essential genes from genome-scale CRISPR/Cas9 knockout screens. Genome Biol. 15, 554 (2014).
-
Kim, E. & Hart, T. Improved analysis of CRISPR fitness screens and reduced off-target effects with the BAGEL2 gene essentiality classifier. Genome Med. 13, 2 (2021).
-
Jeong, H. H., Kim, S. Y., Rousseaux, M. W. C., Zoghbi, H. Y. & Liu, Z. Beta-binomial modeling of CRISPR pooled screen data identifies target genes with greater sensitivity and fewer false negatives. Genome Res. 29, 999–1008 (2019).
-
Jia, G., Wang, X. & Xiao, G. A permutation-based non-parametric analysis of CRISPR screen data. BMC Genomics 18, 545 (2017).
-
Wang, T. et al. Identification and characterization of essential genes in the human genome. Science 350, 1096–1101 (2015).
-
Wang, T. et al. Gene essentiality profiling reveals gene networks and synthetic lethal interactions with oncogenic Ras. Cell 168, 890–903 (2017).
-
Aguirre, A. J. et al. Genomic copy number dictates a gene-independent cell response to CRISPR/Cas9 targeting. Cancer Discov. 6, 914–929 (2016).
-
Meyers, R. M. et al. Computational correction of copy number effect improves specificity of CRISPR–Cas9 essentiality screens in cancer cells. Nat. Genet. 49, 1779–1784 (2017).
-
Hart, T. et al. High-resolution CRISPR screens reveal fitness genes and genotype-specific cancer liabilities. Cell 163, 1515–1526 (2015).
-
Sullivan, R. J. et al. First-in-class ERK1/2 inhibitor ulixertinib (BVD-523) in patients with MAPK mutant advanced solid tumors: results of a Phase I dose-escalation and expansion study. Cancer Discov. 8, 184–195 (2018).
-
Lei, W. et al. Safety and feasibility of 4-1BB co-stimulated CD19-specific CAR-NK cell therapy in refractory/relapsed large B cell lymphoma: a phase 1 trial. Nat. Cancer 6, 786–800 (2025).
-
Albinger, N. et al. Primary CD33-targeting CAR-NK cells for the treatment of acute myeloid leukemia. Blood Cancer J. 12, 61 (2022).
-
Guo, S. et al. CD70-specific CAR NK cells expressing IL-15 for the treatment of CD19-negative B-cell malignancy. Blood Adv. 8, 2635–2645 (2024).
-
Bexte, T. et al. CRISPR/Cas9 editing of NKG2A improves the efficacy of primary CD33-directed chimeric antigen receptor natural killer cells. Nat. Commun. 15, 8439 (2024).
-
Frankish, A. et al. Gencode 2021. Nucleic Acids Res. 49, D916–D923 (2021).
-
Hao, Y. et al. Dictionary learning for integrative, multimodal and scalable single-cell analysis. Nat. Biotechnol. 42, 293–304 (2024).
-
Welch, J. D. et al. Single-cell multi-omic integration compares and contrasts features of brain cell identity. Cell 177, 1873–1887 (2019).
-
Tang, F. et al. A pan-cancer single-cell panorama of human natural killer cells. Cell 186, 4235–4251 (2023).
-
Bergen, V., Lange, M., Peidli, S., Wolf, F. A. & Theis, F. J. Generalizing RNA velocity to transient cell states through dynamical modeling. Nat. Biotechnol. 38, 1408–1414 (2020).
-
Aibar, S. et al. SCENIC: single-cell regulatory network inference and clustering. Nat. Methods 14, 1083–1086 (2017).
-
Schaefer, C. F. et al. PID: the Pathway Interaction Database. Nucleic Acids Res. 37, D674–D679 (2009).
-
Liberzon, A. et al. The Molecular Signatures Database (MSigDB) hallmark gene set collection. Cell Syst. 1, 417–425 (2015).
-
Rosskopf, S. et al. A Jurkat 76 based triple parameter reporter system to evaluate TCR functions and adoptive T cell strategies. Oncotarget 9, 17608–17619 (2018).
Acknowledgements
We thank H. Zhao, J. Burdekin and various other laboratory members for assistance; all members of the Chen Laboratory and various colleagues at Yale for assistance and/or discussion; and staff at the YCGA, the Cancer Center, the High Performance Computing Center, the West Campus Analytical Chemistry Core, the Center for Cellular and Molecular Imaging, the Electron Microscopy Facility and the Keck Biotechnology Resource Laboratory for technical support. We thank X. Su and Y. Xiong (Yale University) for providing the B7H3 CAR constructs. S.C. is supported by a Cancer Research Institute Lloyd J. Old STAR Award and CLIP Award (CRI4964, CRI13945), the NIH/NCI (DP2CA238295, R01CA231112, R33CA281702 and R33CA281702), the DoD (W81XWH-20-1-0072, W81XWH-21-1-0514, HT9425-23-1-0472 and HT9425-23-1-0860), the Alliance for Cancer Gene Therapy (ACGT), the Pershing Square Sohn Cancer Research Alliance, the Sontag Foundation, Dexter Lu and Bill Sperry. P.A.R. is supported by a Yale PhD training grant from the NIH (T32GM007499), a Lo Fellowship of Excellence of Stem Cell Research and a YCC T32 fellowship program (T32CA193200). L.P. is supported by DoD (OC240337P1) and Yale Neurosurgery. L.Z. is supported by a Gruber Science Fellowship and a Lo Fellowship of Excellence of Stem Cell Research. K.T. is supported by a Gruber Science Fellowship. J.S. and S.D. are supported by a Yale MSTP training grant from the NIH (T32GM136651). C.Z. is supported by a Yale PhD training grant from the NIH (T32HD007149). S.-H.L. is supported by a Korean fellowship and a Leslie Warner fellowship. S.F. is supported by the American Heart Association.
Ethics declarations
Competing interests
A patent application has been filed by Yale University and Cellinfinity Bio related to the data in this study (US patent application no. 63/624,561; PCT WO2025158400A1). S.C. is a (co)founder of EvolveImmune Tx, Cellinfinity Bio, MagicTime Med and Chen Consulting. The other authors declare no competing interest.
Peer review
Peer review information
Nature thanks May Daher, Katayoun Rezvani, Rizwan Romee and the other, anonymous, reviewer(s) for their contribution to the peer review of this work. Peer reviewer reports are available.
Additional information
Publisher’s note Springer Nature remains neutral with regard to jurisdictional claims in published maps and institutional affiliations.
Extended data figures and tables
Extended Data Fig. 1 In vivo GOF CRISPRa screens identified boosters that enhance CAR-NK anti-tumor function.
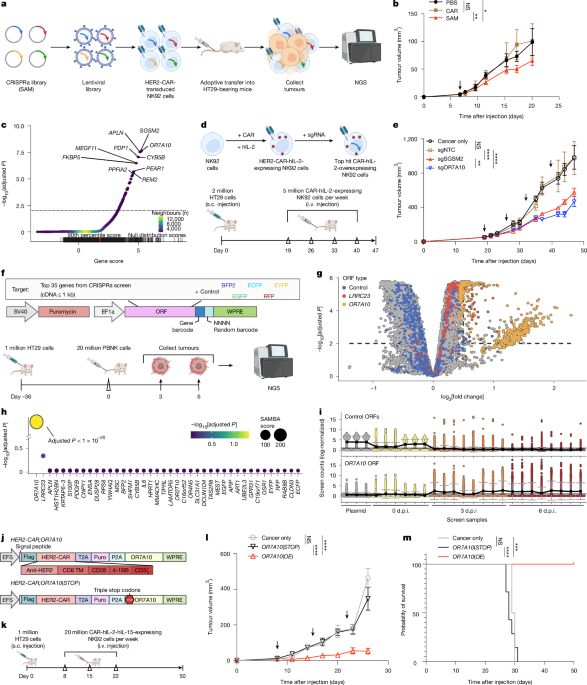
a, Schematics of the two in vivo GOF screens that identified functional boosters that enhance CAR-NK anti-tumor function. Top, Schematics of the primary screen (1st screen) – a CRISPRa screen using SAM sgRNA library with CAR-NK92 cells in HT29 tumor model. Bottom, Schematics of the secondary screen (2nd screen) – a barcoded UMI ORF mini-screen using top hits from the primary screen with human primary CAR-NK cells in HT29 tumor model. b, Heatmap of the correlation between CRISPRa screen samples. Sample correlation is presented as the Spearman rho values. c, Plot of the multidimensional scaling of data from CRISPRa screen samples. The samples were clustered by k-means, and a convex hull was drawn around the clustered samples. d, Schematic for a Screen Analysis Method with empirical Bayes estimates for Aggregated gene scoring (SAMBA). e, Summary information of the datasets and gene sets used to benchmark CRISPR screen analysis methods. f, Schematic describing the strategy for benchmarking CRISPR screen analysis methods against six other algorithms for enrichment and depletion analyses of datasets with simulated sparsity levels. g, Line plots showing the performance characteristics of different analysis methods, when guide detection is decreased among screen samples. Overall detection performance was measured by area-under-curve (AUC) values, specificity by the partial-AUC (pAUC) with a true-positive rate > 90%, and sensitivity by the pAUC with a false-positive rate <10%. Trendlines are the loess curves (opaque line) of AUC/pAUC values at each data sparsity level, shown with the standard error +/− the mean (shaded line) (see Methods for more details). The trendline of the area-under-curve (AUC) and partial-AUC (pAUC) values for 71 screens at different levels of data sparsity (see Methods for details). Each method is presented with a loess curve (opaque line), shown with the standard error +/− the mean (shaded line). The schematic in a was created using BioRender (https://biorender.com).
Extended Data Fig. 2 Additional in vitro assays of hit validation for lead selection, and barcoded ORF mini-screen analysis in primary human CAR-NK cells.
a, Box plots showing the performance characteristics of different analysis methods at different levels of data sparsity. Performance is presented with relative AUC (rAUC) values, representing the AUC log2 fold-change to the mean AUC for each screen. Each screen analysis result is shown by a dot, the mean +/− standard error is depicted by the boxes, and error bars are shown for the ANOVA analysis of rAUCs with post-hoc analysis using the Tukey method. Error bars are only shown for comparisons with SAMBA, and significance is based on FDR-adjusted p values. b, RT-qPCR for overexpression of SGSM2, OR7A10, APLN, PDP1, and CYB5B after lentiviral transduction (n = 4 for SGSM2, OR7A10, and PDP1; n = 3 for APLN and CYB5B). c, Delta CT values for SGSM2, OR7A10, APLN, PDP1, and CYB5B compared to GAPDH in NK92 cells and primary human PBNKs (n = 4 for SGSM2, OR7A10, and PDP1; n = 3 for APLN and CYB5B). d-h, Co-culture assays of SGSM2/OR7A10/APLN/PDP1/CYB5B-OE CAR-NK92 cells and Vector/NTC controls with indicated cancer cells, with indicated E: T ratios at indicated time points. Individual replicate data points were shown (n = 3). The statistical significance levels are compared to the NTC control groups. i, Summary of statistical results from co-culture assays for the top five CAR-NK hyperbooster candidates tested. Statistical significance was assessed using Two-way ANOVA (d–g) or two-sided unpaired t test (h). ns, not significant; *, p < 0.05; **, p < 0.01; ***, p < 0.001; ****, p < 0.0001. Exact p-values and detailed statistics are provided in the Source Data Excel file. j, Heat map of the between-sample correlation (Spearman rho) for the ORF mini-screen data. Sample IDs are presented with cell/plasmid type, donor ID, time of cell extraction from tumors, and replicate number. Cell extraction times are also shown in the plot margins. k, Plots of between-sample variation, based on the first two principal components of PCA. Each sample is presented as a dot, color-coded by plasmid/donor (left) and the time of NK cell extraction from tumors (right). l, Box-whisker plots of the ORF-UMI count distributions across screen samples. Boxes are drawn for the 25th, 50th, and 75th percentile, color-coded by sample type and tumor-extraction time. Counts were presented as the log2 counts-per-million reads (log-norm). m, Plots of screen performance via empirical cumulative distribution function lines, color-coded by sample type and tumor-extraction time. Sample distributions were compared using two-sample Wasserstein tests, and p values were adjusted for FDR. n, Volcano plots of the UMI-level results of the ORF mini-screen, highlighting ORF-UMIs for the control genes (blue dots) and the top two significant hits: LRRC23 and OR7A10 (red and yellow dots, respectively). The data were analyzed by SAMBA to compare 3-DPI vs 0-DPI and 6-DPI vs 0-DPI (left and right plots, respectively). Significant ORF-UMIs were those with an adjusted (adj.) p < 0.01 and an absolute log2-fold-change > 1. o, Bubble plot of the gene-level results of the ORF mini-screen with genes ordered by decreasing significance. The data were analyzed by SAMBA to compare 3-DPI vs 0-DPI and 6-DPI vs 0-DPI (left and right plots, respectively), and results for each gene were presented with adj. p value and screen-enrichment score by dot color and size, respectively. Note: in all bar blots, data are shown as mean ± SEM. The statistical significance levels are indicated in the plots by Two-way ANOVA with Sidak post-hoc analysis and FDR-correction to p values (d–g) or unpaired t test (b, h). Statistical tests are two-sided other than SAMBA gene-level results (o), which use one-sided directional tests. ns, not significant; *, p < 0.05; **, p < 0.01; ***, p < 0.001; ****, p < 0.0001. Exact p-values and detailed statistics are provided in the Source Data Excel file.
Extended Data Fig. 3 OR7A10 ORF engineering enhances multiple effector functions of human primary CAR-PBNK cells, validated with multiple independent donors.
a, Left, Flow cytometry of population in CAR-PBNK cells derived from Donor 0005 (same representative donor in Fig. 2). Right, RT-qPCR for overexpression of OR7A10 in CAR-PBNK cells from Donor 0005 (same representative donor in Fig. 2). b, Flow cytometry of population (left) and surface flag-CAR expression (right) in CAR-PBNK cells derived from Donor 7014. c, Co-culture assays of PBNK, CAR-PBNK;OR7A10(STOP) and CAR-PBNK;OR7A10 cells with HT29-GL, H1299-PL, K562-GL and MCF-PL cancer cells with indicated E: T ratios at 6 h (n = 3). d, Flow cytometry of population and surface flag-CAR expression in CAR-PBNK cells derived from Donor 1. e, RT-qPCR for overexpression of OR7A10 in CAR-PBNK cells (n = 3). f, Co-culture assays of CAR-PBNK;OR7A10(STOP) and CAR-PBNK;OR7A10 cells with K562-GL and HT29-GL cells with indicated E: T ratios at different time points (n = 3). g, Flow cytometry of population and surface flag-CAR expression in CAR-PBNK cells derived from Donor 2. h, RT-qPCR for overexpression of OR7A10 in CAR-PBNK cells (n = 3). i, Co-culture assays of CAR-PBNK;OR7A10(STOP) and CAR-PBNK;OR7A10 cells with K562-GL and HT29-GL cells with indicated E: T ratios at different time points (n = 3). j, Flow cytometry of population and surface flag-CAR expression in CAR-PBNK cells derived from Donor 3. k, Co-culture assays of CAR-PBNK;OR7A10(STOP) and CAR-PBNK;OR7A10 cells with K562-GL and HT29-GL cells with indicated E: T ratios at different time points (n = 3). l, Flow cytometry of population and surface flag-CAR expression in CAR-PBNK cells derived from Donor 4. m, Co-culture assays of CAR-PBNK;OR7A10(STOP) and CAR-PBNK;OR7A10 cells with K562-GL and HT29-GL cells with indicated E: T ratios at different time points (n = 3). n, Flow cytometry of cell trace dye dilution and cell count of PBNK, CAR-PBNK;OR7A10(STOP) and CAR-PBNK;OR7A10 cells after 3 days of culture, starting from 1 million cells per group. o, Flow cytometry of chemokine receptor CXCR2 surface expression of PBNK, CAR-PBNK;OR7A10(STOP) and CAR-PBNK;OR7A10 cells upon HT29 stimulation at E: T = 1: 1 for 24 h. p–r, Flow cytometry of activation marker CD69 and CD25 and costimulatory receptor 4-1BB surface expression of PBNK, CAR-PBNK;OR7A10(STOP) and CAR-PBNK;OR7A10 cells upon HT29 stimulation at E: T = 1: 1 for 6 h. Data represent technical quadruplicates from one representative donor out of 2 different human donors. s, Schematic representation of repeated challenge and cytolysis after the third round of stimulation. The E: T ratio was maintained at 1: 1 across three rounds of stimulation. Data represent technical triplicates from one representative donor out of 3 different human donors. t–v, Flow cytometry of exhaustion markers Tim-3, Lag-3, NKG2A, and PD-1 expression in PBNK, CAR-PBNK;OR7A10(STOP) and CAR-PBNK;OR7A10 cells at 24 h following the third round of stimulation with HT29 cells. Data represent technical triplicates from one representative donor out of 3 different human donors. Note: in all bar blots, data are shown as mean ± SEM. The statistical significance levels are indicated in the plots by Two-way ANOVA with Sidak post-hoc analysis and FDR-correction to p values (c, f, i, k, and m) or unpaired t test (a, e, h, n, o, p, q, r, s, t, u, and v). Statistical tests are two-sided unless otherwise noted. ns, not significant; *, p < 0.05; **, p < 0.01; ***, p < 0.001; ****, p < 0.0001. Exact p-values and detailed statistics are provided in the Source Data Excel file. The schematic in s was created using BioRender (https://biorender.com).
Extended Data Fig. 4 OR7A10 ORF engineering enhances effector functions of human primary CAR-CBNK cells and exploration of GPCR signaling components in relation to OR7A10-driven effects in human primary CAR-NK cells.
a, Schematic representation of production process for human Cord blood-derived CAR-NK;OR7A10 cells and experimental design for repeated challenge. E: T ratio was maintained at 1: 1 across 3 rounds of stimulation, with each round lasting 48 h. b, Flow cytometry of NK purity and CAR expression of CBNK, CAR-CBNK;OR7A10(STOP) and CAR-CBNK;OR7A10 cells. c, Cytolysis of CBNK, CAR-CBNK;OR7A10(STOP) and CAR-CBNK;OR7A10 cells with HT29-GL cells at 24 h post each round stimulation with HT29 cells (n = 3). d, Schematic illustration of the “all-in-one” constructs α-HER2-CAR;hIL-15;OR7A10 and α-HER2-CAR;hIL-15;OR7A10(STOP). e, Flow cytometry analysis of CAR expression and hIL-15 production in untransduced NK cells, CAR-NK;hIL15;OR7A10(STOP), and CAR-NK;hIL15;OR7A10 cells. Cells were collected on day 3 and 10 after lentivirus transduction. f, ELISA analysis of human IL-15 levels in the supernatant of untransduced NK cells, CAR-NK;hIL15;OR7A10(STOP), and CAR-NK;hIL15;OR7A10 cells. A total of 0.05 M cells were cultured per well in a 96-well plate, and supernatants were collected after 3 days. g, Flow cytometry analysis of NK cell purity and CAR expression in CAR-CBNK;hIL15;OR7A10(STOP) and CAR-CBNK;hIL15;OR7A10 cells. h, Cytotoxicity of CAR-CBNK;hIL15;OR7A10(STOP) and CAR-CBNK;hIL15;OR7A10 cells against HT29-GL target cells 24 h after each round stimulation (n = 3). i, T7E1 assay on AAVS1/GNAS KO human primary NK cells. j-k, Effects of knockout of GNAS on cAMP level (b, n = 3) and PKA activity (c, n = 5) of CAR-NK;OR7A10 or Stop control cells. l, Effects of knockout of GNAS on the cytotoxicity of OR7A10 or OR7A10(STOP)-OE HER2-CAR-NK cells against HT29-GL cells with E: T = 1: 2 (n = 4). m, Effects of knockout of GNAS on ERK1/2 phosphorylation (pT202/pY204) of CAR-NK;OR7A10(STOP) or CAR-NK;OR7A10 cells upon HT29 stimulation with E: T = 1: 1 at 5 min (n = 4). n, Effects of knockout of GNAS on NF-kB activity of CAR-NK;OR7A10(STOP) and CAR-NK;OR7A10 cells upon HT29 stimulation with E: T = 1: 1 at 6 h (n = 3). o, Effects of p-ERK inhibitor Ulixertinib (5 (mu )M) on cytotoxicity of CAR-NK;OR7A10(STOP) and CAR-NK;OR7A10 cells upon HT29 stimulation with E: T = 1: 2 (n = 4). p, Effects of NF-kB inhibitor BOT-64 (100 (mu )M) on cytotoxicity of CAR-NK;OR7A10(STOP) and CAR-NK;OR7A10 cells upon HT29 stimulation with E: T = 1: 2 (n = 4). q, Effects of NF-kB inhibitor BOY 11-7082 (5 (mu )M) on cytotoxicity of CAR-NK;OR7A10(STOP) and CAR-NK;OR7A10 cells upon HT29 stimulation with E: T = 1: 5 (n = 3). r, Effects of PKA inhibitor H89 (30 (mu )M) on cytotoxicity of CAR-NK;OR7A10(STOP) and CAR-NK;OR7A10 cells upon HT29 stimulation with E: T = 1: 2 (n = 4). s, Effects of NFAT inhibitor INCA-6 (25 (mu )M) on cytotoxicity of CAR-NK;OR7A10(STOP) and CAR-NK;OR7A10 cells upon HT29 stimulation with E: T = 1: 2 (n = 4). t, Effects of Gβγ inhibitor Gallein (10 (mu )M) on cytotoxicity of CAR-NK;OR7A10(STOP) and CAR-NK;OR7A10 cells upon HT29 stimulation with E: T = 1: 5 (n = 3). Note: data are shown as mean ± SEM. The statistical significance levels are indicated in the plots by unpaired t test (c, f, h, j, k, m, and n) or Two-way ANOVA with Sidak post-hoc analysis and FDR-correction to p values (l, o-t). Statistical tests are two-sided unless otherwise noted. ns, not significant; *, p < 0.05; **, p < 0.01; ***, p < 0.001; ****, p < 0.0001. Exact p-values and detailed statistics are provided in the Source Data Excel file. The schematic in a was created using BioRender (https://biorender.com).
Extended Data Fig. 5 Bulk mRNA-Seq revealed OR7A10-driven gene expression changes and interaction between OR7A10 and CAR signaling.
a, Principal Component Analysis (PCA) plot for RNA-Seq samples, label by stimulation condition (left: Stimulation for 24hrs vs Unstimulated), overexpression construct (middle: OR7A10 vs OR7A10Stop), or CAR construct (right: truncated CAR (tHER2CAR), complete CAR, No CAR). b, Volcano plot showing the differential expressed genes caused by stimulation main effect. Upregulated genes were labeled with red, downregulated genes were labeled with blue, and not significant differential expressed genes were label with grey. |Log2FoldChange| > 0.5 and adjusted p-value < 0.05 were used as threshold for significant expressed genes. c, Bubble plot showing Gene Set Enrichment Analysis (GSEA) result (GO-BP pathways) of the differentially expressed genes caused by stimulation main effect. Color scale represents the adjusted p-value. Size of the bubble represent the number of differentially expressed gene in the pathway. d, PCA plot for stimulated samples only. label overexpression construct (top: OR7A10 vs OR7A10Stop) or CAR construct (bottom: truncated CAR, complete CAR, No CAR). e, Volcano plot showing the differential expressed genes of OR7A10 vs OR7A10Stop overexpression main effect. Upregulated genes were labeled with red, downregulated genes were labeled with blue, and not significant differential expressed genes were label with grey. |Log2FoldChange| > 0.5 and adjusted p-value < 0.05 were used as threshold for significant expressed genes. f, Volcano plot showing the differential expressed genes of interaction between OR7A10 and HER2CAR. Upregulated genes were labeled with red, downregulated genes were labeled with blue, and not significant differential expressed genes were label with grey. |Log2FoldChange| > 0.5 and adjusted p-value < 0.05 were used as threshold for significant expressed genes. g, Interaction plot showing the change in normalized expression of OR7A10 between OR7A10 and OR7A10Stop overexpression is different for groups: No CAR, truncated HER2 CAR (tHER2CAR), and complete HER2 CAR. h, Bubble plot showing the pathway analysis (GO-BP) result of the differentially expressed genes caused by OR7A10 vs OR7A10Stop overexpression main effect. Color scale represent the adjusted p-value. Size of the bubble represent the number of differentially expressed gene in the pathway. i, GSEA plot showing the differentially expressed genes of OR7A10 vs OR7A10Stop overexpression main effect in pathway “leukocytes activation”. j, GSEA plot showing the differentially expressed genes of OR7A10 vs OR7A10Stop overexpression main effect in pathway “positive regulation of leukocyte proliferation”. DE analyses were performed by DESeq2 Wald tests. Statistical tests are two-sided unless other than GSEA results (c and g), which use one-sided directional tests.
Extended Data Fig. 6 OR7A10-OE enhances cytotoxicity of 2nd generation CAR constructs and synergizes NKp46 signaling.
a, Schematic illustration of the “all-in-one” constructs B7H3-CAR;hIL-15;OR7A10 and B7H3-CAR;hIL-15;OR7A10(STOP). b, Flow cytometry analysis of B7H3-CAR expression in untransduced NK cells, B7H3-CAR-NK;hIL15;OR7A10(STOP), and B7H3-CAR-NK;hIL15;OR7A10 cells. c, Cytotoxicity of untransduced NK cells, B7H3-CAR-NK;hIL15;OR7A10(STOP) and B7H3-CAR-NK;hIL15;OR7A10 cells against U87-GL target cells 24 h after each round stimulation (n = 3). Statistical significance was assessed using two-sided unpaired t test. d, Schematic illustration of the “all-in-one” constructs CD22-CAR;hIL-15;OR7A10 and CD22-CAR;hIL-15;OR7A10(STOP). e, Flow cytometry analysis of CD22-CAR expression in untransduced NK cells, CD22-CAR-NK;hIL15;OR7A10(STOP), and CD22-CAR-NK;hIL15;OR7A10 cells. f, Cytotoxicity of untransduced NK cells, CD22-CAR-NK;hIL15;OR7A10(STOP), and CD22-CAR-CBNK;hIL15;OR7A10 cells against NALM6-GL target cells at 24 and 48 h post stimulation (n = 3). Statistical significance was assessed using two-sided unpaired t test. g, Flow cytometry analysis confirming overexpression of activating receptors NKp46, CD16, NKG2D, 2B4, and mScarlet control, 24 h after mRNA electroporation. h-i, NK Cytotoxicity assessed by RTCA killing assays against HT29 targets at an E: T ratio of 1: 1, using NK cells overexpressing mScarlet, NKp46, CD16, NKG2D, or 2B4 to assess synergistic effects with OR7A10. Note: in all bar blots, data are shown as mean ± SEM. The statistical significance levels are indicated in the plots by univariate three-way ANOVA tests with Sidak post-hoc analysis and FDR-correction to p values (i) or two-sided unpaired t test (c and f). Statistical tests are two-sided, where appropriate. ns, not significant; *, p < 0.05; **, p < 0.01; ***, p < 0.001; ****, p < 0.0001. Exact p-values and detailed statistics are provided in the Source Data Excel file.
Extended Data Fig. 7 Safety, effect, and immune profile of OR7A10-OE on human primary CAR-NK cells.
a, Elisa assay of IFNg and IL-6 level in mouse serum received different treatment in Fig. 5b,c. b, Histology sections stained by hematoxylin and eosin of tumors derived from Fig. 5b,c. High magnification image scale bar: 300 μm. c, Weight of mice which received CAR-PBNK;hIL15;OR7A10 cells in Fig. 5d–f. d, Bar plot showing the distribution of indel variants identified by whole genome sequencing (WGS) on different chromosomes. e, RCircos plot showing the distribution of indel and structural variants across the whole genome for OR7A10 overexpression (OR7A10 OE, left) sample and OR7A10 stop (OR7A10 Stop, right) control. No chromosome translocation was detected. f, proliferation of CAR-PBNK;hIL15;OR7A10 cells or CAR-PBNK;hIL15;OR7A10(STOP) cells under hIL2-withdrawal condition. g, Schematic of the production process for CAR-NK;OR7A10(STOP), CAR-NK;OR7A10, CAR-T;OR7A10(STOP), and CAR-T;OR7A10 cells derived from the same healthy PBMC donor. h, Flow cytometry of population and CAR surface expression in CAR-T and CAR-NK cells. i, Cytolysis of CAR-NK;OR7A10(STOP), CAR-NK;OR7A10, CAR-T;OR7A10(STOP), and CAR-T;OR7A10 cells (n = 3) derived from two healthy PBMC donors against HT29 colon cancer cells. Statistical significance was assessed using two-sided unpaired t test. j–l, Schematic (j), bioluminescence imaging (k), and tumor burden quantification (l), and SKOV3 tumor-bearing mice following different treatments: no treatment (n = 3 mice), adoptive cell transfer of CAR-NK;OR7A10(STOP) (n = 4 mice), CAR-NK;OR7A10 (n = 4 mice), CAR-T;OR7A10(STOP) (n = 4 mice) or CAR-T;OR7A10 (n = 4 mice). m, Brightfield photos of mice as in (d-f) at day 51 post treatment. Areas with symptoms of GvHD were shown in black boxes. n, Flow cytometry (left) and quantification (middle) of CD45 + CD56 + NK cells in the Tumor samples at Day 6 after NK transfer and tumor weights (right) at Day 6 after NK transfer. Statistical significance was assessed using two-sided unpaired t test. o, Flow cytometry (left) and quantification (middle) of CD45 + CD56 + NK cells in the Spleen samples at Day 6 after NK transfer and spleen weights (right) at Day 6 after NK transfer. Statistical significance was assessed using two-sided unpaired t test. p, Flow cytometry (left) and quantification (right) of CD45 + CD56 + NK cells in the Blood samples at Day 6 after NK transfer. Statistical significance was assessed using two-sided unpaired t test. q–s, Flow cytometry of CD45 + CD56 + NK cells in the Spleen, Blood, and Tumor samples at Day 14 after NK transfer. Note: data are shown as mean ± SEM. The statistical significance levels are indicated in the plots by Two-way ANOVA with Sidak post-hoc analysis (f), mixed-effects model with Tukey’s post-hoc analysis (l) or unpaired t test (i and n-p). Statistical tests are two-sided, and FDR-corrected p values are depicted in f-l, where appropriate. ns, not significant; *, p < 0.05; **, p < 0.01; ***, p < 0.001; ****, p < 0.0001. Exact p-values and detailed statistics are provided in the Source Data Excel file. The schematics in g and j were created using BioRender (https://biorender.com).
Extended Data Fig. 8 Single-cell transcriptomic analysis of tumor-infiltrating human primary CAR-NK cell subsets.
a, UMAP embedding with heatmap depiction of gene expression markers used to distinguish immature NK (CD56-hi CD16-lo) and mature NK (CD56-lo CD16-hi) cells. b, Heatmap dot plots of gene expression and signature markers used to distinguish NK subsets across single-cell transcriptomic (SCT) cell clusters. Dot color and size were used to represent the mean gene/signature expression, and the % of clustered cells with detected expression. Labels are italicized and capitalized for gene names, while signatures were presented with normal fonts. c, Heatmap dot plots of the expression of NK function genes. d, UMAP presented with RNA splicing kinetics analysis results (scVelo) estimating population-level trajectories in differentiation. Velocity pseudotime and latent time estimates predicted trajectories of transcriptional profile changes and putative cellular ages, respectively. e, UMAP depiction of cell cycle predictions (Seurat method), based on the expression of characteristic marker genes. f, Volcano plots of the differential expression (DE) analyses between OR7A10-OE vs OR7A10-(stop) NK subsets. Significant DE genes were those with an adj. p < 0.01 and a log2 foldchange > 1.5 (upregulation = red dot) or < −1.5 (downregulation = blue dot). g, Upset plot of DE genes that were common between different NK subset. The upregulated and downregulated DE gene comparisons are displayed separately in the top and bottom panels, respectively. Genes were labeled when significant in at least four subsets. h, Volcano plots of the differential expression (DE) pathway analyses between OR7A10-OE vs OR7A10-(stop) NK subsets. Pathway signatures were assessed at a single-cell level by AUCell method, and signatures were compared by Wilcox test (Seurat method). Significant DE pathways were those with an adj. p < 0.01 and a log2 foldchange > 0.2 (upregulation = red dot) or < −0.2 (downregulation = blue dot). i, Network plots of the top two DE pathways that were identified in each NK subset. Plots are shown with square nodes color-coded for the NK subsets, and pathways are depicted by green circle nodes, sized by number subsets for which each pathway was found significant. The width of the network edges (lines) represents the log2 fold change from the DE analysis. The upregulated and downregulated DE gene comparisons are displayed separately in the left and right panels, respectively. DE analyses (f and h) were performed by pseudo-replicate Wilcox tests, and all statistical tests are two-sided.
Extended Data Fig. 9 Gene expression patterns for select significant pathways affected by OR7A10-OE in tumor-infiltrating human primary CAR-NK cells across different subsets.
a, Heatmap dot plots of gene expression for six significant pathways across immature and mature NK (iNK and mNK, respectively) subsets. The genes presented were filtered to include those that were expressed in at least 20% of cells. Dot color and size were used to represent the mean gene expression, and the % of clustered cells with detected expression. b, Principal components analysis (PCA) plots of comparing NK cell subsets, separated by genotype, based on the expression of genes related to six significant pathways. The genotype of each NK cell subset was presented by color-coded dots. c, Scatter plots of the correlations between top DE pathways and DE genes. For each plot, normalized gene expression was compared to pathway signatures. d, Scatter plots of the top predicted cause-effect relationships between DE pathways and DE genes. Gene expression values were adjusted to be independent of cell subset effects. For c and d, trends were shown by blue regression lines (simple generalized additive model); and Pearson correlation analysis results (rho values and two-sided p values) are shown for correlations between pathways and genes.
Extended Data Fig. 10 Flow gating strategy of anti-tumor functions of CAR-NK cells and graphical summary.
a, Gating strategy of Flow cytometry of NK population and CAR expression in Fig. 2b and Extended Data Fig. 7. b, Gating strategy of Flow cytometry of degranulation in Fig. 2e. c, Gating strategy of Flow cytometry of production of effector cytokines in Fig. 2f and Fig. 2h,i. d, Gating strategy of Flow cytometry of surface FasL and TRAIL in Fig. 2g. e-g, Gating strategy of Flow cytometry of NK presentation in the Spleen, Blood, and Tumor samples in Fig. 5l–n and Extended Data Fig. 7. h, Graphical summary of OR7A10 engineering boosts CAR-NK anti-tumor functions. The schematic in h was created using BioRender (https://biorender.com).
Supplementary information
Source data
Rights and permissions
Springer Nature or its licensor (e.g. a society or other partner) holds exclusive rights to this article under a publishing agreement with the author(s) or other rightsholder(s); author self-archiving of the accepted manuscript version of this article is solely governed by the terms of such publishing agreement and applicable law.
About this article

Cite this article
Yang, L., Renauer, P.A., Tang, K. et al. OR7A10 GPCR engineering boosts CAR-NK therapy against solid tumours. Nature (2026). https://doi.org/10.1038/s41586-026-10149-8
-
Received:
-
Accepted:
-
Published:
-
Version of record:
-
DOI: https://doi.org/10.1038/s41586-026-10149-8