
Introduction
Reverse transcription-polymerase chain reaction (RT-PCR)-based nucleic acid test is the current “gold standard” for diagnosing RNA virus infection. RT-PCR involves the amplification of pre-selected target viral RNA sequences in a biospecimen (e.g., nasopharyngeal swab, saliva, nasal swab), making this test highly sensitive and specific. However, due to the time-consuming amplification process and the need for expensive and bulky equipment, RT-PCR is largely limited to clinical laboratory environments, limiting its utility in screening large populations at the point-of-need1,2,3,4. Further, in the absence of appropriate reference samples, RT-PCR is limited to qualitative results rather than quantitative viral RNA concentration. Numerous methods5,6, such as CRISPR-based diagnostics7,8, reverse transcription-loop-mediated isothermal amplification (RT-LAMP)9, nanoparticle aggregation-based colorimetric assays10, electrochemical biosensors11,12, and lateral flow assays using fluorescent probes13 have been developed to detect viral RNA. These methods provide potential advantages over RT-PCR in terms of cost, portability, and point-of-care use. However, most still lack the sensitivity and specificity achieved by RT-PCR or the quantitative detection ability, which is critical to determining the viral load and possibly the stage of illness and risk of infectivity14. Therefore, there remains a need for an ultrasensitive, rapid, and easy-to-use viral RNA detection platform that can quantitatively assess viral load without target amplification.
Monoclonal antibody, S9.6, has high affinity and selectivity to DNA-RNA heteroduplexes with minimal binding to single-stranded DNA (ssDNA), double-stranded DNA (dsDNA), or ribosomal RNA15,16. The S9.6 antibody has no sequence specificity15,16, and the feature has been widely used in R-loop immunoprecipitation17,18, and DNA-RNA heteroduplex detection13,19,20. S9.6 was also harnessed in single ssRNA molecular imaging using conventional molecular fluorophores21, co-detection of ssRNA and protein biomarker22, and photoelectrochemical RNA biosensor23. However, the weak signal associated with the conventional fluorophores and transducers compared to the background noise severely limits the sensitivity of these assays. Overcoming this challenge is critical to fully harness S9.6 in realizing an ultrasensitive immunoassay for highly sensitive and quantitative detection of target RNA.
In this work, we introduce a plasmonically-enhanced DNA-RNA hybrid-based fluoroimmunoassay for ultrasensitive and quantitative detection of viral RNA. To demonstrate the proof-of-concept, we have employed severe acute respiratory syndrome coronavirus 2 (SARS-CoV-2), which causes coronavirus disease 2019 (COVID-19), as a model target. COVID-19 has resulted in a global pandemic with devastating social and economic impacts worldwide. To overcome the limited sensitivity of conventional assays relying on molecular fluorophores and enzymatic labels, we employ plasmonic-fluor as an ultrabright and highly specific fluorescent nanolabel, which exhibits more than three orders of magnitude brighter fluorescence signal compared to the corresponding molecular fluorophores24. Plasmonic-fluor improved the limit of detection (LOD) and lower limit of quantification (LLOQ) of SARS-CoV-2 RNA by up to three magnitude orders compared to enzyme-linked immunosorbent assay (ELISA). The plasmonically-enhanced RNA assay enabled amplification-free detection and quantification of SARS-CoV-2 RNA in nasopharyngeal swabs and saliva samples from COVID-19 patients.
Results and Discussion
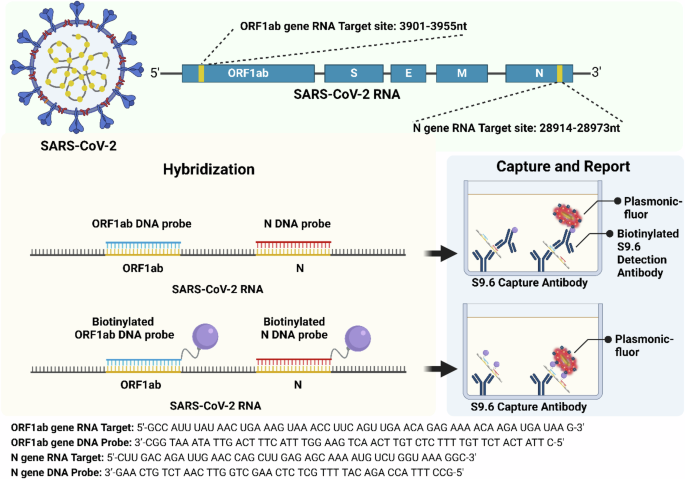
Conventional sandwich immunoassays involve the capture of the target analyte by the antibody immobilized on a surface (e.g., plate, microbead), followed by the detection of the captured analytes using detection antibodies labeled with reporters (e.g., horseradish peroxidase, fluorophores). For the detection and quantification of the target RNA, we have employed a similar strategy (Fig. 1). The S9.6 antibody immobilized at the bottom of the microtiter plate serves as a capture antibody, and the heteroduplex comprised of target RNA and complementary DNA probe serves as the “antigen”. We have explored two different detection elements: biotinylated S9.6 antibody and biotinylated DNA probes. We harness these two different detection elements to investigate three different assay methods. In Method I, biotinylated S9.6 antibodies serve as detection elements that bind to the captured RNA/DNA hybrid. In Method II, the complementary DNA probe is biotinylated, which itself serves as the detection element (Fig. 1). In both cases, plasmonic-fluor with streptavidin on the surface binds to the biotin on the detection element. In Method III, we combine these two detection methods i.e., utilizing both biotinylated DNA probe and biotinylated S9.6 antibodies as detection elements.

Method I: RNA/DNA hybrids are captured by S9.6 antibodies. Subsequently, biotinylated S9.6 antibody serves as a detection element that binds to the captured RNA/DNA hybrid. Method II: RNA/DNA hybrid is captured by S9.6 antibodies. The complementary DNA probe, which is biotinylated, serves as the detection element.
To evaluate the feasibility of plasmonic-fluor as an ultrabright fluorescence label in this assay, we set out to determine and compare the brightness of plasmonic-fluor with conventional fluorophores. Plasmonic-fluor-650 (PF650) is comprised of Au@Ag nanorods as a plasmonic nanoantenna, which are conjugated with Cy5, and coated with bovine serum albumin (BSA) and streptavidin (5% surface coverage) (Fig. 2A). Biotinylated BSA-coated microtiter wells were exposed to plasmonic-fluor and streptavidin-Cy5. The fluorescence intensity corresponding to plasmonic-fluor was found to be nearly 1100-fold higher compared to that of the streptavidin-Cy5 (Fig. 2B).

A Vis–NIR extinction spectra of plasmonic-fluor showing a longitudinal plasmonic extinction band at 650 nm (inset shows the TEM image of plasmonic-fluor-650). B Fluorescence intensity of conventional fluor and plasmonic-fluor bound to biotinylated BSA immobilized at the bottom of a microtiter well, showing nearly 1100-fold brighter fluorescence intensity of plasmonic-fluor compared to conventional fluor. Error bars, s.d. (n = 2 independent tests). Data statistically significant **P < 0.01 by two-tailed unpaired t-test. C Histogram and D fluorescence intensity map corresponding to hybridized RNA-DNA, hybridized RNA-DNA-biotin, hybridized RNA-DNA-biotin-Det-biotin, single-strand RNA, single-strand DNA-biotin, single-strand DNA, non-specific RNA solution extracted from 3T3 cell line, non-specific RNA solution extracted from 3T3 cell line incubated with DNA-biotin (10 fg/ml), non-specific RNA solution extracted from 3T3 cell line incubated with DNA probe (10 fg/ml), and Blank (reaction buffer). Error bars, s.d. (n = 2 independent experiments). Data statistically significant. ****P < 0.0001, ***P < 0.001 by One way-ANOVA.
To specifically capture and detect SARS-CoV-2 RNA, we selected two target gene sequences (N gene and ORF1ab) from the SARS-CoV-2 genome and designed DNA probes complementary to the target RNA sequences (Fig. 1, Supplementary Table 1). Under thermal cycling, DNA probes specifically bind to the target RNA, forming a DNA-RNA hybrid, which in turn binds to the S9.6 antibody-coated plate. In addition to assaying for individual N and ORF1ab genes, we have explored the possibility of mixing the DNA probes corresponding to both genes to form a higher number of RNA-DNA hybrids, thus improving the sensitivity of the assay.
To evaluate the specificity of plasmonically-enhanced DNA-RNA hybrid-based immunoassay, single strand N gene RNA (10 fg/ml) (sequence shown in Fig. 1), N gene complementary single-strand DNA (10 fg/ml), N gene complementary single-strand DNA-biotin (10 fg/ml), RNA solution extracted from 3T3 cell line (10 fg/ml) (called non-specific RNA henceforth), non-specific RNA incubated with biotinylated DNA probe specific to SARS-CoV-2 N gene RNA (10 fg/ml) and non-specific RNA incubated with DNA probe specific to SARS-CoV-2 N gene RNA (10 fg/ml) were set as the control groups. All these nucleic acid solutions were added to S9.6 pre-coated microtiter wells and then incubated with biotinylated S9.6 detection antibody and plasmonic-fluor, sequentially. Fluorescence intensity corresponding to various negative control groups without DNA-RNA hybrids is not significantly different (p > 0.05, One Way ANOVA) from that of the blank (Taq buffer) (Fig. 2C, D). To investigate the binding of the DNA-RNA hybrids to the immobilized S9.6 antibodies, ORF1ab RNA was hybridized with a complementary DNA probe by subjecting it to a thermal cycle (56 °C for 20 min, then 4 °C for 5 min). The successful hybridization of RNA and DNA was validated by RNA electrophoresis and paper-based dot assay (Supplementary Fig. 1). The RNA-DNA hybrid (Method I) and RNA-biotinylated DNA hybrid (Methods II and III) solutions were added to the S9.6 antibody-coated plate. In the case of Methods I and III, following the capture of the RNA-DNA hybrids, biotinylated S9.6 antibody was added to the microtiter wells and incubated for one hour, followed by exposure to plasmonic-fluor for 20 min. In the case of Method II, the plate was directly exposed to plasmonic-fluor for 20 min. All three assay methods with RNA-DNA hybrids exhibited significantly higher fluorescence signal compared to control samples (described above). The difference in fluorescence signal between the three assay methods for the same concentration of RNA (10 fg/ml) was not statistically significant (Fig. 2C & D).
To determine the bioanalytical parameters of the plasmon-enhanced RNA-DNA hybrid assay, serially-diluted target RNA (standard) solutions were mixed with DNA or biotinylated DNA probes and then subjected to thermal cycling to form RNA-DNA hybrids or RNA-biotinlyated DNA hybrids. After the downstream plasmon-enhanced assay (in Methods I, II, and III described above), we noted an RNA dose-dependent increase in fluorescence intensity. The fluorescence intensity vs. concentration of the RNA was fit using a 4-parameter logistic curve (Fig. 3). The data are presented on a log-log scale due to the large dynamic range of the assay. Linear scale plots are shown in Supplementary Fig. 2 to illustrate the linearity and sensitivity of the assays in narrow concentration ranges. Conventionally, the limit of detection (LOD) is calculated as follows:
$${{LOD}}_{{Signal}}={{Mean}}_{{Blank}}+{3sigma }_{{Blank}}$$
(1)
where σ represents the standard deviation. Equation1 represents the signal LOD, which is subsequently converted into concentration using the best-fit equation of the standard curve. An alternate method defines LOD as:
$$LO{D}_{Concentration}{=}{{{{3}{sigma }}_{{B}{l}{a}{n}{k}}}!!!atop}left/!_{{S}{l}{o}{p}{e}}right.$$
(2)
where the Slope represents the slope of the linear calibration curve. As a sigmoidal curve fit was applied to analyze the standard curve, local linearization was used to determine the slope. As shown in Supplementary Table 2, depending on the number of data points used, the slope of the local linear fits exhibited significant variation, resulting in a large variation in LODConcentration. As such, we employed Eq.1 to determine the LOD in this study.

A Plots showing N gene dose-dependent standard curve of RNA/DNA-biotin ELISA. The LOD and LLOQ were found to be 1.73 fM and 10.8 fM, respectively; B Plots showing N gene dose-dependent standard curve of Method I (RNA/DNA-Detection antibody-biotin-PFLISA). The LOD and LLOQ were found to be 7 aM and 53 aM, respectively. C Plots showing N gene dose-dependent standard curve of Method II (RNA/DNA-biotin-PFLISA assay). The LOD and LLOQ were found to be 37.4 aM and 139 aM, respectively; D Plots showing N gene dose-dependent standard curve of Method III (RNA/DNA-biotin-Detection antibody-biotin-PFLISA). The LOD and LLOQ were found to be 5.34 aM and 40.5 aM, respectively. For all assays, n = 2 technical replicates, and data is presented as mean ± sd. Data points corresponding to blanks are included as the lowest concentration in the plots.
To decide the lowest concentration that can be reliably quantified, the lower limit of quantification (LLOQ) is calculated as follows:
$${LLOQ}={{Mean}}_{{Blank}}+10{sigma }_{{Blank}}$$
(3)
Similar to the conversion of the signal LOD, LLOQ in Eq.3 will also be converted into a concentration value. An alternative approach to defining the LLOQ is to select the lowest standard curve point for which the percentage bias is within ±25% and the coefficient of variation (CV) is less than 20%. However, this method could yield an LLOQ that is lower than the LOD, which is conceptually inconsistent (Supplementary Table 3). Consequently, we employed Eq. 3 to determine the LLOQ in this study.
For comparison, we have performed ELISA in Method I, which exhibited a LOD of 0.69 fM (ORF1ab), 12.85 fM (N gene), and 6.8 fM (mixture of N and ORF1ab) (Fig. 3A and Supplementary Fig. 3A–D). The average LOD of N gene p-FLISA in Method I (Fig. 3B, Supplementary Figs. 3 & 4), Method II (Fig. 3C, Supplementary Figs. 3 & 4), and Method III (Fig. 3D, Supplementary Figs. 3 & 4) is 21.5 aM, 24.6 aM, and 14.3 aM, respectively. ELISA exhibited an LLOQ of 10.8 fM, while p-FLISA across three methods exhibited an LLOQ of 53 aM (Method I), 139 aM (Method II), and 40.5 aM (Method III) (Fig. 3A–D). Compared with ELISA, the LOD of p-FLISA exhibited nearly 230 to 1000-fold improvement while the LLOQ of p-FLISA exhibited nearly 77 to 270-fold improvement in all three methods. The LOD and LLOQ of p-FLISA in three methods were comparable with no statistically significant difference (Supplementary Fig. 4). However, the assay time of Method II (100 minutes) was significantly shorter compared to the other two methods (160 minutes) (Supplementary Tables 4 and 5). Owing to its short assay time and comparable analytical sensitivity, we have employed as Method II for analyzing the clinical samples and determining the clinical sensitivity and specificity.
To further improve the sensitivity of the plasmonically-enhanced DNA-RNA hybrid-based immunoassay, we explored digital p-FLISA as opposed to the analog assay described above (Fig. 4D, Supplementary Fig. 4)25. As opposed to an analog assay, which relies on the average fluorescence intensity of the microtiter wells, a digital immunoassay involves counting individual plasmonic-fluors at the bottom of microtiter wells. We performed p-FLISA on a standard glass-bottom plate, followed by analyzing average fluorescence intensity using a fluorescence scanner (i.e., standard analog assay). Subsequently, we imaged the same plate using an epifluorescence microscope. These images were analyzed using a custom-designed image processing algorithm to count the number of plasmonic-fluors and derive dose-response curves (Fig. 4A–C, see Methods section for details). The LOD of the digital p-FLISA was 1.2 aM (ORF1ab), 0.8 aM (N gene), and 0.3 aM (mixture of N and ORF1ab), while the LOD of the analog p-FLISA was 16 aM (ORF1ab), 23.4 aM (N gene), and 2.9 aM (mixture of N and ORF1ab) (Fig. 4A–C). The LOD of digital p-FLISA is 10 to 30-fold better than the analog p-FLISA. The LLOQ of the digital p-FLISA was 8.7 aM (ORF1ab), 7.5 aM (N gene), and 2.9 aM (mixture of N and ORF1ab), while the LLOQ of the analog p-FLISA was 74.6 aM (ORF1ab), 59 aM (N gene) and 18.4 aM (mixture of N and ORF1ab). The LLOQ of digital p-FLISA is 6 to 9-fold better than analog p-FLISA. Considering that the analog p-FLISA exhibited at least 230-fold better LOD and 77-fold better LLOQ compared to colorimetric ELISA, the digital assay represents at least ~2300-fold improvement of LOD and ~460-fold improvement of LLOQ over ELISA.

Plots showing dose-dependent response, LOD and LLOQ analyzed in the digital (red) and analog (black) formats for SARS-CoV-2 RNA. A For ORF1ab, the LOD and LLOQ were found to be 16 aM and 74.6 aM for analog assay, and 1.2 aM and 8.7 aM for digital assay, respectively. B For N gene, the LOD and LLOQ were found to be 23.4 aM and 59 aM for analog assay, and 0.8 aM and 7.5 aM for digital assay, respectively. C For mixture of ORF1ab & N genes, the LOD and LLOQ were found to be 2.9 aM and 18.4 aM for analog assay, and 0.3 aM and 2.9 aM for digital assay, respectively. Technical replicates with n = 2, and data is presented as mean + s.d. D Representative epifluorescence images corresponding to different concentrations of ORF1ab RNA, showing the progressive increase in the number of plasmonic-fluors with the concentration of the target RNA. Black arrows indicate LOD, and blue arrows indicate LLOQ. Data points corresponding to blanks are included as the lowest concentration in the plots.
We explored the application of the plasmon-enhanced assay in analyzing samples obtained from COVID-19 patients and patients with confounding conditions. We have employed two commonly used sample forms, namely, nasal swab samples and saliva samples (Fig. 5A–C, Supplementary Fig. 6). We extracted RNA from the universal transportation medium (UTM) of nasal swab and saliva samples, then measured whole RNA concentration. We mixed 25 µl of the extracted RNA sample solution with 12.5 µl of N gene DNA probe (20 fg/ml) and 12.5 µl ORF1ab DNA probe (20 fg/ml). This mixture solution was incubated in a thermocycler for 20 min and then added to S9.6 antibody pre-coated microtiter wells. Subsequently, the plate was incubated with plasmonic-fluor (extinction 1), and the fluorescence intensity was obtained using a fluorescence scanner. Based on the standard curve, the viral RNA concentration in the patient samples was determined (Fig. 5B). We have employed qRT-PCR as the “gold standard” to validate results from the p-FLISA. We have set the cycle threshold (Ct) value of 39 as the positive threshold for the RT-PCR assay (indicated as a dashed line in Fig. 5A). Similarly, we set the LOD (13 aM) obtained from the standard curve as the positive detection threshold for the p-FLISA assay.

A The viral RNA Ct of delta-SARS-CoV-2 patients’ samples, alpha/beta-SARS-CoV-2 patients’ samples, SARS-CoV-2 negative individuals, and other viruses (Corona-NL63 positive, Rhinovirus positive, and Adenovirus positive) infected patients’ samples. The COVID-positive threshold was set at 39. The Ct value of undetectable samples was set at 45. B The viral RNA concentration quantified by DNA-biotin-PFLISA assay of delta-SARS-CoV-2 patients’ samples, alpha/beta-SARS-CoV-2 patients’ samples, SARS-CoV-2 negative individuals and other viruses (Corona-NL63 positive, Rhinovirus positive, and Adenovirus positive) infected patients’ samples. The positive threshold was set at LOD (13 aM) of the assay. All the samples that exhibited a lower fluorescence signal than the LOD of the assay are indicated as Not Detected (ND). C The correlation between the ORF1ab gene (Pearson’s r2 = 0.37) was tested by DNA-biotin-PFLISA assay and qRT-PCR. D Comparison of p-FLISA and ELISA in detecting SARS-CoV-2 RNA in a subset of patient samples. The dashed line represented the LOD of each of the assays.
The variants of single-strand RNA virus, SARS-CoV-2, make the control of epidemics and pandemics particularly difficult. For example, by July 2021, the B.1.617.2 (Delta) variant of SARS-CoV-2 has overtaken the alpha variant (B.1.1.7) to make it the one of the most dominant strains circulating in approximately 180 countries26,27,28. Compared with the alpha variant, the delta variant resulted in more severe symptoms and led to a higher hospital admission rate29. The emergence of such variants continues across the world even after 3 years since the onset of the pandemic. To investigate the ability of p-FLISA to detect different SARS-CoV-2 variants, we tested samples obtained from COVID-19 patients infected with alpha/beta SARS-CoV-2 (n = 15), and delta variant SARS-CoV-2 (n = 10) (Fig. 5A, B, Supplementary Fig. 5). Samples obtained from patients infected with delta variant exhibited Ct values below 20, indicating higher viral load, compared to patients infected with alpha/beta variants with Ct values above 25. The concentration of SARS-CoV-2 RNA determined by p-FLISA in delta variant samples was found to be significantly higher compared to Alpha variant samples, in complete agreement with the difference in Ct values from qRT-PCR. In fact, the concentration of viral RNA determined by the p-FLISA across all the samples revealed a good quantitative inverse correlation with Ct values obtained from the qRT-PCR (Pearson’s r2 = 0.37) (Fig. 5C). These results indicate the excellent performance of the novel assay in quantifying the concentration of viral RNA in complex biospecimen. The SARS-CoV-2 RNA concentration in SARS-CoV-2 negative samples (Ct value higher than 39) was below the LOD of the p-FLISA. Taken together, these results indicate the 100% clinical sensitivity of p-FLISA in detecting different variants of SARS-CoV-2 RNA. Furthermore, to verify the specificity of p-FLISA, we also selected samples from patients with three respiratory viruses causing symptoms similar to COVID-19. These confounding viruses include human coronavirus NL63 (HCoV-NL63 n = 5), adenovirus (n = 3), and rhinovirus (n = 2) (Fig. 5B). As an α-CoV classification virus, HCoV-NL63 has a genome similar to SARS-CoV-2 (β-CoV), associating with common upper respiratory tract infections in immunocompetent individuals30,31. The concentration of the target RNA in these samples obtained from patients with confounding viruses was below the LOD of the p-FLISA, which indicates the excellent specificity of the assay. To further validate the significant improvement in the clinical performance of p-FLISA compared to ELISA, we tested a subset of samples (n = 20) with a wide range of Ct values from 16 to 40 using ELISA and p-FLISA. The RNA in all 20 samples was detected by p-FLISA while only 6 samples were detectable by ELISA (Fig. 5D). These results further validate the improvement in LOD and clinical performance of p-FLISA compared to ELISA.
To summarize, we have designed and demonstrated an ultrasensitive and quantitative plasmon-enhanced fluoroimmunoassay for the detection of SARS-CoV-2 RNA using plasmonic-fluor as a nanolabel. The analog p-FLISA exhibited nearly 230-fold lower LOD and 77-fold lower LLOQ compared to the “gold standard” ELISA. To further improve the analytical sensitivity, the assay was implemented in digital format, which enabled approximately 2300-fold better LOD and 460-fold better LLOQ compared to ELISA. The clinical sensitivity and specificity of this simple and widely adaptable amplification-free assay is comparable to those of the RT-PCR. More importantly, unlike the Ct value in RT-PCR, absolute quantification of the viral RNA can potentially indicate the stage of illness and infectivity of the patients. Further validation of the assay with a larger set of samples is critical for a quantitative comparison of the bioanalytical parameters with RT-PCR. Using DNA probes complementary to the disease-specific target RNA, the technique can be broadly applicable to other infectious diseases and pathological conditions. Furthermore, this work can serve as a foundation for simplified assays that can be implemented in POC settings. For example, the assay can be transformed to an ultrasensitive POC assay by implementing it as a plasmon-enhanced lateral flow assay32.
Methods
Plamsonic-fluor synthesis
Plasmonic-fluor 650, synthesized according to the procedure described previously, was purchased from Auragent Bioscience, LLC24.
Patient sample acquisition
The clinical samples used in the study were acquired from the repository of saliva, serum, plasma, and nasopharyngeal swab samples from individuals confirmed/suspected of COVID-19 disease, located at Washington University School of Medicine in St Louis, and from the Barnes-Jewish Clinical Microbiology Laboratory. Control NP swab samples from asymptomatic healthy volunteers were obtained with prior written consent. For evaluation of cross reactivity with seasonal coronaviruses, samples were obtained from adults at Barnes-Jewish Hospital who tested positive with either of the four seasonal coronaviruses or respiratory diseases via clinically warranted NP sample tests. Washington University School of Medicine Human Research Protection Office (HRPO) approved the study (IRB ID # 202006004). All clinical data pre-existed at the time of data collection. A prior waiver of consent was obtained for the clinical information and data on COVID-19 PCR results.
DNA-RNA hybridization
The oligonucleic acids used in the project were purchased from Integrated DNA Technologies (IDT). The RNA sequences were selected from the genome of SARS-CoV-2. (ORF1ab:3901-3955nt; N gene: 28914-28973nt) DNA probes were designed as complementary sequences for detecting RNA. Complementary DNA-biotin probes were functionalized with a TEG-biotin group on the 3’ end. All these oligonucleic acids were purified with HPLC methods and dissolved in Taq buffer (see Supplementary Table 1 for sequence details).
Extraction of RNA and RT-qPCR analysis
A total of 52 samples were analyzed in this study, including 10 delta-SARS-CoV-2 patients (labeled A–J), 7 alpha/beta SARS-CoV-2 positive saliva samples (labeled K-Q), 8 alpha/beta SARS-CoV-2 positive nasal swab samples (labeled R-Y), 5 alpha/beta SARS-CoV-2 negative samples (labeled 1–5), 12 alpha/beta SARS-CoV-2 negative nasal swab samples (labeled 6-17), 5 HCoV-NL63 positive nasal swab samples (labeled a–e), 2 Rhinovirus positive nasal swab samples (labeled f, g) and 3 Adenovirus positive samples (labeled h-j) (Supplementary Fig. 6). RNA from patients’ saliva and nasal swab samples were extracted using Monarch® Total RNA Miniprep Kit (T2010S, NEB, England) following the instructions provided by the vendor. The whole extracted saliva or swab RNA was quantified by Nanodrop (Thermo Scientific, NanoDrop 2000).
A two-step RT-qPCR was employed to detect the N gene and the ORF 1ab gene. Reverse transcription was first performed with PrimeScript RT Master Mix kits (Takara, 036 A) following the standard protocol. Subsequently, the amplification was performed using Bio-Rad CFX384 qPCR instrument (Bio-Rad, Hercules, CA) with TB Green® Premix Ex Taq™ (Takara, RR420L). Primers are listed in Supplementary Table 6.
Plasmonically enhanced DNA/RNA hybridization immunoassay
All the steps were performed in nuclease-free conditions. Fifty μl of 20 pg/ml DNA or DNA-biotin probes and 50 μl of 20 pg/ml target RNA or 50 μl of patients’ RNA solution were added into the nuclease-free 8-strip tube, then incubated at 56 °C for 20 minutes. Hybridized DNA/RNA (final concentration: 10 pg/ml) working as standards was serially diluted before being introduced to the pre-functionalized plate.
The black wall microtiter plates (Greiner bio-one, E20043K9) were functionalized with S9.6 DNA-RNA hybrid antibody (1 μg/ml in PBS, Active Motif, 65683) through overnight incubation at room temperature, followed by blocking with 1X PBS containing 1% BSA. After 3x washing with PBST (1X PBS, 0.05% Tween-20), 100 μl of the hybridized solution was added into wells, and the plate was incubated for 1 hour at room temperature.
With DNA + biotin conjugated detection antibody and DNA-biotin + biotin conjugated detection antibody forms, the plate was subsequently washed with PBST 3x and incubated with biotin-conjugated DNA-RNA hybrid antibody (0.5 μg/ml in 1XPBS 1%BSA, Active Motif, 65683) for 1 hour. Then the plate was exposed to plasmonic-fluor (extinction 1.0) for 15 mins. The detailed assay protocol is shown in Supplementary Table 4.
With the DNA-biotin detection form, the plate was directly incubated with plasmonic-fluor (extinction 1.0) for 15 minutes after 3x washing. The plate was imaged using Li-Cor CLx fluorescence imager with the following scanning parameters: higher adapter, exposure time of 5000 ms. The detailed assay protocol is provided in Supplementary Tables 4 and 5.
Digital-resolution detection DNA/RNA hybridization immunoassay
All hybridization steps are the same as described above. After hybridization, the standards and patients’ samples were incubated within S9.6 DNA-RNA hybrid antibody (1 μg/ml in PBS, Active Motif, 65683) pre-coated glass-bottom plates (Cellvis, P96-1.5H-N). The plate was subsequently exposed to plasmonic-fluor (extinction 1.0) for 15 minutes, followed by 3x PBST washing.
All images were acquired on a Nikon Eclipse Ts2R-FL epifluorescence illumination microscope with a 20x, 0.75–numerical aperture (NA) lens and 60x, 1.4-NA. The microscope is attached to a Hamamatsu digital camera (ORCA-Flash 4.0) with Aura light engine. We used NIS-Elements AR 5.11.01 64-bit software to acquire images. Fluorescence images were collected in channels corresponding to Cy5 and TRITC. 200 ms exposure time was used. All images were saved as .jpeg files and further processed using a particle counting algorithm.
Statistical analysis
The statistical analysis was performed with GraphPad Prism 6, and all values were expressed as mean ± s.d. For testing the statistical difference between two groups, an unpaired two-tailed t-test was used. For evaluating the correlation strength, the Pearson r analysis was used. Statistical significance of the data was calculated at 95% (P < 0.05) confidence intervals. We employed a four-parameter logistic or polynomial fit for the standard curves. The signal LOD in the unit of fluorescence intensity (a.u.) is determined according to Eq.1. The concentration LOD and LLOQ was then deduced from the standard curve. Origin 2016 was employed for calculating the LOD and LLOQ.
Supporting Information
Supporting Information includes a comparison of ELISA and p-FLISA of different gene targets with different methods, additional images of digital p-FLISA, Ct values of all the samples analyzed in this study, and additional experimental details.
Data availability
The particle counting algorithm for digital p-FLISA is available at: https://github.com/singamaneni/Counting-single-plasmonic-nanoparticles.
References
-
Mina, M. J. & Andersen, K. G. COVID-19 testing: One size does not fit all. Science 371, 126–127 (2021).
-
Paltiel, A. D., Zheng, A. & Walensky, R. P. Assessment of SARS-CoV-2 screening strategies to permit the safe reopening of college campuses in the United States. JAMA Netw. Open 3, e2016818 (2020).
-
Larremore, D. B. et al. Test sensitivity is secondary to frequency and turnaround time for COVID-19 screening. Sci. Adv. 7, eabd5393 (2021).
-
Bracis, C. et al. Widespread testing, case isolation and contact tracing may allow safe school reopening with continued moderate physical distancing: A modeling analysis of King County, WA data. Infect. Dis. Model. 6, 24–35 (2021).
-
Dong, T. et al. Diagnostics and analysis of SARS-CoV-2: current status, recent advances, challenges and perspectives. Chem. Sci. 14, 6149–6206 (2023).
-
Liu, Y. et al. Nano-biosensor for SARS-CoV-2/COVID-19 detection: methods, mechanism and interface design. RSC Adv. 13, 17883–17906 (2023).
-
Rauch, J. N. et al. A Scalable, Easy-to-Deploy Protocol for Cas13-Based Detection of SARS-CoV-2 Genetic Material. J. Clin. Microbiol. 59, https://doi.org/10.1128/jcm.02402-02420 (2021).
-
de Puig, H. et al. Minimally instrumented SHERLOCK (miSHERLOCK) for CRISPR-based point-of-care diagnosis of SARS-CoV-2 and emerging variants. Sci. Adv. 7, eabh2944 (2021).
-
Amaral, C. et al. A molecular test based on RT-LAMP for rapid, sensitive and inexpensive colorimetric detection of SARS-CoV-2 in clinical samples. Sci. Rep. 11, 16430 (2021).
-
Moitra, P., Alafeef, M., Dighe, K., Frieman, M. B. & Pan, D. Selective naked-eye detection of SARS-CoV-2 Mediated by N Gene Targeted Antisense Oligonucleotide Capped Plasmonic Nanoparticles. ACS Nano 14, 7617–7627 (2020).
-
Lu, S. et al. Fast and sensitive detection of SARS-CoV-2 RNA using suboptimal protospacer adjacent motifs for Cas12a. Nat. Biomed. Eng. 6, 286–297 (2022).
-
Najjar, D. et al. A lab-on-a-chip for the concurrent electrochemical detection of SARS-CoV-2 RNA and anti-SARS-CoV-2 antibodies in saliva and plasma. Nat. Biomed. Eng. 6, 968–978 (2022).
-
Wang, D. et al. Rapid lateral flow immunoassay for the fluorescence detection of SARS-CoV-2 RNA. Nat. Biomed. Eng. 4, 1150–1158 (2020).
-
Puhach, O., Meyer, B. & Eckerle, I. SARS-CoV-2 viral load and shedding kinetics. Nat. Rev. Microbiol. 21, 147–161 (2023).
-
Boguslawski, S. J. et al. Characterization of monoclonal antibody to DNA.RNA and its application to immunodetection of hybrids. J. Immunol. Methods 89, 123–130 (1986).
-
Phillips, D. D. et al. The sub-nanomolar binding of DNA-RNA hybrids by the single-chain Fv fragment of antibody S9.6. J. Mol. Recognit. 26, 376–381 (2013).
-
Sanz, L. A. & Chédin, F. High-resolution, strand-specific R-loop mapping via S9.6-based DNA-RNA immunoprecipitation and high-throughput sequencing. Nat. Protoc. 14, 1734–1755 (2019).
-
Hartono, S. R. et al. The Affinity of the S9.6 Antibody for Double-Stranded RNAs Impacts the Accurate Mapping of R-Loops in Fission Yeast. J. Mol. Biol. 430, 272–284 (2018).
-
Gibbons, H. R. & Aune, T. M. Immunoprecipitation of DNA:RNA Hybrids Using the S9.6 Antibody. Methods Mol. Biol. 2161, 195–207 (2020).
-
Hu, Z., Zhang, A., Storz, G., Gottesman, S. & Leppla, S. H. An antibody-based microarray assay for small RNA detection. Nucleic Acids Res. 34, e52 (2006).
-
Zhang, H., Huang, X., Liu, J. & Liu, B. Simultaneous and ultrasensitive detection of multiple microRNAs by single-molecule fluorescence imaging. Chem. Sci. 11, 3812–3819 (2020).
-
Yu, H., Han, R., Su, J., Chen, H. & Li, D. Multi-marker diagnosis method for early Hepatocellular Carcinoma based on surface plasmon resonance. Clin. Chim. acta; Int. J. Clin. Chem. 502, 9–14 (2020).
-
Wang, M. et al. Photoelectrochemical biosensor for microRNA detection based on a MoS(2)/g-C(3)N(4)/black TiO(2) heterojunction with Histostar@AuNPs for signal amplification. Biosens. Bioelectron. 128, 137–143 (2019).
-
Luan, J. et al. Ultrabright fluorescent nanoscale labels for the femtomolar detection of analytes with standard bioassays. Nat. Biomed. Eng. 4, 518–530 (2020).
-
Seth, A. et al. Plasmon-Enhanced Digital Fluoroimmunoassay for Subfemtomolar Detection of Protein Biomarkers. Nano Lett. 24, 229–237 (2024).
-
Dougherty, K., Mannell, M., Naqvi, O., Matson, D. & Stone, J. SARS-CoV-2 B.1.617.2 (Delta) Variant COVID-19 Outbreak Associated with a Gymnastics Facility – Oklahoma, April-May 2021. Mmwr. Morbid. Mortal. Wkly. Rep. 70, 1004–1007 (2021).
-
O’Dowd, A. Covid-19: Cases of delta variant rise by 79%, but rate of growth slows. BMJ (Clin. Res. ed.) 373, n1596 (2021).
-
CDC. COVID-19: SARS-CoV-2 variant classifications and definitions. Atlanta, GA: US Department of Health and Human Services. https://www.cdc.gov/coronavirus/2019-ncov/variants/variant-info.html?CDC_AA_refVal=https%3A%2F%2Fwww.cdc.gov%2Fcoronavirus%2F2019-ncov%2Fcases-updates%2Fvariant-surveillance%2Fvariant-info.html (accessed 2021).
-
Wise, J. Covid-19: Delta variant doubles risk of hospital admission compared with alpha variant, study shows. BMJ (Clin. Res. ed.) 374, n2152 (2021).
-
Chen, B. et al. Overview of lethal human coronaviruses. Signal Transduct. Target. Ther. 5, 89 (2020).
-
van der Hoek, L., Pyrc, K. & Berkhout, B. Human coronavirus NL63, a new respiratory virus. FEMS Microbiol. Rev. 30, 760–773 (2006).
-
Gupta, R. et al. Ultrasensitive lateral-flow assays via plasmonically active antibody-conjugated fluorescent nanoparticles. Nat. Biomed. Eng. 7, 1556–1570 (2023).
Acknowledgements
The authors thank Prof. Rohit Pappu and Prof. Jianjun Guan for providing access to the qRT-PCR instrument setup. The authors also thank the Nano Research Facility (NRF) and Institute of Materials Science and Engineering (IMSE) at Washington University for providing access to electron microscopy facilities. A subset of clinical samples used in this study was obtained from the Washington University School of Medicine’s COVID-19 biorepository, which is supported by: the Barnes-Jewish Hospital Foundation; the Siteman Cancer Center grant P30 CA091842 from the National Cancer Institute of the National Institutes of Health; and the Washington University Institute of Clinical and Translational Sciences grant UL1TR002345 from the National Center for Advancing Translational Sciences of the National Institutes of Health. This repository was developed and is maintained by Jane O’Halloran, MD, PhD; Charles Goss, PhD; and Phillip Mudd, MD, PhD, and the authors acknowledge their gratitude to them. We acknowledge the financial support from the National Science Foundation (CBET-2224610, CBET-2316285, CMMI-1548571). The content is solely the responsibility of the authors and does not necessarily represent the view of the National Institutes of Health or the National Science Foundation.
Ethics declarations
Competing interests
S.S. and J.J.M. are inventors on a pending patent related to plasmonic-fluor technology, and the technology has been licensed by the Office of Technology Management at Washington University in St. Louis to Auragent Bioscience LLC. S.S. and J.J.M. are co-founders/shareholders of Auragent Bioscience LLC. S.S. and J.J.M., along with Washington University, may have financial gain through Auragent Bioscience LLC through this licensing agreement. A.S. is currently employed with Auragent Bioscience. All other authors declare no competing interests. These potential conflicts of interest have been disclosed and are being managed by Washington University in St. Louis.
Additional information
Publisher’s note Springer Nature remains neutral with regard to jurisdictional claims in published maps and institutional affiliations.
Supplementary information
Rights and permissions
Open Access This article is licensed under a Creative Commons Attribution-NonCommercial-NoDerivatives 4.0 International License, which permits any non-commercial use, sharing, distribution and reproduction in any medium or format, as long as you give appropriate credit to the original author(s) and the source, provide a link to the Creative Commons licence, and indicate if you modified the licensed material. You do not have permission under this licence to share adapted material derived from this article or parts of it. The images or other third party material in this article are included in the article’s Creative Commons licence, unless indicated otherwise in a credit line to the material. If material is not included in the article’s Creative Commons licence and your intended use is not permitted by statutory regulation or exceeds the permitted use, you will need to obtain permission directly from the copyright holder. To view a copy of this licence, visit http://creativecommons.org/licenses/by-nc-nd/4.0/.
About this article

Cite this article
Liu, L., Seth, A., Liu, Y. et al. Plasmon-enhanced bioassay for amplification-free detection and quantification of SARS-CoV-2 RNA. npj Biosensing 3, 13 (2026). https://doi.org/10.1038/s44328-026-00078-x
-
Received:
-
Accepted:
-
Published:
-
Version of record:
-
DOI: https://doi.org/10.1038/s44328-026-00078-x