
Introduction
Alzheimer’s disease (AD), the most common neurodegenerative disorder, is characterized by progressive cognitive decline, memory loss, and neuronal degeneration. As global aging intensifies, AD poses a growing public health crisis1. The disease’s molecular hallmarks include extracellular amyloid-β (Aβ) plaques and intracellular neurofibrillary tangles (NFTs) composed of hyperphosphorylated tau protein. According to the amyloid cascade hypothesis, Aβ accumulation initiates downstream tau pathology2,3. Emerging evidence highlights prion-like transmissible phosphorylated tau as a critical driver of cognitive impairment, the defining clinical feature of AD4. Consequently, detecting misfolded tau in central/peripheral tissues and biofluids has become pivotal for early diagnosis, disease monitoring, and therapeutic evaluation.
The 2024A/T/(N) research framework identifies central tau via tau-PET imaging, cerebrospinal fluid (CSF) p-tau, and peripheral blood p-tau as biomarkers detectable 10–20 years before overt cognitive symptoms5. Neuropathological studies, corroborated by tau-PET, map tau progression in AD brains: beginning in transentorhinal-entorhinal regions, advancing to the hippocampus, limbic areas, and finally neocortical regions6,7,8. This spread mirrors prion-like mechanisms, where pathological tau seeds propagate between cells, with seeding activity emerging as an early biomarker in preclinical models4,9. Notably, recent work detected tau-seeding activity in AD patients’ skin, suggesting its diagnostic potential10. However, the relationship between tau-seeding activity, regional tau phosphorylation and expressing levels, and Braak staging remains poorly defined.
This study analyzes five postmortem brain regions from neuropathologically confirmed AD and non-AD individuals: inferior temporal gyrus (ITG), middle temporal gyrus (MTG), superior temporal gyrus (STG), cerebellum (CER), and entorhinal cortex (ENT). Seeding activity, tau phosphorylation status, and tau protein levels were assessed in ITG, MTG, STG, and CER, while only seeding activity was measured in ENT. Using real-time quaking-induced conversion (RT-QuIC) with τ306/K19CFh tau fragments as substrates, we quantify tau-seeding activity in the brain samples. Parallel western blot analyses measure total tau (t-tau) and site-specific phosphorylated tau (p-tau) levels. We further assess correlations between seeding activity, Braak staging, and p-tau levels, and validate tau phosphorylation profiles in ITG, a region linked to accelerated tau propagation8, using mass spectrometry. We reveal that tau-seeding activity is significantly elevated across all five AD brain regions compared to non-AD controls, though trace activity is detectable in less diluted non-AD homogenates. Among AD regions, seeding activity is highest in ITG and ENT, followed sequentially by MTG, STG, and CER. Seeding activity strongly correlates with p-tau levels detected by western blotting with antibodies directed against pTau217, pTau396, pTau262 but not with pTau181 or t-tau (TAU5 antibody). Moreover, 4 p-tau species (pTau231, pTau262, pTau263, and pTau396) are exclusively identified by mass spectrometry in ITG of AD brains.
Results
Demographic features and cohorts of autopsied brain tissues examined
Brain tissues were obtained from neuropathologically diagnosed cases, including 14 AD (10 male/4 female) and 13 non-AD control (8 male/5 female) individuals. Samples were derived from two independent cohorts: Cohort 1 (T1): Beijing Tiantan Hospital Brain Bank, Capital Medical University, Beijing, China. Cohort 2 (X2): Department of Anatomy and Neurobiology, Xiangya School of Basic Medical Science, Central South University, Changsha, Hunan, China (Table 1). The AD group was significantly older than non-AD controls (81.5 ± 9.7 vs. 71.5 ± 14.81 years; p = 0.0539 > 0.05). AD cases exhibited advanced Braak (range: 2–6; mean ± SD: 4.21 ± 1.25 vs. 1.15 ± 1.14 in non-AD; p < 0.0001) and Thal stages (range: 1–4; 2.36 ± 1.36 vs. 0.15 ± 0.38 in non-AD; p < 0.0001), consistent with severe neuropathology (Table 1).
Tau-seeding activity of pre-formed fibrils from different recombinant tau fragments
We first assessed tau-seeding activity using recombinant tau pre-formed fibrils (PFFs) generated from three variants: τ306, K19CFh, and a τ306/K19CFh mixture. Monomeric forms of each fragment served as substrates in corresponding RT-QuIC assays. PFFs were prepared by shaking recombinant tau fragments (τ306, K19CFh, or τ306/K19CFh mixture) at 37 °C for 7 days, following established protocols10,11,12. Transmission electron microscopy (TEM) confirmed fibrillar structures in τ306 and τ306/K19CFh PFFs but not in K19CFh PFFs (Supplementary Fig. 1b–d). Seeding activity, measured by RT-QuIC, varied significantly among PFF types. τ306 tau-PFFs demonstrated the strongest activity, followed by the τ306/K19CFh mixture, while K19CFh tau-PFFs showed minimal activity, with a detection threshold of 0.1 pg/mL (Supplementary Fig. 1e–g). Lag times increased progressively with serial dilution (10⁻2 to 10⁻11) across all PFF types. These findings, combined with TEM data, indicated that the τ306/K19CFh tau mixture provides optimal substrate performance for RT-QuIC, aligning with methodology validated by Kraus et al. 11.
Analysis of brain tau-seeding activity and end-products of tau RT-QuIC
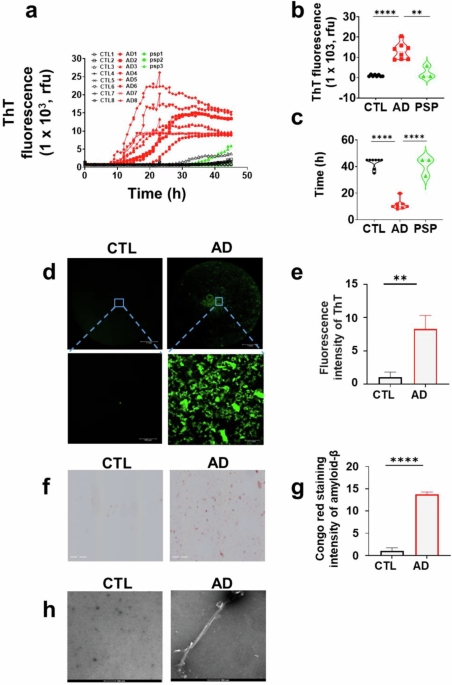
We next evaluated the τ306/K19CFh tau-based RT-QuIC assay using brain-derived tau aggregates from neuropathologically confirmed AD cases (n = 8), progressive supranuclear palsy (PSP, a non-AD tauopathy) cases (n = 3), and non-AD controls (n = 8). ThT fluorescence in AD samples began rising significantly after 10 h, plateauing at ~20 h in some cases before gradually declining (Fig. 1a). Non-AD controls exhibited only marginal fluorescence increases after ≥30 h. At 30 h, AD cases showed markedly higher fluorescence intensity than PSP [12.93 × 10³ ± 3.83 × 10³ vs. 2.44 × 10³ ± 2.45 × 10³ arbitrary units (a.u.); p = 0.0032 < 0.01] and controls [12.93 × 10³ ± 3.83 × 10³ vs. 1.05 × 10³ ± 0.42 × 10³ arbitrary units (a.u.); p < 0.0001], with significantly shorter lag times (AD vs. PSP: 11.38 ± 3.49 h vs. 41.00 ± 5.66 h; p < 0.0001; AD vs. CTL: 11.38 ± 3.49 h vs. 42.88 ± 3.76 h; p < 0.0001) (Fig. 1b, c). These results confirmed that AD brain homogenates drive tau-seeding activity by recruiting recombinant tau substrates.

a Tau RT-QuIC assay of 10−5-diluted brain homogenates from AD cases (n = 8), PSP cases (n = 3), and non-AD controls (n = 8) in the τ306/K19CFh substrate. b Comparison of end-point tau ThT fluorescence of different brain areas at the brain homogenate dilution of 10−5. *p < 0.05; **p < 0.01. c Comparison of lag times of tau RT-QuIC assay of brain homogenates at 10−5 from different areas. d Fluorescence microscopy images of RT-QuIC end-products derived from AD (n = 3) and non-AD (n = 3) brain tau. e Quantitative analysis of data shown in Panel (f) Congo red staining of tau RT-QuIC end-products from AD (n = 3) and non-AD (n = 3) brain homogenates, imaged under polarized light microscopy. Scale bar: 200 μm. g Quantitative analysis of data shown in Panel (h). Transmission electron microscopy images of RT-QuIC end-products from AD and non-AD brain homogenates. Scale bar: 10 nm.
To assess whether fluorescence increases reflected the increase in tau aggregation by the seeding activity of misfolded tau aggregates, we analyzed RT-QuIC end-products using fluorescence microscopy, Congo red staining, and transmission electron microscopy (TEM). AD samples exhibited significantly higher fluorescence intensity in 96-well plates than controls (8.29 ± 2.04 vs. 1.00 ± 0.80; p = 0.0045 < 0.005; Fig. 1d, e). Congo red staining intensity was also elevated in AD samples (13.75 ± 0.56 vs. 1.00 ± 0.74; p = 1.89 × 10⁻⁵; Fig. 1f, g), while TEM revealed fibrillar structures exclusively in AD samples (Fig. 1h).
Tau-seeding activity in different brain areas of AD patients
Abnormal tau aggregation is a hallmark of AD, progressing along the Braak staging framework: initial pathology in the entorhinal cortex spreads to the hippocampus, then to temporal lobe gyri, and ultimately to broader cortical regions. Temporal lobe involvement across disease stages has been mapped using AT8 immunohistochemistry targeting phosphorylated tau13. To evaluate tau-seeding activity in the brain regions affected in different Braak stages of AD, we analyzed the ENT, ITG, MTG, and STG using RT-QuIC with τ306/K19CFh tau substrate, alongside CER as controls (minimally and lastly affected in AD).
Serial dilutions (10⁻4–10⁻9) of AD (n = 9) and non-AD (n = 5) brain homogenates were assayed. ThT fluorescence decreased with increasing dilution (Fig. 2a). At 10−4 dilution, both AD and non-AD homogenates showed fluorescence increases, but AD samples exhibited significantly higher intensity at 10−6 (11.91 ± 8.78 vs. 2.63 ± 2.93; p = 0.0053 < 0.01) (Fig. 2b). Non-AD fluorescence became undetectable at ≤10−5, whereas AD homogenates retained detectable signals up to 10−7 (notably in ITG). ITG fluorescence intensity surpassed CER (11.91 ± 8.78 vs. 3.05 ± 2.76; p = 0.049 < 0.05), and AD samples displayed shorter lag times at 10−6 dilution (37.89 ± 9.0 h vs. 48.2 ± 3.6; p = 0.042 < 0.05) (Fig. 2c). Seeding activity, quantified as log SD50/mg tissue via Spearman–Kärber analysis, ranked ITG (8.4) > MTG (7.8) > STG (6.3) > CER (5.5) (Fig. 2d)11. Given that ENT is considered as the earliest area to be affected by tau-pathology, we also compared its tau-seeding activity with that in the above 3 temporal areas. Among the 4 brain areas examined, ENT exhibited the highest seeding-activity (Supplementary Fig. 2a). Our ANOVA analyses showed no significant differences in seeding activity (p = 0.2376 > 0.05), but significant differences in their RT-QuIC lag phases among the brain areas (p = 0.0317 < 0.05) (Supplementary Fig. 2).

a Brain homogenates from inferior-temporal gyrus (ITG, light pink), middle-temporal gyrus (MTG, light green), superior-temporal gyrus (STG, light blue) and cerebellum (CER, dark pink) of AD (n = 9) and non-AD (gray lines, n = 5), were subjected to RT-QuIC assay of tau-seeding activity at different concentrations of brain homogenates from 10−4 to 10−9 in the presence of the tau τ306/K19CFh substrates. b Comparison of end-point tau ThT fluorescence of different brain areas at the brain homogenate dilution of 10−6. *p < 0.05; **p < 0.01. c Comparison of lag times of tau RT-QuIC assay of brain homogenates at 10−6 from different areas. d Quantitative analysis of tau-seeding activity by RT-QuIC end-point dilution analysis of tissue homogenates of different brain areas of AD cases (n = 9) and non-AD controls (n = 5). The Spearman–Kärber analyses were used to determine the seeding dose (SD50) that is shown as log SD50/mg brain tissue.
To confirm fluorescence increases reflected tau-seeding activity, RT-QuIC end-products from AD (n = 3) and non-AD (n = 3) brain regions were also analyzed by filter-trap assay (FTA), a method that has been used to detect protein aggregates, using the 3R tau-specific RD3 antibody. Tau bands were detected exclusively in AD samples, with ITG/MTG showing greater intensity than non-AD (p < 0.05; Supplementary Fig. 3a, b). Transmissibility assays in HEK293T cells expressing GFP-tagged 3RD tau (aa243-274/306-375; 2N4R isoform) revealed GFP+ inclusions in cells exposed to AD-derived seeds, unlike non-AD controls (Supplementary Fig. 3c–f).
Finally, correlations of Braak/Thal stages with tau-seeding activities from different brain areas were also examined by Pearson’s correlation analysis. The end-point ThT fluorescence of tau-seeding activity was observed to be correlated strongly with Braak/Thal staging in ITG (highest correlation) (Fig. 3a), followed by MTG, STG, and CER (Fig. 3b–d), aligning with regional neuropathological progression.

Left panels show the tau ThT fluorescence intensity (tau-seeding activity) at the end-point of RT-QuIC of brain homogenate dilution of 10−6 with Braak stage: a ITG; b MTG; c STG; d CER. Right panels show the tau ThT fluorescence intensity at the end-point of RT-QuIC of brain homogenate dilution of 10−6 with Thal stage: a ITG; b MTG; c STG; d CER. Linear regression lines with 95% confidence interval are shown.
Protein levels and phosphorylation of tau species detected by western blotting and immunohistochemistry and their correlation with tau-seeding activity in different brain areas
To evaluate whether RT-QuIC-detected tau-seeding activity reflects tau levels in AD brains, we quantified t-tau and p-tau isoforms (p-tau396, p-tau217, p-tau262, and p-tau181) in brain regions (ITG, MTG, STG, and CER) using WB probing with antibodies specific to each epitope. TAU5 immunoblotting revealed the highest t-tau levels in ITG, followed by MTG, STG, and CER in AD brains, though without statistical significance (Fig. 4a, b). In non-AD brains, MTG and CER showed numerically higher t-tau levels than AD brains, but again without significance. p-Tau396 levels in AD brains were highest in ITG (14.35 ± 19.87), followed by MTG (8.31 ± 10.88), STG (3.60 ± 5.32; p = 0.003 < 0.01), and CER (2.70 ± 6.68; p < 0.0001) (Fig. 4c, d). AD ITG and MTG exhibited significantly higher p-tau396 than non-AD counterparts (ITG: 14.35 ± 19.87 vs. 1.47 ± 2.77, p = 0.0002 < 0.0005; MTG: 8.31 ± 10.88 vs. 0.82 ± 0.95, p = 0.0135 < 0.05). MTG p-tau396 exceeded STG (p < 0.0001), but ITG and MTG did not differ significantly (p > 0.05).

Western blotting of tau from different brain areas including ITG, MTG, STG and CER with different anti-tau antibodies TAU5 (a), pTau396 (c), pTau217 (e), pTau181 (g) and pTau262 (i) while the right side of each panel is the corresponding quantitative analysis of the tau band intensity by densitometry (b, d, f, h, and j). Molecular weight markers (in kDa) are shown on the left of each blot. GAPDH was used as the internal reference for normalizing the varied volumes loaded from each individual samples. Each individual western blotting experiment was repeated at least twice.
AD brains showed markedly elevated p-tau217 in ITG (11.36 ± 10.23 vs. 0.65 ± 0.70; p < 0.0001), MTG (3.21 ± 2.88 vs. 0.45 ± 0.63; p < 0.0005), and STG (1.22 ± 1.04 vs. 0.33 ± 0.30; p < 0.001) compared to non-AD (Fig. 4e, f). ITG levels surpassed MTG (p = 0.0013 < 0.005), STG (p < 0.0001), and CER (p < 0.0001), while MTG exceeded STG (p = 0.032 < 0.05) and CER (p = 0.0052 < 0.01). p-tau262 levels in AD brains were significantly higher than non-AD across all regions: ITG (13.10 ± 17.50 vs. 3.50 ± 3.18; p = 0.0061 < 0.01), MTG (10.58 ± 11.02 vs. 2.55 ± 2.08; p = 0.0116 < 0.05), STG (6.42 ± 6.34 vs. 2.36 ± 1.58; p = 0.0052 < 0.01), and CER (5.13 ± 3.98 vs. 1.99 ± 1.57; p = 0.0116 < 0.05) (Fig. 4i, j). No significant differences in p-tau181 levels were observed between AD and non-AD brains or across brain regions (p > 0.05) (Fig. 4g, h).
IHC using an antibody against pTau217 revealed significantly increased p-tau217 levels in all 4 brain areas examined in AD compared to non-AD controls (Supplementary Fig. 4a). Among these areas, staining intensity was highest in the ITG, followed by the MTG, STG, and CER. Comparing IHC staining intensities in the ITG using different anti-tau antibodies, the pTau231 antibody detected the strongest signal, followed by pTau396, TAU5, and pTau181 (Supplementary Fig. 4b). These findings were consistent with observations from western blotting.
p-Tau217, p-tau396, and p-tau262 levels positively correlated with endpoint ThT fluorescence intensity and inversely correlated with RT-QuIC lag times (Supplementary Supplementary Fig. 5). In contrast, t-tau (TAU5) and p-tau181 showed no correlation with either parameter.
Effect of immunodepletion of different tau species from AD brain homogenates on their tau-seeding activity of RT-QuIC
To evaluate the specificity of the tau RT-QuIC assay and investigate how distinct tau species within AD-derived aggregates influence seeding activity, AD brain homogenates were subjected to immunodepletion (ID) using antibodies targeting specific tau epitopes prior to RT-QuIC analysis. Among the four antibodies tested—directed against p-tau at residues 181, 217, 396, and total tau (TAU5)—ID with p-tau217 and TAU5 antibodies markedly reduced tau-seeding activity. In contrast, similar to negative controls with magnetic beads/antibodies but without immunodepletion procedure, with p-tau181 or p-tau396 antibody also showed no significant impact on seeding efficiency (Supplementary Fig. 6). These findings suggest that tau-seeding activity in AD brain homogenates is selectively dependent on epitopes recognized by p-tau217 and TAU5, while phosphorylation at residues 181 and 396 does not critically contribute to the prion-like propagation detected by RT-QuIC.
Determination of differences in tau phosphorylation in the brains of AD and non-AD individuals by mass spectrometry
To investigate differences in tau phosphorylation between AD and non-AD brains, tau protein was isolated from the ITG of postmortem human brain samples (3 AD and 3 non-AD cases) via immunoprecipitation using the TAU5 antibody and analyzed by mass spectrometry (Fig. 5). A total of 11 phosphorylation sites predominantly localized to the proline-rich region (PRR) and microtubule-binding domain (MBD) were identified on tau molecules from AD brains. These included T181, S199/S202/S205, T217, T231, S262, S263, S396 and T403/S404 (Fig. 5). Notably, 7 of these sites (T181, S199/S202/S205, T217, T403/S404) were also detected in non-AD controls, though T217 exhibited significantly elevated phosphorylation levels in AD compared to non-AD brains. Strikingly, four phosphorylation sites (T231, S262, T263, and S396) were exclusively observed in AD-derived tau, with no detectable signal in non-AD samples (Fig. 5). These AD-specific phosphorylation clustered within the PRR and MBD (S396/S400), regions critically associated with tau’s pathological aggregation.

a Diagram of procedures for mass spectrometry of tau isolated from ITG of AD and non-AD brain homogenates by immunoprecipitation with anti-tau antibody TAU5 (created with biogdp.com.) The immunoprecipitated tau was examined by mass spectrometry for the detection of phosphorylation sites. b The upper panel shows the phosphorylation abundance at specific residues mapped onto the tau isoform from AD (n = 3) and non-AD controls (n = 3). Th lower panel illustrates the phosphorylation sites of tau identified by mass spectrometry. The 2N4R tau isoform was used as a reference for the tau area examined. The red diamonds represent AD samples while the black ones represent non AD controls.
Discussion
Our study yielded the following key insights regarding tau-seeding activity in AD: 1) The RT-QuIC system combining τ306/K19CFh tau mixtures as both seeds (PFFs) and substrate demonstrated significantly higher seeding efficacy than systems using τ306 or K19CFh tau alone; 2) Tau-seeding activity varied across AD brain regions, with ENT exhibiting highest seeding-activity among the 5 brain areas examined. This activity positively correlated with Braak staging; 3) Trace (but significantly lower) seeding activity was detectable in non-AD brain samples; 4) The final tau RT-QuIC products from AD brains were confirmed as tau fibrils via combined Thioflavin T fluorescence, Congo red staining, and FTA; 5) In vitro-amplified tau fibrils demonstrated intracellular propagation in HEK293T cells expressing 3R-tau, but not in those expressing 4R-tau; 4) Western blot (WB) revealed significantly higher levels of pTau217 and pTau396 in ITG compared to superior temporal gyrus (STG) and CER; 6) Seeding activities of pTau217, pTau262, and pTau396 strongly correlated with their respective total tau levels (WB); 7) Anti-tau antibodies exhibited differential efficiency in immunodepleting brain-derived tau seeding activity; 8) Mass spectrometry of immuno-enriched tau from ITG identified 11 phosphorylation sites, primarily in the proline-rich region and microtubule-binding domain. Among these, pTau231, pTau262, pTau263, and pTau396 were AD-specific. These findings highlight the diagnostic and prognostic potential of quantifying tau-seeding activity for AD, suggesting its utility in tracking disease progression, stratifying pathology, and evaluating therapeutic efficacy.
Recent advances in identifying AD-specific biomarkers have significantly improved our ability to track pathology in vivo. Brain imaging and fluid-based assays detecting misfolded proteins—particularly Aβ and tau—are now central to diagnostic frameworks, including the 2018 and 2024A/T/N criteria established by the NIA-AA5,14. These criteria solidify the role of molecular imaging and plasma biomarkers in early diagnosis. However, existing biomarkers fail to fully capture AD’s pathological diversity. A critical unmet need is the detection of misfolded tau’s prion-like seeding activity, which drives tau aggregation and spread. Addressing this gap, our study confirms—consistent with Kraus et al.11—that a τ306/K19CFh tau mixture serves as an optimal substrate for AD brain-derived tau seeds in RT-QuIC assays. Notably, despite the simplification of the protocol by removing silicon beads and tau-knockout mouse brain homogenate, our assay achieves a similar detection efficiency to the previously reported method11. This optimized assay demonstrated exceptional sensitivity, detecting tau-PFFs at 0.1 pg/mL and retaining quantifiable signals from AD brain homogenates diluted to 10⁻⁹. Notably, peripheral detection of seeding activity is emerging as a diagnostic frontier. Analogous to prion and α-synuclein seeding activity detected in the skin of patients with prion diseases and Parkinson’s disease15,16, recent work identifies skin tau-seeding activity in AD and other tauopathies10. This approach shows promise for differentiating tauopathies from synucleinopathies17. Beyond diagnosis, a critical question remains: Does skin tau-seeding activity reflect the pathological traits of brain tau aggregates? Establishing this link will determine its utility in monitoring brain-specific pathology and therapeutic efficacy.
Our RT-QuIC analysis of autopsy brain samples revealed significantly elevated tau-seeding activity in all four examined AD brain regions versus non-AD controls. Activity followed a distinct regional hierarchy: ENT > ITG > MTG > STG > CER, with ENT – an early epicenter of tau propagation – exhibiting the highest activity. Seeding activity in these brain areas positively correlated with Braak staging18. Activity strongly correlated with phospho-tau levels (western blot), particularly pTau217, followed by pTau396 and pTau262, suggesting these hyperphosphorylated species drive seeding. Regional phosphorylated tau patterns (RT-QuIC/WB) were independently validated via anti-pTau217 immunohistochemistry. Antibodies targeting distinct tau epitopes differentially reduced seeding activity: pTau217 and TAU5 (t-tau) antibodies significantly decrease seeding activity while pTau181 antibody showed no significant effect. Notably, no antibody completely abolished seeding, aligning with a prior report9. Our study provides further evidence that pTau217 may serve as a key pathological driver. Unlike pTau181 – which showed no difference in WB levels between AD/non-AD controls and no functional impact on seeding – pTau217 demonstrated markedly elevated levels in AD brains, strongest correlation with seeding activity, and greatest functional contribution to seeding (per immunodepletion). These findings align with clinical evidence establishing plasma pTau217 as a superior AD biomarker versus pTau181 for diagnosis19,20, predicting AD conversion19,21, tracking progression in preclinical/prodromal AD22,23,24.
Our study provides further evidence that pTau217 may serve as a key pathological driver in AD. Unlike pTau181 – which showed no significant differences between AD and non-AD brains and limited contribution to tau seeding – pTau217 demonstrated markedly elevated levels in AD, the strongest correlation with seeding activity, and the greatest impact on tau aggregation, as confirmed by immunodepletion experiments. This conclusion is further supported by large-scale cohort studies (Supplementary Table 1). For instance, plasma pTau217 achieved AUC values of 0.89 in the Arizona neuropathology cohort and 0.96 in the Swedish BioFINDER-2 cohort for distinguishing AD from controls. Additionally, in imaging-based studies such as ADNI, Huashan, and the Greater Bay Area cohorts, plasma pTau217 consistently demonstrated excellent accuracy in predicting tau-PET or Aβ-PET positivity, with AUCs ranging from 0.90 to 0.97—substantially higher than plasma pTau181 and NFL (AUC 0.50–0.81). Notably, ADNI data indicate that plasma pTau217 correlates strongly with tau-PET signals in key brain regions (Spearman p ≈ 0.65–0.77) and identifies tau-PET positive individuals with an AUC of up to 0.93, even in preclinical amyloid-positive individuals25,26,27. These findings support the notion that pTau217 is a biologically and clinically significant tau species. The seeding activity of pTau217 detected by RT-QuIC likely reflects a pathological tau conformation central to neuropathological progression in AD.
Notably, our study detected trace tau-seeding activity in undiluted homogenates from non-AD brains. However, this activity vanished upon serial dilution, contrasting sharply with the robust, dilution-resistant seeding observed in AD samples. This distinction extends to molecular markers pTau181 levels (detected by western blot) that showed no significant difference between AD and non-AD brain regions. Total tau levels (detected by TAU5 antibody) were also comparable between groups. Critically, the TAU5 antibody significantly reduced seeding activity despite detecting tau in both cohorts. This suggests that non-AD brains harbor small amounts of misfolded, phosphorylated tau capable of seeding, albeit far less efficiently than in AD, which aligns with emerging evidence of preclinical tauopathy: Tau seeds are detectable in clinically/pathologically normal aged individuals11,28. Tau filaments occur in Primary Age-Related Tauopathy (PART) without clinical symptoms5,29,30. Future research must dissect the structural and biochemical differences between tau aggregates in AD versus non-AD/preclinical cases to define the threshold of pathological significance.
Mass spectrometry analysis of immuno-enriched tau from ITG revealed distinct phosphorylation profiles between AD and non-AD brains: Four phosphorylation sites were exclusively detected in AD samples including pTau231, pTau262, pTau263, and pTau396. pTau217 showed significantly higher signal intensity in AD vs. non-AD controls. Phosphorylation at residues 181, 199/202/205, and 403/404 showed no significant difference between groups. All 11 identified phosphorylation sites clustered primarily within the proline-rich region (PRR) and microtubule-binding domain (MBD). These mass spectrometry findings directly align with our prior observations above: elevated pTau217/pTau396 levels correlated with seeding activity (WB/RT-QuIC) and immunodepletion implicated pTau217 in seeding functionality and regional tau pathology patterns (IHC).
There are following 4 limitations in our study: First, the modest cohort of autopsy cases examined limits the statistical power to establish definitive conclusions. Future studies with larger cohorts are needed to validate these findings. Second, analysis was restricted to four brain regions. Expanding assessment to additional areas (e.g., limbic system, neocortex) would provide a more comprehensive understanding of tau pathology topography. Third, the restricted panel of anti-tau antibodies available for immunodepletion and detection may overlook contributions of other phospho-species or conformers to seeding activity. Finally, phosphor-proteomic analysis was performed only in ITG. Profiling tau modifications across multiple regions would clarify spatial heterogeneity in phosphorylation signatures.
In conclusion, this study establishes that tau-seeding activity directly correlates with regional tau burden and site-specific phosphorylation in the AD brain. Critically, we provide experimental validation that pTau217 surpasses pTau181 as a diagnostic biomarker for AD, demonstrating stronger associations with seeding activity, disease-specific elevation, and functional relevance. Additionally, AD-specific phosphorylation sites (e.g., pTau231, pTau262, pTau263, and pTau396) identified here represent promising candidate biomarkers. To translate these insights into clinical practice, future work must bridge central and peripheral tau pathology—comparing brain-derived seeding activity with accessible biomarkers (e.g., skin, plasma)—to develop practical, minimally invasive diagnostic tools for tauopathies.
Methods
Brain tissue processing
This work was approved and monitored by the ethics committee of the First Affiliated Hospital of Nanchang University. Samples were derived from two independent cohorts: Cohort 1 (T1): Beijing Tiantan Hospital Brain Bank, Capital Medical University, Beijing, China. Cohort 2 (X2): Department of Anatomy and Neurobiology, Xiangya School of Basic Medical Science, Central South University, Changsha, Hunan, China. All brain donors had signed voluntary donation after death during life or the informed consents were signed by the donors next kins.
Immunohistochemistry
Consecutive serial sections from each human brain tissue sample were prepared for immunohistochemistry (IHC) staining of Aβ and phosphorylated tau. In brief, after deparaffinization and hydration, the sections were immersed in heated citrate buffer (pH 6.0) for antigen retrieval. The tissues were then rinsed with phosphate-buffered saline (PBS) and incubated in 3% hydrogen peroxide and PBS for 30 min at room temperature (RT). The sections were then blocked with 3% bovine serum albumin (BSA) for 30 min at RT. The tissue sections were separately incubated with primary mouse monoclonal antibodies: anti-Aβ (1:2000, clone: 4G8, BioLegend, #800708) and anti-phospho-tau (1:2500, clone: AT8, Invitrogen, AB_223647; 1:1000, clone: ptau396, Abcam, ab109390; 1:50, clone: ptau217, Thermo Fisher, 44–744; 1:50, clone: ptau231, Thermo Fisher,701056; 1:50, clone: TAU5, Thermo Fisher, AHB0042; 1:50 clone: ptau181, Cell Signaling,12885) for one hour. Then, the sections were washed with PBS and incubated with secondary antibody (1:200, goat anti-mouse, Servicebio, GB23301) for 1 h at RT. Finally, the immunoreactive proteins were visualized using diaminobenzidine (DAB) staining. All slides were counterstained with hematoxylin for IHC. Panoramic scanning of the IHC-stained slides was performed using ImageScope software (Aperio_GT_450, Leica, Germany).
Protein expression and purification
The K19CFh and τ306 tau plasmids were similarly constructed and transformed into E. coli for generating recombinant tau fragments as previously described11,31 (Supplementary Fig. 1a). Protein expression was induced with 0.5 mM isopropyl β-D-1-thiogalactopyranoside. Cells were pelleted by centrifugation at 3750 rpm for 35 min at 4 °C, resuspended in Buffer A (10 mM Tris, pH 8.0, 500 mM NaCl, 5 mM imidazole), and lysed via sonication (3 cycles of 45 s pulse-on/15 s pulse-off). The lysate was centrifuged at 10,000 × g for 1 h at 4 °C, filtered through a 0.45 μm syringe filter, and loaded onto a 5 mL His-Trap FF column (GE Healthcare, 17-5255-01) for affinity purification. Prior to elution, the column was washed with 7 column volumes (CV) of 30 mM imidazole in 10 mM Tris (pH 8.0) and 500 mM NaCl to remove weakly bound contaminants, followed by a 5 CV wash with 46 mM imidazole. The protein was eluted using an 8 CV linear gradient of 46–200 mM imidazole. Fractions (2 mL) were collected, supplemented with 2 μL of 2 M dithiothreitol (DTT) to achieve a final concentration of 2 mM, and analyzed by sodium dodecyl sulfate-polyacrylamide gel electrophoresis (SDS-PAGE). High-purity fractions were pooled and precipitated overnight at 4 °C with 4-fold volumes of acetone. The precipitate was centrifuged at 10,000 × g for 20 min at 4 °C. After discarding the supernatant, the pellet was washed with 5 mL of acetone containing 2 mM DTT per 2 mL of original fraction. The protein was solubilized in 8 M guanidine hydrochloride (Gdn-HCl; 2 mL per fraction) and desalted into 1× PBS, pH 7.0 using a PD-10 desalting column (GE Healthcare, 17-0851-01) under gravity flow. Protein concentration was determined by measuring optical density (OD) at 280 nm for every 0.5 mL fraction. Fractions with minimal residual Gdn-HCl were pooled to maximize yield. The purified protein was adjusted to 0.75 mg/mL in 1× PBS (pH 7.0) and stored at −80 °C until further use.
Preparation of pre-formed fibrils
Various recombinant tau monomeric fragments including τ306, K19CFh and mixture of τ306/K19CFh were incubated separately at 37 °C in a shaking incubator (Eppendorf) at 1200 rpm in a solution of 50 mM Tris-HCl containing 100 mM NaCl (pH 8.0) for 5 days as previously described12. Turbidity was measured at OD600.
Preparation of human brain tissue homogenates
Approximately 30–50 mg of brain tissue was homogenized in ice-cold lysis buffer (10 mM Tris, 150 mM NaCl, 0.5% Nonidet P-40, 0.5% deoxycholate, 5 mM EDTA, pH 7.5) supplemented with a protease inhibitor. The tissue was homogenized using 1 mm zirconia beads and a Mini Beadbeater to prepare a 10% w/v brain tissue homogenate as previously described32.
RT-QuIC analysis
The RT-QuIC assay was performed as previously described with a slight modification10,11,33. Key modifications from the Kraus et al.11. protocol include the omission of both silica beads and tau-free mouse brain homogenate from the reaction mixture, and the use of a 1-minute shake/10-minute rest cycle. In brief, the reaction mix for brain tau was prepared with 10 mM HEPES, pH 7.4, 400 mM NaCl, 40 μM heparin,10 μM thioflavin T (ThT), and either τ306, K19CFh, or mixture of τ306/K19CFh at a 1:3 molar ratio for a final total substrate concentration of 12 μM. In a 96-well plate (Nunc), 98 μL aliquots of the reaction mix were added to each well, followed by seeding with 2 μL of diluted brain homogenate in 10 mM HEPES, 1× N2 supplement (Gibco), 1× PBS and centrifuged at 5000 × g for 5 min at 4 °C. The N2 supplement was used for reducing non-specific seeding activity. The plate was sealed with a plate sealer film (Nalgene Nunc International) and then incubated at 37 °C in a BMG FLUOstar Omega plate reader (Hamburg, Germany). The incubation involved cycles of 1 min of double orbital shaking followed by a 10-min of rest for the specified duration. ThT fluorescence measurements from bottom read (450 ± 10 nm excitation and 480 ± 10 nm emission) were recorded every 45 min. Gain was set at 1000, varied from different readers with the bottom reading. Each sample dilution contained 4 replicate reactions. The average ThT fluorescence values per sample were calculated using data from all 4 replicate wells. A sample was considered positive if its ThT fluorescence in two or more wells exceeded a threshold defined as the mean fluorescence plus 5 standard deviations (SD). The reaction end-point was set at 50 h to preclude the confounding effects of spontaneous substrate aggregation. To quantify tau-seeding activity detected by RT-QuIC, end-point dilution titrations were employed to determine the estimates of the sample dilution that generated positive reactions in 50% of the replicate reactions as the 50% seeding dose or SD50 (usually 2 out of 4 replicates).
RT-QuIC assays of AD brain tau with or without immunodepletion by the anti-tau antibodies
The brain homogenates from AD individuals were centrifuged at 5000 × g for 10 min at 4 °C and the pellets were discarded. A 100 μL of immunoprecipitation (IP) lysis buffer containing 1% BSA, 150 mM NaCl, 1% Triton-X, 50 mM Tris HCl, pH 7.0, and protease inhibitor was mixed with 1 μg of TAU5 antibody directed against total tau (t-tau) or phosphorylated tau (p-tau, pTau217, pTau181 and pTau396). The mixture was incubated with 30 μL of A/G magnetic beads (Pierce, MA) at 4 °C, ensuring rotation overnight. A 100 μL of the supernatant from the brain homogenates was incorporated and rotated at 4 °C overnight. Then, a magnetic rack was used to separate and retain the supernatant that was used as seeds in subsequent Immunodepletion RT-QuIC procedures10.
Western blotting
The samples prepared as described above were separated using home-made 12.5% SDS-PAGE mini gels. Proteins from the gels were transferred onto Immobilon-P polyvinylidene fluoride (PVDF, Millipore) membranes for 90 min at 70 V. After incubation with 5% BSA in 0.1% Tween-20 in 1× PBS, the separated target proteins were immunoblotted with primary antibody TAU5 (1:1000, mouse, Thermo Fisher), pTau396 (1:5000, rabbit, Abcam), pTau217 (1:1000, rabbit, Thermo Fisher), pTau181 (1:1000, mouse, Cell signaling), or pTau262 (1:1000, rabbit, Thermo Fisher) for 2 h at RT. The blots were then washed with washing buffer containing 5% fat-free milk in TBS and 0.1% Tween-20 for 3 times, 10 min/time, followed by incubation with the HRP-conjugated secondary antibody either sheep anti-mouse or donkey anti-rabbit at 1:3000 dilution for 1 h at RT. The proteins on the membrane were visualized using ECL Plus, and the resulting signal was captured using a Bio-Red ChemiDoc™chemiluminescent imaging system. Densitometric analysis was used to measure the intensity of tau for the quantitative analysis
Filter-trap assay
The filter-trap assay was used to determine the tau aggregates in the RT-QuIC end-product as described previously10. In brief, the end products were mixed with washing buffer containing 2% SDS, 10 mM Tris-HCl, pH 8.0 and 150 mM NaCl for 1 h at RT. Following incubation, the samples were filtered through a cellulose acetate membrane (Advantec MFS, Dublin, CA). After filtering, the membrane was rinsed with washing buffer containing 0.1% SDS in 1× PBS to remove unbound proteins and subsequently blocked with 5% BSA in 0.1% Tween-20 in 1× PBS for an hour. The membrane was then probed with the anti-tau RD3 antibody, followed by incubation with sheep anti-mouse secondary antibody. The proteins on the membrane were visualized and quantified as mentioned above.
Transmission electron microscopy
Transmission electron microscopy (TEM) images were collected as previously described34. Briefly, 3 μL RT-QuIC end-product was deposited onto a copper mesh (mesh size of 230) with carbon coated grid which had been hydrophilically treated with a glow discharger. After incubation for 60 s, residual sample solution was blotted off with a piece of filter paper from the grid edge. The grid was washed quickly with 3 μL 2% uranyl acetate solution for two times. Subsequently, the grid was stained with 3 μL 2% uranyl acetate solution for 60 s, then the stain solution was removed with a piece of filter paper from the grid edge. After naturally dried, the grid was observed using a transmission electron microscope (Thermo Fisher Tecnai Spirit, 120 kV) equipped with an EMSIS Veleta camera (2 K * 2 K).
Mass spectrometric analysis
The brain homogenates from AD and non-AD controls were centrifuged at 5000 × g for 10 min at 4 °C and the pellets were discarded. A 100 μL of immunoprecipitation (IP) lysis buffer containing 1% BSA, 150 mM NaCl, 1% Triton-X, 50 mM Tris HCl, pH 7.0, and protease inhibitor was mixed with 1 μg of TAU5 antibody directed against t-tau. The mixture was incubated with 30 μL of A/G magnetic beads (Pierce, MA) at 4 °C, ensuring rotation overnight. A 100 μL of the supernatant from the brain homogenates was incorporated and rotated at 4 °C overnight. The proteins were eluted using 20 μL of 50 mM glycine (pH 2–3), and the samples were neutralized to pH 7.5. In-gel digestion of protein samples was carried out as follows: gel pieces (1 × 1 mm) were destained with 25 mM ammonium bicarbonate (NH₄HCO₃) in 50% acetonitrile (ACN) at 37 °C for 3 h, followed by further washing in 80% ACN with sonication for 5 min, repeated twice35. The gel cubes were then reduced using 10 mM DTT in 40 mM NH₄HCO₃ at 56 °C for 45 min and alkylated with 55 mM iodoacetamide (IAM) in 40 mM NH₄HCO₃ at room temperature for 30 min in the dark. After washing with 80% ACN and drying in a SpeedVac, digestion was performed by adding trypsin (12.5 ng/µL) in a buffer containing 50 mM acetic acid (HAc) and 100 mM NH₄HCO₃. The gel cubes were incubated with trypsin at 4 °C for 5 min, followed by overnight digestion at 37 °C. The digestion was terminated with 10 µL of 10% trifluoroacetic acid (TFA), and the resulting peptides were extracted by eluting with 50% ACN, 0.5% TFA at 37 °C for 30 min, repeated twice. The samples were dried and desalted with 80% ACN, 0.1% formic acid (FA), and then re-suspended in 0.1% FA. The peptide concentration was measured using a Nanophotometer, and the final peptide solution was transferred into a vial for subsequent liquid chromatography-mass spectrometry (LC-MS) analysis.
Development of stable cell lines
Two site-directed mutations were incorporated into constructs encoding the tau triple-repeat domains (3RD, amino acids 243–274 and 306–375, corresponding to 2N3R tau) and tetraple-repeat domains (4RD, amino acids 243–375, corresponding to 2N4R tau). The tau 3RD construct with L266V and V337M mutations (3RD∗VM) and the tau 4RD construct with P301L and V337M mutations (4RD∗LM) were then fused to enhanced green fluorescent protein (EGFP) at the C-terminus as described previously17. Subsequently, these constructs were inserted into the pcDNA3.1 vector and labeled as 3RD∗VM-EGFP and 4RD∗LM-EGFP. HEK293T cells were maintained in Dulbecco’s modified Eagle medium (DMEM, Gibco) supplemented with 1% penicillin-streptomycin (PS, Gibco) and 10% fetal bovine serum (FBS, qualified Australia, Gibco) at 37 °C with 5% CO2 and appropriate humidity. The cells were plated in 6-well plates at a density of 1 × 10⁶ cells per well. After 24 h, either 3RD∗VM-EGFP or 4RD∗LM-EGFP plasmids were transfected into the cells using LIP3000 liposome transfection reagent (Thermo Fisher). Following a 48-h transfection period, the cells were detached with trypsin and reseeded into 6 cm2 culture dishes. Stable polyclonal cell lines were established by culturing the cells in complete medium supplemented with 1 μg/mL puromycin (Beyotime) for 7 days.
Cell aggregation assay
HEK293T-3RD∗VM-EGFP or HEK293T-4RD∗LM-EGFP cells were seeded at a density of 1.25 × 10⁶ cells per well in 24-well plates with clear glass bottoms and black polystyrene walls (Cellvis)17. Following overnight incubation at 37 °C in a 5% CO2 humidified environment to promote cell adhesion, a mixture containing the RT-QuIC end product (10% of final volume), Lip3000 (2% of final volume), and Opti-MEM (88% of final volume) was prepared and added to the cells after 15 min of RT incubation. The plates were then further incubated for 2 days under the same conditions. Subsequently, the cells were washed with 1× PBS, fixed with 4% paraformaldehyde at RT for 20 min, and stained with 4’,6-diamidino-2-phenylindole (DAPI, Sigma-Aldrich) for 10 min. After 3 washing with 1× PBS, fluorescence microscopy was conducted using a confocal microscope (Stellaris 5, Leica) with DAPI (excitation: 352 nm, emission: 461 nm) and FITC (excitation: 495 nm, emission: 519 nm) channels for cell imaging.
Statistical analysis
Experiments were performed in triplicate unless otherwise indicated. Data represent mean ± SD. Statistical analyses were conducted using GraphPad Prism (v10.4.2; GraphPad Software) with significance (α = 0.05, two-sided) determined by one-way ANOVA (Tukey’s post-hoc for multiple comparisons) or Student’s t test (pairwise comparisons).
Data availability
All data generated or analyzed during this study are included in this published article and its supplementary information file.
References
-
Vinze, S., Chodosh, J., Lee, M., Wright, J. & Borson, S. The national public health response to Alzheimer’s disease and related dementias: origins, evolution, and recommendations to improve early detection. Alzheimer’s. Dement. 19, 4276–4286 (2023).
-
Hardy, J. A. & Selkoe, D. J. The amyloid hypothesis of Alzheimer’s disease: progress and problems on the road to therapeutics. Science 297, 353–356 (2002).
-
Hardy, J. A. & Higgins, G. A. Alzheimer’s disease: the amyloid cascade hypothesis. Science 256, 184–185 (1992).
-
Holmes, B. B. et al. Proteopathic tau seeding predicts tauopathy in vivo. Proc. Natl. Acad. Sci. USA. 111, E4376–E4385 (2014).
-
Jack, C. R. et al. Revised criteria for diagnosis and staging of Alzheimer’s disease: Alzheimer’s Association Workgroup. Alzheimers Dement. 20, 5143–5169 (2024).
-
Braak, H. & Braak, E. Neuropathological stageing of Alzheimer-related changes. Acta Neuropathol. 82, 239–259 (1991).
-
Braak, H. & Braak, E. Staging of Alzheimer’s disease-related neurofibrillary changes. Neurobiol. Aging 16, 271–278 (1995).
-
Lee, W. J. et al. Regional Aβ-tau interactions promote onset and acceleration of Alzheimer’s disease tau spreading. Neuron 110, 1932–1943.e5 (2022).
-
Furman, D. et al. Expression of specific inflammasome gene modules stratifies older individuals into two extreme clinical and immunological states. Nat. Med. 23, 174–184 (2017).
-
Wang, Z. et al. Seeding activity of skin misfolded tau as a biomarker for tauopathies. Mol. Neurodegener. 19, 92 (2024).
-
Kraus, A. et al. Seeding selectivity and ultrasensitive detection of tau aggregate conformers of Alzheimer disease. Acta Neuropathol. 137, 585–598 (2019).
-
Okuzumi, A. et al. Propagative α-synuclein seeds as serum biomarkers for synucleinopathies. Nat. Med. 29, 1448–1455 (2023).
-
Braak, H., Alafuzoff, I., Arzberger, T., Kretzschmar, H. & Del Tredici, K. Staging of Alzheimer disease-associated neurofibrillary pathology using paraffin sections and immunocytochemistry. Acta Neuropathol. 112, 389–404 (2006).
-
Jack, C. R. et al. NIA-AA Research Framework: Toward a biological definition of Alzheimer’s disease. Alzheimers Dement. 14, 535–562 (2018).
-
Orrù, C. D. et al. RT-QuIC assays for Prion disease detection and diagnostics. In Prions (ed. Lawson, V. A.) 1658, 185–203 (Springer, 2017).
-
Wang, Z. et al. Skin α-synuclein aggregation seeding activity as a novel biomarker for Parkinson disease. JAMA Neurol. 78, 30–40 (2021).
-
Dellarole, I. L. et al. Tau seeding activity in skin biopsy differentiates tauopathies from synucleinopathies. npj Parkinsons Dis. 10, 116 (2024).
-
Chongtham, A. et al. Neocortical tau propagation is a mediator of clinical heterogeneity in Alzheimer’s disease. Mol. Psychiatry 30, 4194–4213 (2025).
-
Janelidze, S. et al. Head-to-head comparison of 10 plasma phospho-tau assays in prodromal Alzheimer’s disease. Brain 146, 1592–1601 (2023).
-
Palmqvist, S. et al. Discriminative accuracy of plasma phospho-tau217 for Alzheimer disease vs other neurodegenerative disorders. JAMA 324, 772–781 (2020).
-
Lehmann, S. et al. Clinical value of plasma ALZpath pTau217 immunoassay for assessing mild cognitive impairment. J. Neurol. Neurosurg. Psychiatry 95, 1046–1053 (2024).
-
Ashton, N. J. et al. Differential roles of Aβ42/40, p-tau231 and p-tau217 for Alzheimer’s trial selection and disease monitoring. Nat. Med. 28, 2555–2562 (2022).
-
Du, L. et al. Longitudinal plasma phosphorylated-tau217 and other related biomarkers in a non-demented Alzheimer’s risk-enhanced sample. Alzheimers Dement. 20, 6183–6204 (2024).
-
Lombardi, A. M., Sangiolo, D. & Vigna, E. MET oncogene targeting for cancer immunotherapy. IJMS 25, 6109 (2024).
-
Palmqvist, S. et al. Blood biomarkers to detect Alzheimer disease in primary care and secondary care. JAMA 332, 1245–1257 (2024).
-
Mattsson-Carlgren, N. et al. Aβ deposition is associated with increases in soluble and phosphorylated tau that precede a positive Tau PET in Alzheimer’s disease. Sci. Adv. 6, eaaz2387 (2020).
-
Lan, G. et al. Comprehensive evaluation of plasma tau biomarkers for detecting and monitoring Alzheimer’s disease in a multicenter and multiethnic aging population. Nat. Aging 5, 1601–1618 (2025).
-
Manca, M. et al. Tau seeds occur before earliest Alzheimer’s changes and are prevalent across neurodegenerative diseases. Acta Neuropathol. 146, 31–50 (2023).
-
Crary, J. F. et al. Primary age-related tauopathy (PART): a common pathology associated with human aging. Acta Neuropathol. 128, 755–766 (2014).
-
Hansson, O. Biomarkers for neurodegenerative diseases. Nat. Med 27, 954–963 (2021).
-
Wu, L. et al. Selective detection of misfolded tau from postmortem Alzheimer’s disease brains. Front. Aging Neurosci. 14, 945875 (2022).
-
Bargar, C. et al. Streamlined alpha-synuclein RT-QuIC assay for various biospecimens in Parkinson’s disease and dementia with Lewy bodies. Acta Neuropathol. Commun. 9, 62 (2021).
-
Srivastava, A., Alam, P. & Caughey, B. RT-QuIC and related assays for detecting and quantifying Prion-like pathological seeds of α-synuclein. Biomolecules 12, 576 (2022).
-
Lövestam, S. et al. Disease-specific tau filaments assemble via polymorphic intermediates. Nature 625, 119–125 (2024).
-
Pahrudin Arrozi, A. et al. Nasal extracts from patients with Alzheimer’s disease induce tau aggregates in a cellular model of tau propagation. ADR 5, 263–274 (2021).
Acknowledgements
The authors gratefully acknowledge technical support of Yan Jiang and Zongjin Wu from the Core Facility for Biomedical Science at Nanchang University for mass spectrometry study, Boling Zhu and Peijun Zhao from the Center for Biological Imaging, Institute of Biophysics, Chinese Academy of Science for their help in examining EM and collecting related data. This work was partially supported by the startup package and developmental funds of the First Affiliated Hospital of Nanchang University (#500021001, #500021002), and National Natural Science Foundation (NSFC) (82471499) to W.Q.Z, the NSFC (82160252 & 82271439) to D.H, Jiangxi Key Laboratory of Neurological Diseases (2024SSY06072) to W.Q.Z & D.H, Beijing Municipal Natural Science Foundation (IS23103) to Y.H, Ministry of Science and Technology of the People’s Republic of China, Science Innovation 2030-Brain Science and Brain-Inspired Intelligence Technology Major Project “Network Platform for Human Brain/Tissue Banking and Cooperative Research” Task 3 (2021ZD0201103) to X.X.Y, and Scientific Research Foundation program in China (9167/28170086) & the Foreign Expert Program (9202/0210227525) to A.P.
Ethics declarations
Competing interests
The authors declare no competing interests.
Additional information
Publisher’s note Springer Nature remains neutral with regard to jurisdictional claims in published maps and institutional affiliations.
Supplementary information
Rights and permissions
Open Access This article is licensed under a Creative Commons Attribution-NonCommercial-NoDerivatives 4.0 International License, which permits any non-commercial use, sharing, distribution and reproduction in any medium or format, as long as you give appropriate credit to the original author(s) and the source, provide a link to the Creative Commons licence, and indicate if you modified the licensed material. You do not have permission under this licence to share adapted material derived from this article or parts of it. The images or other third party material in this article are included in the article’s Creative Commons licence, unless indicated otherwise in a credit line to the material. If material is not included in the article’s Creative Commons licence and your intended use is not permitted by statutory regulation or exceeds the permitted use, you will need to obtain permission directly from the copyright holder. To view a copy of this licence, visit http://creativecommons.org/licenses/by-nc-nd/4.0/.
About this article

Cite this article
Yang, Y., Guan, H., Zhang, Z. et al. Regional variations in seeding activity, phosphorylation, and protein levels of tau in Alzheimer’s disease brain. npj Biosensing 2, 37 (2025). https://doi.org/10.1038/s44328-025-00056-9
-
Received:
-
Accepted:
-
Published:
-
DOI: https://doi.org/10.1038/s44328-025-00056-9