
Introduction
Faithful duplication of the genomic DNA is essential for life. To ensure exactly one round of DNA replication per cell cycle, eukaryotic cells separate the initiation process in DNA replication into two discrete steps: licensing and firing1,2,3. During licensing, which occurs in G1 phase, the origin recognition complex (ORC), CDC6, and CDT1 coordinate the loading of two hexameric MCM2–7 complexes onto genomic DNA in a head-to-head configuration to form the MCM2–7 double hexamer (MCM-DH), which is inactive as a DNA helicase until S phase4,5,6,7,8. The activation of Dbf4-dependent kinase (DDK) and cyclin-dependent kinases (CDKs) enables the firing factors, TRESLIN-MTBP, TOPBP1, and DONSON, to recruit CDC45 and GINS to MCM-DH, converting it to two active CDC45-MCM-GINS (CMG) helicases for initiating bidirectional DNA replication3,9,10,11.
Replication origins in budding yeast are defined by the ARS consensus sequence (ACS), which is recognised and bound by ORC12,13, leading to the formation of MCM-DH around ACS-defined origins14,15. In contrast, human ORC does not exhibit a sequence specificity in vitro16 and instead localises to open chromatin regions17,18,19,20. Similarly, MCM2–7 has been reported to be rather broadly distributed at open chromatin without a sequence specificity15,20,21,22,23. In human cells, replication origins are organised into broad regions ranging from tens to hundreds of kilobases, known as initiation zones (IZs)24,25,26,27,28,29, which are predominantly found in intergenic regions between active genes. However, the factor governing the determination of IZs in human cells remains unclear3.
Genomic DNA in eukaryotes is replicated in a temporally regulated manner during S phase known as replication timing (RT), with euchromatic regions replicating early and heterochromatic regions replicating late30. RT is evolutionarily conserved, cell-type specific, and strongly correlated with the chromatin structure. Each RT segment forms a domain (RT domain) at the megabase scale, where multiple replication initiation events occur. RT is primarily regulated by the timing of replication origin firing. According to the stochastic model of origin firing, which effectively explains RT generation, two conditions must be met to account for the robust RT observed in an S-phase cell population29,30,31. First, the firing probability of each replication origin is variable and controlled by one or more limiting factors. Second, the firing probability in late RT domains increases as S phase progresses.
In yeast, firing factors Sld3–Sld7, Sld2, and Dpb11 are present in low abundance, thereby limiting replication initiation and establishing a temporal firing order of replication origins32,33. These limiting firing factors are recruited to MCM-DH through the DDK-dependent Mcm4/6 phosphorylation to assemble CMG helicase, leading to replication initiation34,35,36. Another factor involved in the temporal control of origin firing in yeast is Rif1, which forms a complex with Protein Phosphatase 1 (PP1). Importantly, the timing of origin-firing is disrupted in yeast lacking Rif137. Mechanistically, the Rif1-PP1 complex counteracts the DDK-dependent MCM-DH phosphorylation, thereby inhibiting replication initiation of late-replicating origins in early S phase38,39. Taken together, the combination of limiting factors and their temporally controlled loading onto MCM-DH is crucial for the timing of origin firing in yeast. In contrast, the mechanism underlying RT generation in human cells remains unclear, aside from the involvement of the human RIF1 homologue40,41,42,43,44.
To understand the mechanism that determines IZ and RT, as well as their relationship in human cells, we mapped the temporal firing pattern of IZs and examined the genome-wide distribution of licensing and firing factors. We revealed that TRESLIN-MTBP is a key limiting firing factor for replication initiation in human cells. Its loading onto phospho-MCM-DH determines IZs, a process regulated by the opposing phosphorylation events on MCM-DH by DDK and RIF1-PP1, which ultimately governs RT generation.
Results
Initiation zone detection with LD-OK-seq
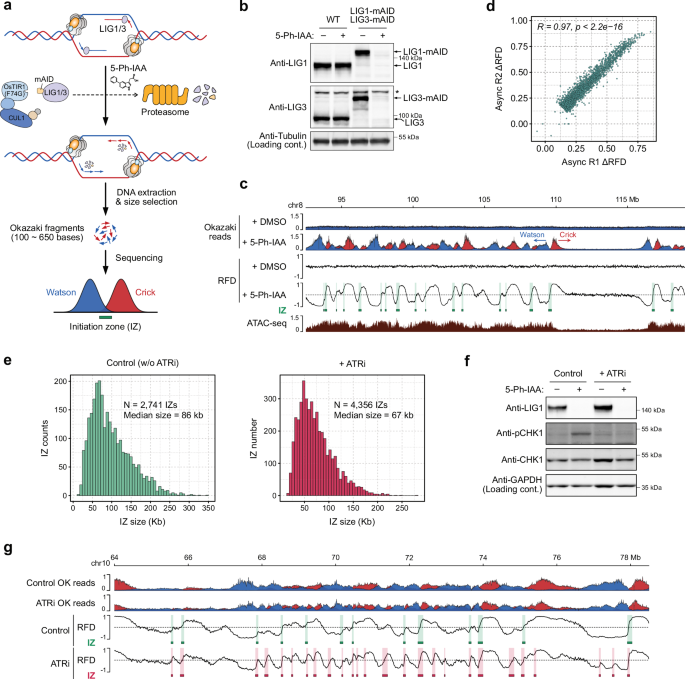
To map replication IZs genome-wide in human cells, we developed ligase-depletion Okazaki fragment sequencing (LD-OK-seq), a modified version of previously reported OK-seq24,45, that involves DNA ligase depletion using the auxin-inducible degron 2 (AID2) system46 (Fig. 1a). LD-OK-seq is advantageous because it does not require EdU labelling followed by nascent DNA purification using streptavidin beads. Therefore, cells from a single 10 cm dish are sufficient for the analyses, enabling cell cycle synchronisation, as shown later. In human colorectal HCT116 cells expressing DNA ligase 1 (LIG1) and ligase 3 (LIG3) fused with a degron tag (mini-AID or mAID) at the endogenous gene locus, both proteins were degraded within 4 h in the presence of the inducer, 5-Ph-IAA (Fig. 1b and Supplementary Fig. 1a). LIG1 and LIG3 function redundantly in Okazaki fragment maturation47, and their co-depletion caused the accumulation of Okazaki fragments (Supplementary Fig. 1b). We purified single-stranded DNA corresponding to Okazaki fragments (ranging from 100 to 650 bases) from the denaturing agarose gel and processed them for high-throughput sequencing (see ‘Methods’). Okazaki fragments derived from the Watson and Crick strands were detected in the cells depleted of both LIG1 and LIG3, but not in cells depleted of either LIG1 or LIG3 (Fig. 1c and Supplementary Fig. 1c). To identify IZs genome-wide, we analysed the LD-OK-seq data using OKseqHMM, an algorithm designed for identifying IZs from the replication fork directionality (RFD) scores48 (Supplementary Fig. 1d). IZs were identified as the genomic regions where the RFD profiles present positive slopes (e.g. transitions from negative to positive values), indicating replication forks emerged in the regions and moved leftward and rightward on each side, respectively (Fig. 1c). The firing efficiency of each predicted IZ was scored by calculating ΔRFD (Supplementary Fig. 1e) and a stringent cut-off threshold (ΔRFD ≥ 0.15) was applied to identify high-confidence IZs (Supplementary Fig. 2a). Two experimental replicates of asynchronously growing HCT116 cells yielded highly reproducible profiles of Okazaki fragment distributions and ΔRFD scores (Fig. 1d and Supplementary Fig. 2b). The reproducibility of our approach was further validated by the substantial overlap of IZs identified from each replicate (Supplementary Fig. 2c). High-confidence IZs were defined from the merged dataset as those detected in at least one replicate, yielding 2741 IZs with a median size of 86 kbp (Fig. 1e, control). Our genome-wide analyses revealed IZs in human HCT116 cells and demonstrated the robustness of the LD-OK-seq approach for mapping them.

a Schematic overview of ligase-depletion Okazaki-sequencing (LD-OK-seq). DNA ligase 1 (LIG1) and ligase 3 (LIG3) were rapidly degraded using the AID2 system, allowing the accumulation of Okazaki fragments, which were isolated by size selection for sequencing. b Immunoblots confirming LIG1 and LIG3 depletion. Cells were treated with 5-Ph-IAA for 4 h. The indicated antibodies were used for detection. The asterisk indicates a non-specific band. Three biological replicates were performed, and a representative result is shown. c Representative profiles of LD-OK-seq Okazaki reads, replication fork directionality (RFD), and ATAC-seq data. LD-OK-seq was conducted using asynchronous cell cultures, with data from two experimental replicates merged for presentation. Arrowheads indicate fork directions, with Okazaki-fragment reads from Crick and Watson strands in red and blue, respectively. Predicted IZs from LD-OK-seq are highlighted in green boxes. d Comparison of firing efficiency (ΔRFD) of IZs across two experimental replicates. Each dot represents an individual IZ. A two-sided Pearson correlation test was performed, with no adjustments for multiple comparisons. The correlation coefficient (R) and p-value (p) are displayed on the plot. e Size distribution of IZs identified by control LD-OK-seq (without ATRi) and LD-OK-seq with ATRi treatment. The total IZ numbers and the median size are provided. f Immunoblots confirming intra-S phase checkpoint activation. Cells were treated with or without ATRi for 1 h prior to 5-Ph-IAA addition. Indicated antibodies were used for detection. Two biological replicates were performed, and a representative result is shown. g Representative LD-OK-seq and RFD profiles with or without ATRi. Merged data from two experimental replicates are shown for each condition. Okazaki fragment reads from the Crick and Watson strands are depicted in red and blue, respectively. IZs from control LD-OK-seq (without ATRi) are marked with green boxes, while those from ATRi LD-OK-seq are indicated with red boxes. Source data are provided as a Source data file.
DNA ligase deficiency triggers the activation of DNA-damage checkpoint and the suppression of origin firing in yeast49,50. Consistently, we observed CHK1 phosphorylation following LIG1/3 depletion, indicating that DNA-damage checkpoint was activated in human cells depleted of LIG1/3 (Fig. 1f, control +5-Ph-IAA). To investigate whether some IZs were inhibited in our experimental condition, we treated the cells with the ATR inhibitor berzosertib (ATRi) before LIG1/3 depletion (Fig. 1f, +ATRi +5-Ph-IAA). Two experimental replicates of ATRi-treated cells revealed highly reproducible Okazaki fragment distributions and RFD profiles (Supplementary Fig. 3a). We identified 4356 IZs in the ATRi-treated cells, including 2683 IZs that overlapped with those in the ATRi-untreated cells and 1673 novel IZs (Fig. 1e +ATRi and Supplementary Fig. 3b). The median size of IZs in ATRi-treated cells was 67 kbp, 19 kbp smaller than those identified in the control ATRi-untreated cells (Fig. 1e, +ATRi). Notably, ATRi-specific IZs exhibited ΔRFD values below our threshold in the ATRi-untreated cells, and their firing efficiency significantly increased upon ATR inhibition (Fig. 1g and Supplementary Fig. 3c). These data indicate that LIG1/3 depletion activates the DNA damage checkpoint, which in turn suppresses a subset of potential weak IZs. Therefore, we concluded that LD-OK-seq without ATR inhibition identifies efficient and strong IZs.
Multiple methodologies have been developed to map replication origins in the human genome3. These approaches can be classified into two: those identified discrete replication origins (SNS-seq51,52 and Ini-seq53) and those identified broader IZs (OK-seq24, EdUseqHU54, GLOE-seq26 and Pu-seq28). We compared our mapping data with these datasets and found a strong correlation among the LD-OK-seq, OK-seq, GLOE-seq and Pu-seq mapping datasets, showing that these methodologies identified similar regions for replication initiation (Supplementary Fig. 4a). In contrast, the SNS-seq datasets, which showed numerous discrete peaks, were distant from the other datasets and rather closer to the G-quadruplex (G4) ChIP-seq profiles (Supplementary Fig. 4a). The EdUseqHU datasets formed a distinct cluster (Supplementary Fig. 4a) and identified broad firing regions that partially overlap with the IZs found by LD-OK-seq (Supplementary Fig. 4b, c). These comparative analyses demonstrate that while different methodologies vary in their capacity to detect replication origins, LD-OK-seq shows robust agreement with the other methodologies identified IZs.
Temporal activation dynamics of IZs in S phase
The previous approaches for mapping replication origins used asynchronous cells and did not investigate the temporal dynamics of origin firing in S phase. To investigate this point, we combined cell synchronisation with nocodazole and LIG1/3 depletion at multiple time points in S phase, from S1 to S6, and conducted LD-OK-seq (Supplementary Fig. 5a). The time-course LD-OK-seq data revealed distinct temporal patterns of Okazaki fragment distributions across S phase (Fig. 2a), with S1 and S2 showing pronounced Okazaki fragment reads derived from many IZs within the early-replicating domains. Subsequently, from S3 to S6, Okazaki fragments started to be detected in the mid- and late-replicating domains, where the number of detected IZs decreased over time. These temporal patterns strongly correlated with previously published High-Resolution Repli-seq datasets of HCT116 cells25 (Fig. 2a). By dividing the genome into five RT domains using Repli-seq data, we analysed the regions replicated in S1–6 within these RT domains (Fig. 2b). The early RT domains correspond to regions replicated in S1 and S2, where we detected numerous IZs (Fig. 2b). The early-to-mid (EtoM)-RT and mid-RT domains shows highest correlation to regions replicated in S3 and S4, respectively (Fig. 2b). Lastly, while the mid-to-late (MtoL)-RT domains correspond well to regions replicated in S5, Okazaki fragment signals were less intense in S6 within the late-RT domains (Fig. 2b), even though the FACS profile indicated that the cells were in late-S phase (Supplementary Fig. 5a). This is likely due to a combinational effect of stochastic firing in the late replicating domains, checkpoint-induced inhibition of weak IZs and fork stalling caused by LIG1/3 depletion.

a Representative profiles of time-course LD-OK-seq, high-resolution Repli-seq, E/L Repli-seq, and ATAC-seq. Time-course LD-OK-seq was conducted at six time points from early S phase (S1) to late S phase (S6). Crick and Watson strand Okazaki reads are displayed for each sample, with dotted lines with an arrowhead indicating IZs. High-resolution Repli-seq, E/L Repli-seq, and ATAC-seq data were obtained from previous publications (see ‘Methods’). b Heatmap depicting Okazaki fragment density across the indicated RT domains. The genome was divided into 50 kb bins. Mean Okazaki fragment density from time-course LD-OK-seq was calculated for each RT domain. c IZs identified from time-course LD-OK-seq dataset. IZs were filtered based on their corresponding RT domains. d Heatmap showing the enrichment of histone modifications on IZs. IZs are centered and grouped by the firing timing. Within each RT group, IZs are ordered by size (largest at the top). Aggregation line plots are shown above the heatmap.
To understand the temporal usage of IZs, we captured them at each time point. In the case of IZs detected across multiple time points, we assigned their activation timing based on the overlap with the RT domains (Supplementary Fig. 5b). This approach yielded 3521 IZs having a distinct activation timing (Fig. 2c). The IZs firing in the early (2056 IZs) and EtoM (691 IZs) S phases comprised 78% of all IZs, while those firing at the MtoL (237 IZs) and late (73 IZs) S phases represented only 8.8%. This skewed IZ distribution likely reflects the nature of random firing in the late replicating domains25,27,55. Analysis of the ΔRFD values across the S phase revealed that each group of IZs peaked in firing efficiency at their assigned timing31, validating our temporal classification (Supplementary Fig. 5c). Notably, the late-firing IZs showed consistently lower efficiency throughout the S phase, supporting the notion that they are activated in a highly stochastic manner. Together, these results demonstrate that time-course LD-OK-seq effectively captures both temporal replication profiles and IZs at high resolution.
It has been shown that chromatin features contributing to open chromatin are related to replication initiation24,28,56,57,58,59. Examination of chromatin features revealed distinct epigenetic features associated with IZs (Fig. 2d). Both ATAC-seq and the enhancer mark H3K4me1 were enriched at early-firing IZs, indicating that these IZs are located within open chromatin regions containing enhancers. The promoter marks (H3K4me3, H3K27ac, H3K9ac) were mostly localised at the boundaries of IZs. On the other hand, transcription-associated marks (H3K36me3, H3K79me2) were depleted within the IZs but elevated at the flanking regions. These results indicate that early-firing IZs are located within the intergenic regions between transcriptionally active genes, supporting the previous notion24,27,28. In contrast, repressive chromatin marks (H3K27me3, H3K9me3) showed broader distribution across late-firing IZs, indicating that they are located in heterochromatic regions. Notably, in agreement with previous studies24,27,28, H2A.Z exhibited a strong enrichment at early-firing IZs, consistent with its reported role in ORC1 recruitment to early-firing origins59. These results establish a clear relationship between the firing timing of IZs and the local chromatin environment, particularly in the case of early-firing IZs.
RIF1-PP1 is essential for establishing IZs
To investigate the molecular mechanisms of how RIF1 controls RT in human cells, we generated a RIF1 knockout (RIF1-KO) cell line in the HCT116 LIG1/LIG3-mAID background and performed LD-OK-seq. Asynchronous RIF1-KO cells showed a genome-wide loss of Okazaki fragment peaks and significantly attenuated RFD profiles (Supplementary Fig. 6a), suggesting widespread IZ loss and random firing across the genome. These perturbations precluded reliable identification of IZs using OKseqHMM48 (Supplementary Fig. 6b). To investigate the temporal dynamics of Okazaki fragment distributions in RIF1-KO cells, we carried out time-course LD-OK-seq (Fig. 3a, RIF1-KO). The results revealed a pronounced loss of temporal organisation in Okazaki fragment distribution (Fig. 3b), consistent with the previous reports demonstrating disrupted RT in RIF1-deficient cells40,41. Notably, we observed a significant reduction in the distinct Crick and Watson Okazaki fragment peaks, accompanied by flattened RFD profiles throughout S phase (Supplementary Fig. 6c), suggesting that the disruption of defined IZs occurred concomitantly with the loss of RT control. Furthermore, the firing efficiency of the IZs identified in the wild-type cells (Supplementary Fig. 5c) was markedly reduced in the RIF1-KO cells (Fig. 3c), supporting the notion that IZs were lost and firing occurred more randomly in the genome in the absence of RIF1. Given the strong correlation between active transcription and IZs, we performed RNA-seq analysis of RIF1-KO cells. Notably, gene expression levels remained largely unchanged (Supplementary Fig. 6d), in concordance with a previous study43, indicating that altered transcription is not responsible for the loss of IZs or RT control in RIF1-KO cells. These findings suggest two intriguing notions: RT is established through temporal activation of IZs, with strong IZs particularly enriched in early replicating domains, and RIF1 may play a direct role in IZ formation.

a Representative time-course LD-OK-seq profiles of WT and RIF1-KO cells. Okazaki fragment reads from Crick and Watson strands are depicted in red and blue, respectively. b Okazaki fragment density in RIF1-KO cells across five RT domains. The genome was segmented into 50 kb bins and categorised into five RT domains. Mean Okazaki fragment density from the RIF1-KO cells was calculated for each domain. c Dynamic changes in firing efficiency of IZs across S phase in RIF1-KO cells. WT IZs (n = 3521) were grouped by each RT domain. The y-axis shows ΔRFD scores from RIF1-KO time-course LD-OK-seq, which correspond to the firing efficiency. Box plots represent the interquartile range (IQR), with the median indicated by a line within each box. Whiskers extend to the minimum and maximum values within 1.5x IQR from the quartiles; outliers are shown as individual dots. d Top: Schematic of RIF1-WT and RIF1-ppC mutant. Bottom: Immunoblots of FLAG-IP proteins. RIF1-KO cells were rescued by expressing 3×FLAG-fused RIF1-WT or RIF1-ppC. The indicated antibodies were used for detection. This experiment was performed once. e Heatmaps of RFD profiles around early IZs. The indicated cell lines were subjected to LD-OK-seq analysis. Early IZs are centered, flanked by 100 kb on each side, and ordered by size. Source data are provided as a Source data file.
Given that PP1 is a key binding partner of RIF1 and regulates multiple RIF1-dependent functions44,60, we investigated whether RIF1-PP1 interaction is essential for the establishment of IZs and RT. To address this question, we performed a rescue experiment by expressing either wild-type RIF1 (RIF1-WT) or a PP1-binding deficient (RIF1-ppC) mutant60 in RIF1-KO cells. The RIF1-ppC mutant harbouring four alanine substitutions within the PP1-interacting domain abolished the PP1 interaction, as confirmed by co-immunoprecipitation (Fig. 3d). LD-OK-seq analysis revealed that RIF1-WT restored the characteristic fork distribution diverging from IZs and the RFD profiles (Fig. 3e and Supplementary Fig. 7a, b), indicating IZs were restored. In sharp contrast, cells expressing RIF1-ppC displayed that the fork distributions and RFD profiles remained unchanged from those in RIF1-KO cells (Fig. 3e and Supplementary Fig. 7a, b), demonstrating that PP1 binding is essential for RIF1’s role in IZ formation. Together, these results strongly support the hypothesis that the RIF1-PP1 complex plays a critical role in IZ formation, thus creating RT.
Genomic distributions of ORC and MCM
To investigate the mechanism of how IZs are determined, we examined the genome-wide distributions of DNA replication licensing factors, ORC and MCM2–7, by chromatin immunoprecipitation combined with high-throughput sequencing (ChIP-seq). To ensure that background signals were not influenced by the antibody specificity used for immunoprecipitation, we engineered HCT116 cells to express 3×FLAG-epitope fused ORC1, ORC2, MCM2, or MCM4 from the endogenous gene locus (Supplementary Fig. 8a) and utilised anti-FLAG antibody in all ChIP-seq experiments. Since licensing occurs in G1 phase, cells were synchronised by nocodazole treatment and harvested in late G1 for ChIP-seq analysis. Western blot analysis of the immunoprecipitated proteins confirmed the successful recovery of the FLAG-tagged proteins and other subunits in the complex (Supplementary Fig. 8b). ChIP-seq of experimental replicates with MCM2-FLAG cells revealed reproducible and specific MCM2 distribution patterns compared to control immunoprecipitation with FLAG-untagged cells (Supplementary Fig. 8c). As MCM2–7 is known to be present in excess, we validated our ChIP-seq results by pre-extracting cells with the detergent Triton X-100 to remove soluble proteins before fixation (Supplementary Fig. 8d). ChIP-seq of pre-extracted samples showed concordant MCM2 distributions, confirming that our standard protocol detected DNA-bound MCM2 (Supplementary Fig. 8c, MCM2 pre-extracted). We succeeded in revealing the genomic distributions of ORC1, ORC2, MCM2, and MCM4 in late G1 phase (Fig. 4a).

a Representative ChIP-seq profiles of licensing factors (ORC1, ORC2, MCM2, MCM4), IZs, RNA-seq, protein-coding genes, and H3K9me3. Cells for ORC and MCM ChIP-seq were collected 4 h after release from nocodazole. ChIP-seq data are presented as input-normalised signal ratios. RNA-seq data are shown as Log2-transformed TPM. IZs are marked as green boxes. Protein-coding genes are depicted with arrows: red for forward strand, blue for reverse strand. b Metagene profiles of ORC1 and MCM4 enrichment. Genes are aligned at the transcription start site (TSS) and transcription termination site (TTS), with 100 kb extensions upstream of the TSS and downstream of the TTS. Genes are grouped into three categories based on expression level (TPM). c Representative MCM4 ChIP-seq profiles under control and RNA Polymerase II knockdown (Pol II KD) conditions. Data are shown as input-normalised signal ratios. RNA-seq profiles from control conditions are displayed below, with transcribed regions highlighted. d Metagene profiles of MCM4 ChIP-seq under control (solid line) and RNA Pol II KD (dotted line) conditions. Genes are categorised by transcription level (TPM) and aligned at the TSS and TTS, with 100 kb extensions upstream and downstream. e Representative ChIP-seq profiles of ORC1 and MCM4 in WT and RIF1-KO cells. Data are presented as input-normalised signal ratios. IZs from WT cells are indicated as green boxes. RNA-seq data from WT cells highlight transcribed regions, with genes shown as arrows. f Heatmaps showing ORC1, MCM2, and MCM4 enrichment in WT and RIF1-KO cells around IZs. IZs are grouped into five categories based on initiation timing and are centered with 100 kb flanking regions. Within each group, IZs are ordered by size. Aggregated enrichment profiles are plotted above each heatmap.
Genome-wide binding profiles revealed strong correlations between the ORC1 and ORC2 distributions (r = 0.93) and the MCM2 and MCM4 distributions (r = 0.96), respectively (Supplementary Fig. 9a, b). In contrast to the discrete Orc and Mcm2–7 binding pattern at the ACS-defined origins in budding yeast14,15, human ORC and MCM proteins exhibited broad distribution across the genome with reduced occupancy at H3K9me3-enriched heterochromatic regions (Fig. 4a). We observed pronounced eviction of both ORC and MCM within the gene bodies, with the strongest depletion observed at highly transcribed genes (Fig. 4b). Compared to the previously published ORC and MCM ChIP-seq profiles18,19,20,21,23,61, our data showed varying degrees of consistency (Supplementary Fig. 9a, b). Nonetheless, the distribution profiles from multiple reports consistently show MCM accumulation in intergenic regions and its depletion within active gene bodies (Supplementary Fig. 9c). These trends are consistent with the report by Li et al.61. (Supplementary Fig. 9b). However, their profiles indicated that MCM-DHs were enriched in heterochromatic rather than euchromatic regions (Supplementary Fig. 9c). The discrepancy may suggest the presence of multiple populations of chromatin-bound MCM-DHs in vivo. Li et al.61 purified MCM-DHs without crosslinking MCM and DNA. During purification, some populations of MCM-DHs may have been lost, resulting in purifying MCM-DHs containing DNA with a 1-bp separation, similar to those formed in vitro7,8. Furthermore, our ChIP-seq data revealed that MCM was more extensively depleted within active gene bodies than ORC (Fig. 4b and Supplementary Fig. 9a, b), suggesting potential redistribution or removal of MCM complexes following their initial ORC-dependent loading. We, therefore, investigated whether transcription influences MCM distribution. To test this hypothesis, we knocked down the largest subunit of RNA Pol II by using BromoTag62 (Supplementary Fig. 10a) and carried out MCM4-FLAG ChIP-seq (Fig. 4c, d). RNA Pol II knockdown led to a significant increase in MCM4 occupancy within the gene bodies while maintaining similar signal intensities in the intergenic regions. These results demonstrate that active transcription by RNA Pol II contributes to shaping genome-wide MCM2–7 distribution, consistent with previous observations23,63.
Next, we investigated the correlations of ORC and MCM distributions with epigenetic histone modifications (Supplementary Fig. 10b). Our correlation analyses showed the negative associations of MCM2 and MCM4 with transcription elongation marks H3K36me3 and H3K79me2, consistent with the finding that MCM is depleted in the active gene bodies. Both the ORC and MCM proteins showed positive correlations with the ATAC-seq profile, suggesting the preferential MCM loading at open chromatin regions20,21. A positive correlation with H2A.Z further supported its proposed role in replication licensing59. Together, our high-resolution mapping of MCM revealed that human MCM2–7 exhibits a remarkably broad distribution across the genome with notable depletion at transcribed regions, in contrast to the discrete origin-specific binding in budding yeast. This raises the intriguing possibility that the MCM distributions may not define IZs, unlike in yeast.
Subsequently, we examined whether RIF1 loss would influence the genomic distributions of ORC and MCM. We carried out ORC1 and MCM2/4 ChIP-seq with RIF1-KO cells and compared the distribution profiles with those in wild-type cells (Fig. 4e and Supplementary Fig. 10c). Surprisingly, both wild-type and RIF1-KO cells showed very similar ORC and MCM distributions across the genome (Supplementary Fig. 10d). Additionally, we observed that ORC and MCM were more enriched in early RT domains than in late RT domains (Supplementary Fig. 10e). We analysed the distributions of ORC and MCM to IZs and found higher enrichment for both ORC and MCM at early-firing IZs than late-firing ones in both wild-type and RIF1-KO cells (Fig. 4f). Taken together, these results indicate that RIF1-PP1 does not affect the chromosomal distributions of ORC and MCM, yet RIF1 loss leads to significant disruption of IZs (Fig. 3a, c). Therefore, we concluded that IZs are not mainly defined by the MCM distribution in the genome. Instead, we hypothesised that a firing factor(s) required for activating the MCM-DH might be controlled by RIF1-PP1, and that its loading onto MCM-DH might determine IZs.
TRESLIN-MTBP is a limiting factor that defines IZs
In budding yeast, a limiting amount of firing factors creates a temporal hierarchy of origin activation from early to late S phase32,33. To investigate whether a similar mechanism operates in human cells, we compared the relative abundance of firing factors. In order to enable fair comparison, we established a series of HCT116 cell lines that express a firing factor fused with the 3×FLAG epitope from the endogenous gene locus. Western blotting with anti-FLAG antibody revealed TRESLIN being present at particularly low levels compared to the others (Fig. 5a). These relative abundances were consistent with quantitative proteomics in HCT116 cells64, which showed TRESLIN is expressed approximately 75-fold lower than MCM2 (Supplementary Fig. 11a). Taking the report that the abundance of the MCM subunits is estimated to be 400,000 to 700,000 molecules per cell65, we estimate that the TRESLIN abundance is about 5700 to 9300 molecules per cell. We found that the MTBP abundance is approximately three times higher than that of TRESLIN (Fig. 5a and Supplementary Fig. 11a), consistent with the report that TRESLIN is controlled by degradation, whereas MTBP is not66. Given that TRESLIN might be a rate-limiting factor, we next examined the chromosomal distribution of TRESLIN.

a Immunoblot showing the protein levels of replication factors. The endogenous genes encoding the indicated proteins were tagged with a 3×FLAG epitope. The FLAG-tagged proteins are marked with an open arrowhead. Antibodies against the FLAG epitope and tubulin were used for detection. Two biological replicates were performed, and a representative result is shown. b Representative profiles of LD-OK-seq (S1), MCM4, and TRESLIN ChIP-seq, RNA-seq, and H3K9me3. Okazaki fragment reads from the Crick and Watson strands are depicted in red and blue, respectively. Early-firing IZs are highlighted in pink. All ChIP-seq data are presented as input-normalised signal ratios. Cells for TRESLIN ChIP-seq were collected 6 h after release from nocodazole. TRESLIN ChIP-seq profiles are shown for control conditions and GINS4-depleted conditions (-GINS4). RNA-seq data are displayed as log2-transformed TPM values. Genes are annotated with coloured arrows indicating transcriptional directions. c Top: Schematic illustrating an intergenic region with or without IZ within Early- or EtoM-RT domains. Both regions are flanked by actively transcribed genes and loaded with MCM-DH, but only the intergenic region with IZ fires in early S phase. Bottom: LD-OK-seq RFD (S1) at intergenic regions categorised by the presence or absence of IZs. Intergenic regions are centered with 100 kb extensions on both sides and ordered by size. d Heatmaps of ORC1, MCM4, and TRESLIN ChIP-seq signals across intergenic regions categorised by the presence or absence of IZs. e Representative LD-OK-seq profiles in WT (S1–6) and TRESLIN-MTBP overexpressing cells (T/M-OE, S1-S2). Early-firing IZs and mid-firing IZs in WT cells are shaded in pink and green, respectively. Arrowheads link IZs to corresponding positions in the T/M-OE LD-OK-seq tracks. f Representative LD-OK-seq (S1) and TRESLIN ChIP-seq (-GINS4) profiles in WT and RIF1-KO cells. IZs in WT cells are marked with green boxes. ChIP-seq data are presented as input-normalised signal ratios. g Heatmaps showing TRESLIN enrichment (-GINS4) around IZs in WT and RIF1-KO cells. IZs are centered with 100 kb extensions on both sides and ordered by size. Source data are provided as a Source data file.
TRESLIN forms a heterodimer with MTBP and recruits CDC45 to MCM-DH for assembling the CMG helicase9,10,11. Due to their transient chromatin association and rapid release upon CMG formation, mapping TRESLIN-MTBP binding loci was technically challenging67,68. To overcome this problem, we depleted either the GINS subunit, GINS4, or CDC45 in synchronised cells and perturbed the CMG formation. As expected, we found that chromatin-bound TRESLIN-MTBP was highly accumulated in cells depleted of GINS4 or CDC45 in G1 to S phases (Supplementary Fig. 11b). We then performed ChIP-seq with the cells expressing 3×FLAG-TRESLIN synchronised in G1–S phase transition, with or without GINS4 depletion. TRESLIN binding at temporally distinct IZs revealed the confined enrichment of TRESLIN at early-firing IZs (Fig. 5b and Supplementary Fig. 11c, TRESLIN control). The TRESLIN signal was enhanced by GINS4 depletion (Fig. 5b and Supplementary Fig. 11c, TRESLIN -GINS4). Consistently, we observed a similar trend with MTBP, which is associated with early firing IZs, and its binding increased in the absence of CDC45 (Supplementary Fig. 11d). Recent reports showed TRESLIN distribution by CUT&RUN and ChIP-seq69,70. We compared our TRESLIN-ChIP data with these datasets and found that the TRESLIN CUT&RUN data by Noble et al. showed partial consistencies with our results (Supplementary Fig. 11e, f). The difference may stem from the technical aspect of CUT&RUN, which can bias enrichments toward open chromatin regions due to enzymatic chromatin digestion. In contrast, the TRESLIN ChIP-seq datasets by Thakur et al. showed limited consistencies with our data (Supplementary Fig. 11e, f). This discrepancy may be explained by their use of an antibody against TRESLIN as well as their lack of cell synchronisation to enrich chromatin-bound TRESLIN.
As shown in Fig. 5b, MCM4 was distributed broadly, avoiding active gene bodies, while TRESLIN was found at more confined regions overlapping with early-firing IZs. Consistent with previous reports24,27,28, our LD-OK-seq revealed that IZs are mostly found in the intergenic regions within the early replicating domains (Fig. 2). However, we identified that there are two types of intergenic regions: ones associated with IZs and the others without IZs, possibly because weak IZs were suppressed by the DNA-damage checkpoint (Fig. 5c). Employing these intergenic region criteria, we investigated the accumulation of ORC1, MCM4 and TRESLIN at the intergenic regions and found that ORC1 and MCM4 were accumulated similarly, regardless the presence or absence of IZs under our experimental conditions (Fig. 5d, ORC1 and MCM4). This supports our conclusion that the ORC and MCM distributions do not define IZs (Fig. 4). In contrast, we found that TRESLIN was biased to associate with intergenic regions with IZs, and this association was enhanced in the absence of GINS4 (Fig. 5d, TRESLIN). Please note that we did not deplete LIG1/3 in these ChIP-seq assays, so the DNA damage checkpoint was not activated. This might be the reason TRESLIN was weakly detected at intergenic regions without IZ. The sharp signals at the intergenic region edges, which correspond to transcription start/termination sites, are a background because similar signals were also detected from control untagged cells (Supplementary Fig. 11g). Considering these results and the essential role of TRESLIN-MTBP in DNA replication9,10,11, we concluded that TRESLIN-MTBP loading is a defining step for IZ determination and that its loading mechanism is the key for where to initiate DNA replication in human cells.
Taking the fact that the expression level of TRESLIN-MTBP is very low (Fig. 5a and Supplementary Fig. 11a) and TRESLIN-MTBP loading defines IZs (Fig. 5b, d), we asked whether TRESLIN-MTBP is a limiting factor for replication initiation. Previous studies in budding yeast demonstrated that overexpression of the limiting factors for replication initiation causes premature activation of late origins32,33. Therefore, we established an HCT116 LIG1/3-mAID cell line, which overexpresses both TRESLIN and MTBP under the control of a tetracycline-inducible promoter (Tet-T/M), and performed LD-OK-seq in early S phase (Supplementary Fig. 12a). We confirmed that both TRESLIN and MTBP were overexpressed at least 10-fold relative to the endogenous levels (Supplementary Fig. 12b). Notably, LD-OK-seq with TRESLIN-MTBP overexpression revealed that the IZs firing normally in mid-S phase were activated in early S phase (Fig. 5e, mid IZs shown in green). The Okazaki fragment peaks around the early firing IZs became disorganised in the TRESLIN-MTBP overexpressing cells, suggesting increased firing events (Fig. 5e, early IZs shown in pink). We also observed that in cells overexpressing TRESLIN-MTBP, Okazaki fragments from late RT domains were detected in S1 and S2, indicating premature replication of these domains (Supplementary Fig. 12c, T/M-OE). Unlike the global RT disruption seen in RIF1-KO cells, TRESLIN-MTBP overexpressing cells retained RT to a limited extent (Supplementary Fig. 12c, compare T/M-OE and RIF1-KO). Furthermore, we found that continued overexpression of TRESLIN-MTBP significantly reduced cell viability (Supplementary Fig. 12d, e), suggesting that generating too many replication forks might cause problems in DNA replication. Taking all, we concluded that TRESLIN-MTBP is a key limiting factor for replication initiation.
Next, we investigated whether RIF1 is involved in the proper loading of TRESLIN-MTBP to IZs. For this purpose, we carried out TRESLIN ChIP-seq with the RIF1-KO cells. Intriguingly, the specific enrichment of TRESLIN at early-firing IZs was clearly reduced in RIF1-KO cells, coincident with the loss of defined IZs (Fig. 5f, g and Supplementary Fig. 11c). These results indicate that RIF1 is required for the specific loading of TRESLIN-MTBP onto early-firing IZs, thus generating RT by accelerating replication initiation within the early RT domains.
TRESLIN-MTBP recruitment to IZs requires DDK-phosphorylated MCM-DH
Studies with budding yeast proteins established that phosphorylation of MCM-DH by DDK is essential for recruiting the yeast TRESLIN-MTBP homologue, Sld3-Sld735,71. Additionally, RIF1-PP1 has been reported to counteract the DDK-dependent MCM-DH phosphorylation in Xenopus egg extracts and human cells72,73,74. We, therefore, hypothesised that TRESLIN-MTBP loading might be controlled by the phosphorylation of MCM-DH, which is mediated by DDK. To test this hypothesis, we treated cells with the DDK inhibitor simurosertib (DDKi), then immunoprecipitated chromatin-bound TRESLIN with or without GINS (Supplementary Fig. 13a), and blotted the immunoprecipitated samples to detect MCM2 and MCM4 (Fig. 6a). Intriguingly, we found that TRESLIN binds to MCM2 and MCM4 in a DDK-dependent manner. We observed that TRESLIN interacted exclusively with phospho-MCM4 (the slow-migrating MCM4 in Fig. 6a), and such interaction was enhanced in the absence of GINS, suggesting that TRESLIN was trapped on phospho-MCM-DH without CMG formation. We carried out analogous immunoprecipitation experiments with MTBP and found that MTBP also bound exclusively to phospho-MCM4, which was pulled down more in the absence of CDC45 (Supplementary Fig. 13b). These results support the hypothesis that TRESLIN-MTBP binds phosphorylated MCM-DH mediated by DDK before the formation of CMG helicase.

a Immunoblots of FLAG-IP samples from 3×FLAG-TRESLIN cells. Refer to Supplementary Fig. 13a for the experimental timeline. Untagged cells served as a negative control. FLAG-IP was performed under untreated control, GINS4-depleted (-GINS4), and DDK-inhibited (+DDKi) conditions. Indicated antibodies were used for detection. Two biological replicates were performed, and a representative result is shown. b Immunoblots of chromatin-bound proteins in untreated control, RIF1-depleted (-RIF1), or DDKi-treated (+DDKi) cells. Refer to Supplementary Fig. 13c for the experimental timeline. Synchronised mAID-RIF1 cells were used for isolating chromatin-bound proteins. The indicated antibodies were used for detection. Ponceau S staining serves as the loading control. Two biological replicates were performed, and a representative result is shown. c Live-cell imaging with confocal microscopy of RIF1 and PCNA from G1 to G2 phase. A cell line expressing mClover-RIF1 (green) and mCherry-PCNA (red) was used for time-lapse imaging. Corresponding cell cycle phases (G1 to G2) are labelled. Two biological replicates were performed, and a representative result is shown. d Immunoblots of chromatin-bound proteins in untreated control, GINS4-depleted (-GINS4), or DDKi-treated (+DDKi) cells. Synchronised 3×FLAG-TRESLIN GINS4-mAID cells were used. Chromatin fractions were isolated via pre-extraction. The indicated antibodies were used for detection. Two biological replicates were performed, and a representative result is shown. e Heatmaps of TRESLIN enrichment around IZs in control and DDKi-treated cells. IZs are categorised by the timing of firing and centered with 100 kb extensions on both sides and ordered by size. Aggregation line plots are shown above each heatmap. f Schematic illustration showing the counteracting effects of DDK and RIF1-PP1 on MCM phosphorylation. TRESLIN-MTBP is recruited to phosphorylated MCM-DH. Source data are provided as a Source data file.
We then asked whether the phosphorylation level of MCM-DH is controlled by RIF1-PP1. For this purpose, we depleted degron-fused RIF1 (mAID-RIF1) following the scheme in Supplementary Fig. 13c and investigated chromatin-bound MCM2 and MCM4 (Fig. 6b). The phosphorylation of both MCM2 and MCM4 increased when cells went through late G1 to S phase in a DDK-dependent manner (Fig. 6b, compare control and DDKi). Importantly, the phosphorylation of MCM2 and MCM4 was highly enhanced in the absence of RIF1 (Fig. 6b, -RIF1), indicating that RIF1-PP1 de-phosphorylates MCM-DH and counteracts to DDK as reported72,73. Since RIF1-PP1 negatively regulates MCM-DH phosphorylation, we next investigated the nuclear localisation of RIF1 from G1 to G2 phase. Using live-cell imaging of an HCT116 cell line expressing mClover-tagged RIF1 and mCherry-PCNA (Fig. 6c), we observed that, in G1 phase, RIF1 was distributed in both the nuclear periphery and interior. Notably, at the onset of S phase, replication foci marked by PCNA emerged in the RIF1-depleted nuclear interior, likely corresponding to euchromatic regions. As S phase progressed, replication foci expanded, while RIF1 progressively disassociated, first from the nuclear interior and then from the periphery. In late S phase, RIF1 was largely absent from chromatin but began to reaccumulate upon entry into G2 phase. These dynamic changes in RIF1 localisation are consistent with its role as a negative regulator of DNA replication initiation.
Subsequently, we asked whether TRESLIN-MTBP loading is regulated by DDK. For this purpose, we initially looked at chromatin binding of TRESLIN after release from nocodazole arrest and found that TRESLIN’s chromatin binding increased from G1 to S phase when MCM4 became highly phosphorylated (Fig. 6d, control 6 h). This TRESLIN chromatin binding was significantly suppressed by DDKi treatment (Fig. 6d, DDKi 6 h). Similarly, we observed that MTBP chromatin binding was also suppressed by DDKi treatment (Supplementary Fig. 13d). Consistent with the essential role of TRESLIN-MTBP in GINS and CDC45 recruitment to MCM-DH, GINS4 or CDC45 depletion increased chromatin binding of TRESLIN-MTBP (Fig. 6d -GINS4 and Supplementary Fig. S13d -CDC45). Finally, we investigated whether TRESLIN’s association with IZs is DDK-dependent. We carried out TRESLIN ChIP-seq assay with DDKi-treated cells in G1–S transition and observed that TRESLIN’s association at early-firing IZs was significantly reduced (Fig. 6e). Furthermore, we sequenced the DNA co-precipitated with TRESLIN without crosslink in the experiment presented in Fig. 6a and consistently found DDKi treatment significantly reduced association of TRESLIN with IZs (Supplementary Fig. 13e). Together, these results demonstrate that TRESLIN-MTBP specifically associates with MCM-DH phosphorylated by DDK, and this phosphorylation-dependent interaction is negatively regulated by RIF1-PP1 (Fig. 6f).
Discussion
In this study, we identified the temporal distribution of IZs during S phase in human HCT116 cells and found that strong IZs are predominantly located in the intergenic regions within early RT domains (Figs. 1, 2 and 5). We revealed that the loss of RIF1 causes disorganisation of IZs, leading to RT disruption, and that RIF1-PP1 is essential for IZ formation (Fig. 3). Subsequently, we revealed that the licensing factors, ORC and MCM, are broadly distributed but more enriched in early RT domains while avoiding active gene bodies, and such distributions remain unchanged in RIF1-KO cells (Fig. 4). This indicates the genomic distribution of MCM-DH alone cannot determine the location of IZs, consistent with previous reports20,75,76. We revealed that TRESLIN-MTBP is a limiting factor for replication initiation, with its loading onto MCM-DH being negatively regulated by RIF1-PP1, which in turn defines IZs (Fig. 5). Finally, TRESLIN-MTBP binds early IZs in a manner dependent on phospho-MCM, which is counteractively phosphorylated by DDK and dephosphorylated by RIF1-PP1 (Fig. 6).
Considering these results together, we propose a model explaining how IZs are determined and why the loss of RIF1 leads to RT disorganisation in human cells (Fig. 7). RIF1-PP1 is predominantly localised in mid- and late-replication regions during G1 and early S phase, and then dissociates from chromatin as DNA replication progresses (Fig. 6c and refs. 40,77). These dynamic RIF1 localisation renders mid- and late-replication regions more resistant to MCM-DH phosphorylation in G1 and early S phase (Fig. 7, WT). Consequently, when DDK is activated, MCM-DHs in euchromatic regions are preferentially phosphorylated, promoting the loading of TRESLIN-MTBP in early S phase. Given that strong IZs are predominantly located in ATAC-seq-positive and intergenic regions marked by H2A.Z (Fig. 2d), we propose that MCM-DH phosphorylation occurs preferentially in open chromatin intergenic regions, such as those proximal to active promoters and enhancers, leading to the accumulation of TRESLIN-MTBP and making firing probability high. TRESLIN-MTBP might also be brought to MCM-DH through its interaction with BRD2 and BRD4 bound to acetylated histone H478. Under the ligase-depleted conditions, replication initiation triggers the DNA-damage checkpoint, which in turn suppresses potential weak IZs containing low levels of MCM-DH phosphorylation (Fig. 7, WT bottom). However, even in normal cells, the DNA-damage checkpoint may also contribute to regulating the firing of weak IZs through intrinsic checkpoint activation79. This model is fully consistent with the stochastic model of RT regulation29,30,31 and the observation that a few firing events still occur in late RT domains in early S phase27,80,81. We propose that IZ is a cluster of high-probability replication origins whose firing is activated by the temporal loading of TRESLIN-MTBP onto MCM-DHs (Fig. 7, WT). Consequently, IZs, which are mostly found in the early RT domains, are activated in early S phase. After origin firing, released TRESLIN-MTBP will be recycled to activate other MCM-DH, increasing firing probability in late RT domains where replication initiation occurs more stochastically. In RIF1-deficient cells, DDK-dependent phosphorylation of MCM-DH prevails in both euchromatic and heterochromatic regions. This results in the dilution of TRESLIN-MTBP, as it distributes onto MCM-DHs within heterochromatic regions (Fig. 7, RIF-KO). Consequently, IZs are lost due to random firing in both euchromatic and heterochromatic regions, leading to RT disorganisation. This model also explains why RT was partially maintained in cells overexpressing TRESLIN-MTBP (Supplementary Fig. 12c), as the phosphorylation of MCM-DH established by DDK and RIF1-PP1 remained.

In WT cells, RIF1-PP1 is localised in heterochromatin from G1 to early S phase, counterbalancing MCM-DH phosphorylation by DDK. The limiting firing factor, TRESLIN-MTBP, is specifically recruited to phosphorylated MCM-DH at intergenic regions, leading to RT formation. In RIF1-KO cells, MCM-DH phosphorylation by DDK spreads to heterochromatin. As a result, TRESLIN-MTBP binds to phospho-MCM-DH and becomes diluted, leading to random initiation and the loss of IZ and RT.
We found that TRESLIN-MTBP overexpression triggered accelerated activation of mid-S firing IZs and led to cytotoxicity (Fig. 5e and Supplementary Fig. 12e). These findings suggest that generating too many replication forks simultaneously is harmful, which may be relevant to recent reports showing that excessive DNA synthesis sequesters PCNA and RFC, preventing normal fork restart82,83. Alternatively, an excessive number of replication forks may induce DNA topological stress, as observed in yeast84. In contrast, RIF1-KO cells are viable and do not show strong growth defects40, even though the normal IZ organisations are largely lost (Fig. 3 and Supplementary Fig. 6). In RIF1-KO condition, the number of replication forks at a given time is likely similar to that in the normal cell. However, RIF1-KO causes embryonic lethality during mouse development85. These findings suggest that creating a temporal IZ firing order is important when changes in transcription, chromatin environments, and genome architectures occur.
This study revealed that the mechanism defining the genomic loci where replication initiation takes place (i.e. replication origin and initiation zone) differs considerably between budding yeast and humans, even though the replication factors involved are conserved. In human cells, MCM-DHs are broadly distributed throughout the genome, except within transcribed gene bodies, thereby providing the potential to initiate DNA replication almost anywhere. Under these conditions, TRESLIN-MTBP loading onto MCM-DH determines IZs. In contrast, in yeast, Orc binds to the ARS consensus sequence where Mcm-DHs are assembled at ARS sites, generating sequence-specific origins. In budding yeast, Orc4 acquired a unique insertion helix, which recognises the ARS-consensus sequence and is conserved only in S. cerevisiae and related yeast species12,13. Importantly, yeast lacking the Orc4 insertion helix is viable and loses the sequence dependency, suggesting that the sequence-defined replication system was acquired only in a subset of yeast species during evolution. This raises the question of whether the ancestor of eukaryotes had sequence-defined replication origins. Taking the fact that Drosophila and C. elegans have IZs without a consensus sequence86,87, a similar system to the one presented in this study may operate widely in metazoans and even in other eukaryotes. In human cells, IZs can be flexibly determined by altering the sites where TRESLIN-MTBP loads. This system may provide an advantage in adapting to changes in the chromatin landscape.
Conversely, the mechanism by which TRESLIN-MTBP (Sld3-Sld7 in yeast) functions as a limiting factor, and its loading onto MCM-DH in a DDK-dependent manner, is remarkably conserved between yeast and humans. It is worth noting that while we discovered TRESLIN-MTBP as a limiting factor in DNA replication initiation in human cells, other firing factors (e.g. DONSON) may also play a similar limiting role, as DONSON’s levels are relatively low in HCT116 (Fig. 5a and Supplementary Fig. 11a) and other cell types65.
This study uncovered the basic principles of IZ determination and RT generation in human cells. RIF1-PP1 is a key regulator of MCM-dephosphorylation and localises to mid- and late-replication regions from G1 to early S phase, thereby promoting the specific loading of TRESLIN-MTBP onto early-firing IZs. Further investigation is needed to uncover the mechanisms governing RIF1-PP1 localisation. Additionally, we cannot exclude the possibility that other mechanisms may contribute to TRESLIN-MTBP loading. Previous studies have shown that TRESLIN is phosphorylated by CDK and interacts with TOPBP188,89. However, it remains unclear whether TRESLIN phosphorylation or its interaction with TOPBP1 facilitates the association with phospho-MCM-DH. Similarly, understanding how DDK preferentially phosphorylates MCM-DHs in certain intergenic regions over others is crucial. These insights will further clarify the precise mechanism underlying IZ determination.
Methods
Cell culture and drug treatment
The human colon cancer cell line HCT116 was obtained from the American Type Culture Collection (ATCC, #CCL-247). Cells were maintained in McCoy’s 5 A medium supplemented with 10% foetal bovine serum (Gibco, #26140-079), 2 mM L-glutamine (Fujifilm Wako, #189-02025), 100 U/ml penicillin, and 100 µg/ml streptomycin (Nakalai tesque, #09367-34) at 37 °C in an incubator with 5% CO2. To induce degradation of mAID-tagged proteins, 5-Ph-IAA (BioAcademia, #30-003) was added to the culture medium at a final concentration of 1 µM46. For ATR kinase inhibition, cells were treated with 100 nM berzosertib (Selleck, #S7102) for 5 h prior to harvesting for downstream analyses. Cell cycle synchronisation was achieved by treating cells with 50 ng/ml nocodazole (Sigma, #M1404) for 15 h, then releasing arrested cells to the fresh medium. Released cells were cultured until sampling at designated time points. To induce the expression of TRESLIN and MTBP under the control of Tet-on promoter, doxycycline (Fujifilm Wako, #049-31121) was added to the culture medium at a final concentration of 1 µg/ml. To induce degradation of BromoTag-fused POLR2A, 0.5 µM AGB1 (Tocris Bioscience, #7686) was added to the culture medium62. To inhibit DDK activity, 1 µM simurosertib (Selleck, #S8925) was added to the culture medium90.
Plasmids
All plasmids used in this study are listed in Supplementary Table 1.
Cell lines
All cell lines used in this study are listed in Supplementary Table 2. Cells were transfected using ViaFect (Promega, #E4982) with CRISPR and donor plasmids to tag endogenous proteins, as described previously91. All guide-RNA sequences are summarised in Supplementary Table 3. Genotypes were confirmed by genomic PCR, and the expression of fusion proteins was confirmed by Western blotting. A piggybac plasmid encoding RIF1 or TRESLIN-MTBP was transfected with plasmids expressing piggybac transposase or rtTA into parental cells. Subsequently, stable cells were selected using appropriate antibiotics.
Ligase-depletion Okazaki sequencing (LD-OK-seq)
LIG1/3-mAID cells were treated with 5-Ph-IAA-containing medium for 4 h before harvest for asynchronous LD-OK-seq. For time-course LD-OK-seq, LIG1/3-mAID cells were synchronised with nocodazole and released as shown in Supplementary Fig. 5a. Approximately 7 × 10⁶ cells were collected for each sample and processed to purify genomic DNA using Blood & Cell Culture DNA Midi Kit (QIAGEN, #13343) with 100/G Genomic-tips. To examine single-stranded Okazaki fragments, 30 µg of genomic DNA was mixed with 2×RNA loading dye (95% formamide, 0.02% SDS, 0.04% Orange G, 1 mM EDTA) and denatured at 70 °C for 10 min followed by 10 min incubation on ice. The DNA samples were loaded onto a 1% alkaline agarose gel and electrophoresed at 70 V at 4 °C for 45 min. Gels were neutralised in 1×TAE buffer for 30 min and then stained with SYBR Gold (Invitrogen, #S11494) for 1 h at room temperature. Single-stranded DNA ranging from 100 to 650 bp was excised from the gel, which was subsequently processed for ssDNA purification using NucleoSpin Gel and PCR Clean-up Kit (Takara, #740609) with NTC buffer (Takara, #U0654A). Quantification of ssDNA was performed using Quant-iT OliGreen ssDNA Assay Kit (Invitrogen, #O7582). To convert purified ssDNA to dsDNA, 50-100 ng of ssDNA in 30 µl was mixed with 5 µl of 10×NEBuffer 2 (NEB, #B7002S) and 5 µl of 3 mg/ml 8 N random primers (Eurofins). The mixture was incubated at 95 °C for 5 min followed by cooling on ice for 5 min, and then supplemented with 5 µl of 2 mM dNTP mix (without dTTP, Roche, #11969064001) plus dUTP (Roche, #11934554001), 2.5 µl of 5000 U/ml Klenow DNA polymerase (NEB, #M0210S), and nuclease-free H2O to a final volume of 50 µl. The supplemented mixture was incubated at 37 °C for 20 min. Reactions were stopped by adding 5 µl of 0.5 M EDTA. The dsDNA was purified using AMPure XP beads (Beckman Coulter, #A63881) and quantified with Quant-iT PicoGreen dsDNA Assay Kit (Invitrogen, #P7589) before proceeding to library preparation. Sequencing libraries were prepared using NEBNext Ultra II DNA Library Prep Kit for Illumina (NEB, #E7645S) according to the manufacturer’s instructions. Sequencing was performed using the Illumina NovaSeq 6000 platform with 100 bp paired-end reads for approximately 100 million read pairs per sample.
Flow cytometry
Trypsinised cells were washed once with a fresh medium and resuspended in 0.15 ml of ice-cold PBS. Cells were then fixed by adding 0.35 ml of ice-cold 100% ethanol dropwise while gently shaking. Fixed cells were stored at −20 °C overnight. After fixation, cells were washed once with PBS containing 1% BSA and resuspended in staining buffer (PBS, 1% BSA, 40 µg/ml propidium iodide, 50 µg/ml RNase A). Staining was performed at 37 °C for 30 min. Flow cytometry was performed using a BD Accuri C6 Cytometer.
Immunoblotting
To prepare whole cell extracts, cells were harvested by trypsinisation and washed twice with PBS. Cells were then resuspended in RIPA buffer (25 mM Tris-HCl, pH 7.5, 150 mM NaCl, 1% NP-40, 1% sodium deoxycholate, 0.1% SDS, and complete protease inhibitor cocktail (Roche, #11873580001)) and incubated for 30 min on ice. Samples were cleared by centrifugation at 18,400 × g at 4 °C for 10 min. The supernatant was collected, and an equal volume of 2× SDS sample buffer (Cosmo Bio, #423420) was added before denaturing proteins at 95 °C for 5 min. Proteins were separated in 7.5% or 10% TGX Stain-Free gel (BioRad) and transferred to nitrocellulose membranes (Cytiva, #10600003). Membranes were blocked with TBS-T containing 1% skim milk for 30 min and incubated with primary antibodies at 4 °C overnight. After washing three times with TBS-T, membranes were incubated with secondary antibodies at room temperature in the dark for 1 h. Immunoblot images were captured using the ChemiDoc Touch MP imaging system (BioRad), and quantification of signals was conducted using ImageJ2 (version 2.14.0). All antibodies used in this study are listed in Supplementary Table 4.
Preparation of soluble and chromatin-bound proteins
To separate soluble and chromatin-bound proteins, cells were collected by trypsinisation and washed twice with PBS. Subsequently, cells were resuspended in PBS containing 0.2% Triton X-100, and then pelleted by centrifugation at 845 × g at 4 °C for 2 min. The supernatant was collected as the soluble protein fraction. The cell pellet was washed once with PBS containing 0.2% Triton X-100. The chromatin-bound protein was extracted by adding RIPA buffer to the pellet. After incubation on ice for 30 min, the sample was centrifuged at 18,400 × g at 4 °C for 10 min. The supernatant (chromatin-bound protein fraction) was collected. An equal volume of 2×SDS sample buffer was added to each sample, which was subsequently boiled at 95 °C for 5 min to denature proteins.
RNA-seq
Total RNA was extracted from cells using illustra RNAspin columns (Cytiva, #25050071). Ribosomal RNA was removed using NEBNext rRNA Depletion Kit v2 (NEB, #E7405L). RNA libraries were prepared with NEBNext Ultra II Directional RNA Library Prep Kit for Illumina (NEB, #E7760S), following the manufacturer’s instructions. Sequencing was performed on the HiSeq 2500 platform with paired-end 50 bp reads to obtain at least 40 million read pairs per sample.
Chromatin immunoprecipitation sequencing (ChIP-seq)
For ChIP-seq of FLAG-fused proteins, 2 × 10⁷ cells were collected by trypsinisation and washed twice with 10 ml PBS. Cells were then resuspended in 1 ml PBS and crosslinked by adding an equal volume of freshly prepared 2% paraformaldehyde for 10 min at room temperature. Crosslinking was stopped by adding glycine to a final concentration of 125 mM and subsequently by incubating for 5 min at room temperature. Cells were sequentially washed with PBS, PBS containing 0.5% NP-40, and PBS containing 10% glycerol. After removing the supernatant, cell pellets were frozen in liquid nitrogen and stored at −80 °C or were processed immediately for cell lysis. Cell pellets were resuspended in 1 ml ChIP lysis buffer (25 mM HEPES pH 7.5, 140 mM NaCl, 1 mM EDTA, 0.5 mM EGTA, 0.5% Sarkosyl, 0.1% sodium deoxycholate, 0.5% Triton X-100, and complete protease inhibitor cocktail (Roche, #11873580001)), and suspended cells were incubated on ice for 10 min. Chromatin was fragmented using a Covaris S2 (Covaris, LLC) with a setting at 5% duty factor, 100 cycles per burst, and intensity at 3 for 10 min. The sonicated lysate was centrifuged twice at 18,400 × g at 4 °C for 15 min to remove insoluble materials. The supernatant was incubated with 1.5 µg of Protein G Dynabeads (Invitrogen, #10004D) at 4 °C for 1–2 h to remove non-specific binding proteins. The pre-cleared supernatant was centrifuged once more before immunoprecipitation to make an input sample. Two percent of the input sample (20 µl) was reserved and stored. The remaining input was incubated with Protein G Dynabeads pre-bound with 5 µg of anti-FLAG M2 antibody (Sigma, #F1804) at 4 °C overnight. Unbound proteins were removed, and the beads were washed sequentially with 1 ml RIPA buffer (50 mM Tris pH 8.0, 150 mM NaCl, 1 mM EDTA, 1% NP-40, 0.1% SDS, 0.5% sodium deoxycholate), 1 ml RIPA buffer containing 300 mM NaCl, 1 ml RIPA buffer containing 250 mM LiCl, and twice with TE buffer (10 mM Tris pH 8.0, 1 mM EDTA). Bound proteins were eluted by adding 90 µl of elution buffer (TE + 1% SDS) and subsequently by incubating at 65 °C for 10 min. The eluate was transferred to a new tube, and the elution process was repeated again. The eluates were combined (180 µl), and 10 µl was set aside for Western blot analysis. The input sample was thawed and mixed with 150 µl of elution buffer. Both the eluates and input samples were treated with 20 µg RNase A (Nacalai Tesque, #30142-04) at 37 °C for 1 h, followed by the addition of 40 µg Proteinase K (Merck, #124568). Protein-DNA crosslinking was reversed at 65 °C for 4 h. DNA was purified using NucleoSpin Gel and PCR Clean-up Kit (Takara, #740609) with NTB buffer (Takara, #740595). Purified DNA was quantified using Quant-iT PicoGreen dsDNA Assay Kit (Invitrogen, #P7589). NGS libraries were prepared from 5 to 10 ng DNA using the NEBNext Ultra II DNA Library Prep Kit for Illumina (NEB, #E7645S), following the manufacturer’s instructions. Sequencing was performed on the Illumina NovaSeq 6000 platform with 50 bp paired-end reads to obtain approximately 100 million read pairs per sample.
Cell proliferation assay
On day 0, 2.5 × 10⁵ cells were seeded in a 6-well plate and cultured in a medium containing 1 µg/ml doxycycline (Supplementary Fig. 12e). Every two days, the total cell number was counted, and cells were re-seeded into a new 6-well plate at a 1:5 dilution in a fresh medium containing doxycycline. Three independent experiments were conducted to ensure the reproducibility.
Immunoprecipitation
Approximately 2 × 10⁷ cells were harvested and lysed in 1 ml of IP lysis buffer (20 mM HEPES pH 7.5, 150 mM NaCl, 1 mM EDTA, 0.5% NP-40, 5% glycerol, 3 mM MgCl2, 100 U benzonase (Millipore, #70746), complete protease inhibitor cocktail (Roche, #11873580001), and phosphatase inhibitor cocktail (Roche, #490684500)) at 10 °C for 30 min. The lysate was centrifuged twice at 18,400 × g at 4 °C for 15 min to remove insoluble debris, followed by a pre-clearing step with 0.75 mg of Protein G Dynabeads (Invitrogen, #10004D) at 4 °C for 1 h. Pre-cleared lysate was incubated with 1.5 µg of Protein G Dynabeads pre-bound with anti-FLAG M2 antibody (Sigma, #F1804) at 4 °C for 2 h. Beads were washed twice with 1 ml of IP wash buffer (20 mM HEPES, pH 7.5, 150 mM NaCl, 1 mM EDTA, 0.5% NP-40, 5% glycerol, complete protease inhibitor cocktail, and phosphatase inhibitor cocktail). Bound proteins were eluted with 1×SDS sample buffer at 95 °C for 5 min.
Sequencing of TRESLIN-bound DNA after immunoprecipitation
Immunoprecipitation was carried out as described above. Bound DNA was eluated twice by adding 90 µl of elution buffer (TE + 1% SDS) and subsequently by incubating at 45 °C for 10 min. The combined eluate was treated with 20 µg RNase A at 37 °C for 1 h, followed by treatment with 40 µg Proteinase K at 50 °C for 2 h. DNA was purified using NucleoSpin Gel and PCR Clean-up Kit and quantified. NGS libraries were prepared from 2 ng of DNA using NEBNext Ultra II DNA Library Prep Kit for Illumina, and 50 bp paired-end sequencing was performed on the Illumina NovaSeq 6000 platform.
Live-cell imaging
HCT116 cells expressing mClover-tagged RIF1 and mCherry-tagged PCNA were seeded on a 35 mm glass-bottom dish and cultured for 48 h in a CO2 cell incubator. For live-cell imaging, the dish was placed in a Stage Top Incubator (Tokai Hit, STX series) mounted on an ECLIPSE Ti2 inverted microscope (Nikon) equipped with the Nikon AX confocal system. Confocal images were acquired at 30-min intervals over 24 h using an Apochromat TIRF 60×/1.49 oil objective (Nikon). Images were initially processed using NIS-Elements software (Nikon), and selected cells were cropped using ImageJ2 (version 2.14.0).
LD-OK-seq data processing
Raw sequencing reads (FASTQ) were initially quality-checked using FastQC (v0.11.9). Data was processed using Trim Galore (v0.6.6) to remove Illumina sequencing adapters (AGATCGGAAGAGC) with the ‘–illumina’ parameter, and 10 bp were trimmed from the 5’ end of both read pairs using the parameters ‘–clip_R1 10’ and ‘–clip_R2 10’. Cleaned reads were aligned to the GRCh38 (NCBI) reference genome using Bowtie2 (v2.2.5) with parameters: –end-to-end –very-sensitive –no-mixed –no-discordant -I 0 -X 1000. The resulting alignments were converted to BAM format and filtered using SAMtools (v1.12) ‘view’ with three criteria: mapping quality score MAPQ ≥ 20 (-q 20), proper pair mapping (-f 0 × 2), and removal of unmapped reads (-F 0 × 4). PCR duplicates were marked and removed using SAMtools ‘sort’, ‘fixmate’, and ‘markdup’ functions. Filtered reads were separated by strand orientation using SAMtools ‘view’: Crick strand reads were captured using flags ‘-f 128 -F 16’ and ‘-f 64 -F 32’, while Watson strand reads were captured using flags ‘-f 144’ and ‘-f 96’. Read coverage was calculated in 1 kb genomic bins using BEDtools (v2.30.0) ‘intersect’. Raw bin counts were normalised by sequencing depth using a custom R function (norm.by.depth, available on GitHub, see ‘Code availability’) and converted to bigWig format using bedGraphToBigWig (v2.8).
Selection of initiation zones
Initiation zones (IZs) were identified using OKseqHMM48 with customised parameters (thresh = 10, winS = 25, binSize = 1000, and quant = NA) applied to deduplicated BAM files. This analysis simultaneously generated replication fork directionality (RFD) scores. Firing efficiency was quantified as a ΔRFD score using a custom R function (calculate_delta_RFD, available on GitHub, see ‘Code availability’). For each IZ segment, RFDstart and RFDend values were calculated as the mean RFD of 5 consecutive bins, centered on the leftmost and rightmost bins, respectively. The final ΔRFD was computed as:
$$Delta {{{rm{RFD}}}}=({{{{rm{RFD}}}}}_{{{{rm{end}}}}}-{{{{rm{RFD}}}}}_{{{{rm{start}}}}})/2.$$
For LD-OK-seq experiments with asynchronous cells, IZs with ΔRFD > 0.15 were classified as high-confident predictions. The final IZ set comprised regions that were confidently predicted in both the merged dataset and at least one of two experimental replicates. For time-course LD-OK-seq experiments with synchronised cells, the confidence threshold was set to ΔRFD > 0.1. The genome was divided into 100 kb bins and classified into five replication timing (RT) domains of equal size using E/L Repli-seq data (GSE186206)92: Early, early-to-mid (EtoM), middle (Mid), mid-to-late (MtoL), and late (Late). The initiation timing of IZs was assigned based on the collection timepoint and corresponding RT domains.
Principal component analysis (PCA) analysis
To compare our LD-OK-seq data with other published mapping data, we computed genome-wide ΔRFD scores for LD-OK-seq, OK-seq, and GLOE-seq datasets using a custom R function (delta.score, available on GitHub, see ‘Code availability’). For each 1 kb bin in the genome, ΔRFD was computed within a 20 kb window (10 kb upstream and 10 kb downstream from the bin). Negative values were converted to 0 as they represented relative termination efficiencies, which many techniques don’t measure. We obtained and reprocessed multiple published datasets: OK-seq data from HeLa MRL2 cells (SRP065949)24, OK-seq data from HeLa S3 cells (GSE193547)48, and GLOE-seq data from HCT116 cells (GSE134225)26 were processed following our LD-OK-seq analysis procedure; Pu-seq data was obtained from GSE18966828, with negative initiation index values converted to 0; EdUseq-HU data from HeLa and U2OS cells was downloaded from PRJNA39712354 and reprocessed; SNS-seq data from HCT116 was obtained from GSE2891193 and GSE17345194 and reprocessed; and G4-seq data from HCT116 was downloaded from GSE23969295 and reprocessed. Principal component analysis (PCA) was performed using R.
RNA-seq data processing
Raw FASTQ data quality was assessed using FastQC, followed by Illumina adapter removal using Trim Galore with default settings. Clean reads were aligned to the GRCh38 reference genome using HISAT2 (v2.2.1) with parameters ‘–no-mixed –no-discordant –rna-strandness RF’. The aligned reads were converted to BAM format and filtered using the same criteria as in the LD-OK-seq data processing. Read counts per transcript were quantified from the filtered BAM files using featureCounts (v2.0.6) with options ‘-s 2 -F GTF -g gene_id -t exon -B -C -p -countReadPairs’, which enables strand-specific counting while treating each read pair as a single fragment. The annotation GTF file was obtained from the NCBI MANE (Matched Annotation from NCBI and EMBL-EBI) project96 and filtered to include only protein-coding genes. Raw read counts were normalised to transcripts per million (TPM) using a custom R script (available on GitHub, see ‘Code availability’). Gene expression levels between WT and RIF1-KO cells were compared using scatter plots of log2-transformed TPM values.
ChIP-seq data processing
Raw FASTQ reads were processed using Trim Galore with default parameters to remove adapter sequences. The trimmed reads were then aligned to the GRCh38 reference genome using Bowtie2, applying the same parameters used for LD-OK-seq data processing. After alignment, reads were filtered, and PCR duplicates were removed using SAMtools. Signal track generation was performed using MACS2 (v2.2.7.1) to produce treatment (ChIP DNA) and control (Input) bedGraph files, which were subsequently converted to bigWig format using bedGraphToBigWig. Finally, ChIP signals were normalised against input using deepTools (v3.5.5) ‘bigwigCompare’ with the following parameters: –operation ratio –pseudocount 0 -bs 100. This normalisation process divided the genome into 100 bp bins and calculated the ChIP/Input ratio within each bin. The input-normalised signal was used to generate all plots in this study. Published datasets used in this study were re-processed using the same pipeline.
Correlation analysis
Genome-wide correlation analysis between multiple ChIP-seq datasets was performed using deepTools. Signals within 50 kb genomic bins were computed using ‘multiBigwigSummary’, and correlation heatmaps were generated using ‘plotCorrelation’ with Pearson correlation coefficients. Histone modification and ATAC-seq data were obtained from the ENCODE project (H3K27me3: ENCSR810BDB, H3K79me2: ENCSR494CCN, H3K36me3: ENCSR000FCQ, H3K27ac: ENCSR000EUT, H3K4me3: ENCSR000DTQ, H3K4me1: ENCSR000EUS, H3K9me3: ENCSR000FCP, ATAC-seq: ENCSR872WGW). H2A.Z ChIP-seq data were downloaded from GSE5863897 and processed from raw FASTQ reads following the ChIP-seq analysis pipeline described above.
Statistics and reproducibility
For Fig. 1d and Supplementary Fig. 6d, Pearson’s correlation coefficient and corresponding p-values were calculated using R. For Supplementary Fig. 7b, Cohen’s d effect sizes were determined in R. For Supplementary Fig. 12e, Student’s t-test was conducted using GraphPad Prism (v8.4.3). Experimental reproducibility was assessed with the following experimental replicates: asynchronous LD-OK-seq in Fig. 1 (WT and ATRi-treated conditions), two replicates; asynchronous RIF1-KO LD-OK-seq in Supplementary Fig. 6a, two replicates; RNA-seq of WT and RIF1-KO cells in Supplementary Fig. 6d, three replicates; MCM2 ChIP-seq in Supplementary Fig. 8c, two replicates.
Reporting summary
Further information on research design is available in the Nature Portfolio Reporting Summary linked to this article.
Data availability
The data generated in this study have been deposited in the Gene Expression Omnibus (GEO) database under the accession numbers GSE293195 (ChIP-seq), GSE293196 (TRESLIN IP-seq), GSE293198 (LD-OK-seq), and GSE293200 (RNA-seq). Sources of published datasets used in each analysis are mentioned above. Additional published datasets used in this study include: High-resolution Repli-seq data GSE13776425, H3K9ac ChIP-seq data ENCSR093SHE, ORC1 ChIP-seq data from Dellino et al.: GSE3758318, ORC2 ChIP-seq data from Miotto et al.: GSE7016519, MCM7 ChIP-seq data from Sugimoto et al.: GSE10724821, ORC2 and MCM5 ChIP-seq data from Liu et al.: GSE17468023, ORC2, ORC3, MCM3 and MCM7 ChIP-seq data from Kirstein et al.: PRJEB3285520, MCM-DH mapping data from Li et al.: GSE20206661, TRESLIN CUT&RUN data from Noble et al.: GSE27446469, and TRESLIN ChIP-seq data from Thakur et al.: GSE27685670. Source data are provided with this paper.
Code availability
Custom code and scripts used for data analysis in this study are available on GitHub (https://github.com/Kanemaki-Lab/TRESLIN_and_MTBP_paper). Scripts for running OKseqHMM (v2.0.0) have been downloaded from GitHub (https://github.com/CL-CHEN-Lab/OK-Seq).
References
-
Bleichert, F., Botchan, M. R. & Berger, J. M. Mechanisms for initiating cellular DNA replication. Science 355, eaah6317 (2017).
-
Costa, A. & Diffley, J. F. X. The initiation of eukaryotic DNA replication. Annu. Rev. Biochem. 91, 107–131 (2022).
-
Zhu, X. & Kanemaki, M. T. Replication initiation sites and zones in the mammalian genome: Where are they located and how are they defined? DNA Repair 141, 103713 (2024).
-
Fernández-Cid, A. et al. An ORC/Cdc6/MCM2-7 complex is formed in a multistep reaction to serve as a platform for MCM double-hexamer assembly. Mol. cell 50, 577–588 (2013).
-
Yeeles, J. T. P., Deegan, T. D., Janska, A., Early, A. & Diffley, J. F. X. Regulated eukaryotic DNA replication origin firing with purified proteins. Nature 519, 431–435 (2015).
-
Miller, T. C. R., Locke, J., Greiwe, J. F., Diffley, J. F. X. & Costa, A. Mechanism of head-to-head MCM double-hexamer formation revealed by cryo-EM. Nature 575, 704–710 (2019).
-
Weissmann, F. et al. MCM double hexamer loading visualized with human proteins. Nature 636, 499–508 (2024).
-
Yang, R., Hunker, O., Wise, M. & Bleichert, F. Multiple mechanisms for licensing human replication origins. Nature 636, 488–498 (2024).
-
Kumagai, A., Shevchenko, A., Shevchenko, A. & Dunphy, W. G. Treslin collaborates with TopBP1 in triggering the initiation of DNA replication. Cell 140, 349–359 (2010).
-
Sansam, C. L. et al. A vertebrate gene, ticrr, is an essential checkpoint and replication regulator. Genes Dev. 24, 183–194 (2010).
-
Boos, D., Yekezare, M. & Diffley, J. F. Identification of a heteromeric complex that promotes DNA replication origin firing in human cells. Science 340, 981–984 (2013).
-
Hu, Y. et al. Evolution of DNA replication origin specification and gene silencing mechanisms. Nat. Commun. 11, 5175 (2020).
-
Lee, C. S. K. et al. Humanizing the yeast origin recognition complex. Nat. Commun. 12, 33 (2021).
-
Wyrick, J. J. et al. Genome-wide distribution of ORC and MCM proteins in S. cerevisiae: high-resolution mapping of replication origins. Science 294, 2357–2360 (2001).
-
Foss, E. J. et al. Chromosomal Mcm2-7 distribution and the genome replication program in species from yeast to humans. PLoS Genet. 17, e1009714 (2021).
-
Vashee, S. et al. Sequence-independent DNA binding and replication initiation by the human origin recognition complex. Gene Dev. 17, 1894–1908 (2003).
-
MacAlpine, H. K., Gordân, R., Powell, S. K., Hartemink, A. J. & MacAlpine, D. M. Drosophila ORC localizes to open chromatin and marks sites of cohesin complex loading. Genome Res 20, 201–211 (2010).
-
Dellino, G. I. et al. Genome-wide mapping of human DNA-replication origins: levels of transcription at ORC1 sites regulate origin selection and replication timing. Genome Res. 23, 1–11 (2013).
-
Miotto, B., Ji, Z. & Struhl, K. Selectivity of ORC binding sites and the relation to replication timing, fragile sites, and deletions in cancers. Proc. Natl. Acad. Sci. USA 113, E4810–E4819 (2016).
-
Kirstein, N. et al. Human ORC/MCM density is low in active genes and correlates with replication time but does not delimit initiation zones. Elife 10, e62161 (2021).
-
Sugimoto, N., Maehara, K., Yoshida, K., Ohkawa, Y. & Fujita, M. Genome-wide analysis of the spatiotemporal regulation of firing and dormant replication origins in human cells. Nucleic Acids Res 46, gky476 (2018).
-
Hayashi-Takanaka, Y. et al. Chromatin loading of MCM hexamers is associated with di-/tri-methylation of histone H4K20 toward S phase entry. Nucleic Acids Res. 49, gkab1068 (2021).
-
Liu, Y. et al. Transcription shapes DNA replication initiation to preserve genome integrity. Genome Biol. 22, 176 (2021).
-
Petryk, N. et al. Replication landscape of the human genome. Nat. Commun. 7, 10208 (2016).
-
Zhao, P. A., Sasaki, T. & Gilbert, D. M. High-resolution Repli-Seq defines the temporal choreography of initiation, elongation and termination of replication in mammalian cells. Genome Biol. 21, 76 (2020).
-
Sriramachandran, A. M. et al. Genome-wide Nucleotide-Resolution Mapping of DNA Replication Patterns, Single-Strand Breaks, and Lesions by GLOE-Seq. Mol. Cell 78, 975–985.e7 (2020).
-
Wang, W. et al. Genome-wide mapping of human DNA replication by optical replication mapping supports a stochastic model of eukaryotic replication. Mol. Cell 81, 2975–2988.e6 (2021).
-
Koyanagi, E. et al. Global landscape of replicative DNA polymerase usage in the human genome. Nat. Commun. 13, 7221 (2022).
-
Rhind, N. DNA replication timing: biochemical mechanisms and biological significance. BioEssays 44, e2200097 (2022).
-
Rhind, N. & Gilbert, D. M. DNA replication timing. Csh Perspect. Biol. 5, a010132 (2013).
-
Rhind, N. DNA replication timing: random thoughts about origin firing. Nat. cell Biol. 8, 1313–1316 (2006).
-
Tanaka, S., Nakato, R., Katou, Y., Shirahige, K. & Araki, H. Origin association of Sld3, Sld7, and Cdc45 proteins is a key step for determination of origin-firing timing. Curr. Biol. 21, 2055–2063 (2011).
-
Mantiero, D., Mackenzie, A., Donaldson, A. & Zegerman, P. Limiting replication initiation factors execute the temporal programme of origin firing in budding yeast. EMBO J. 30, 4805–4814 (2011).
-
Sheu, Y.-J. J. & Stillman, B. The Dbf4-Cdc7 kinase promotes S phase by alleviating an inhibitory activity in Mcm4. Nature 463, 113–117 (2010).
-
Deegan, T. D., Yeeles, J. T. & Diffley, J. F. Phosphopeptide binding by Sld3 links Dbf4-dependent kinase to MCM replicative helicase activation. EMBO J. 35, 961–973 (2016).
-
Fang, D., Cao, Q. & Lou, H. Sld3-MCM Interaction Facilitated by Dbf4-Dependent Kinase Defines an Essential Step in Eukaryotic DNA Replication Initiation. Front. Microbiol. 7, 885 (2016).
-
Hayano, M. et al. Rif1 is a global regulator of timing of replication origin firing in fission yeast. Genes Dev. 26, 137–150 (2012).
-
Hiraga, S.-I. et al. Rif1 controls DNA replication by directing Protein Phosphatase 1 to reverse Cdc7-mediated phosphorylation of the MCM complex. Genes Dev. 28, 372–383 (2014).
-
Mattarocci, S. et al. Rif1 controls DNA replication timing in yeast through the PP1 phosphatase Glc7. Cell Rep. 7, 62–69 (2014).
-
Cornacchia, D. et al. Mouse Rif1 is a key regulator of the replication-timing programme in mammalian cells. EMBO J. 31, 3678–3690 (2012).
-
Yamazaki, S. et al. Rif1 regulates the replication timing domains on the human genome. EMBO J. 31, 3667–3677 (2012).
-
Foti, R. et al. Nuclear architecture organized by Rif1 underpins the replication-timing program. Mol. Cell 61, 260–273 (2016).
-
Klein, K. N. et al. Replication timing maintains the global epigenetic state in human cells. Science 372, 371–378 (2021).
-
Gnan, S. et al. Nuclear organisation and replication timing are coupled through RIF1–PP1 interaction. Nat. Commun. 12, 2910 (2021).
-
Smith, D. J. & Whitehouse, I. Intrinsic coupling of lagging-strand synthesis to chromatin assembly. Nature 483, 434–438 (2012).
-
Yesbolatova, A. et al. The auxin-inducible degron 2 technology provides sharp degradation control in yeast, mammalian cells, and mice. Nat. Commun. 11, 5701 (2020).
-
Arakawa, H. et al. Functional redundancy between DNA ligases I and III in DNA replication in vertebrate cells. Nucleic Acids Res. 40, 2599–2610 (2011).
-
Liu, Y., Wu, X., d’Aubenton-Carafa, Y., Thermes, C. & Chen, C.-L. OKseqHMM: a genome-wide replication fork directionality analysis toolkit. Nucleic Acids Res. 51, e22–e22 (2023).
-
Weinert, T. A. & Hartwell, L. H. Cell cycle arrest of cdc mutants and specificity of the RAD9 checkpoint. Genetics 134, 63–80 (1993).
-
Zegerman, P. & Diffley, J. F. Checkpoint-dependent inhibition of DNA replication initiation by Sld3 and Dbf4 phosphorylation. Nature 467, 474–478 (2010).
-
Cayrou, C. et al. Genome-scale analysis of metazoan replication origins reveals their organization in specific but flexible sites defined by conserved features. Genome Res. 21, 1438–1449 (2011).
-
Martin, M. M. et al. Genome-wide depletion of replication initiation events in highly transcribed regions. Genome Res. 21, 1822–1832 (2011).
-
Langley, A. R., Gräf, S., Smith, J. C. & Krude, T. Genome-wide identification and characterisation of human DNA replication origins by initiation site sequencing (ini-seq). Nucleic Acids Res. 44, 10230–10247 (2016).
-
Macheret, M. & Halazonetis, T. D. Intragenic origins due to short G1 phases underlie oncogene-induced DNA replication stress. Nature 555, 112–116 (2018).
-
Carrington, J. T. et al. Most human DNA replication initiation is dispersed throughout the genome with only a minority within previously identified initiation zones. Genome Biol. 26, 122 (2025).
-
Kuo, A. J. et al. ORC1 BAH domain links H4K20me2 to DNA replication licensing and Meier-Gorlin syndrome. Nature 484, 115–119 (2012).
-
Cayrou, C. et al. The chromatin environment shapes DNA replication origin organization and defines origin classes. Genome Res. 25, 1873–1885 (2015).
-
Smith, O. K. et al. Distinct epigenetic features of differentiation-regulated replication origins. Epigenetic Chromatin 9, 18 (2016).
-
Long, H. et al. H2A.Z facilitates licensing and activation of early replication origins. Nature 577, 576–581 (2020).
-
Isobe, S.-Y. et al. Protein phosphatase 1 acts as a RIF1 effector to suppress DSB resection prior to Shieldin action. Cell Rep. 36, 109383 (2021).
-
Li, J. et al. The human pre-replication complex is an open complex. Cell 186, 98–111.e21 (2023).
-
Bond, A. G. et al. Development of BromoTag: A “Bump-and-Hole”–PROTAC system to induce potent, rapid, and selective degradation of tagged target proteins. J. Med. Chem. 64, 15477–15502 (2021).
-
Powell, S. K. et al. Dynamic loading and redistribution of the Mcm2-7 helicase complex through the cell cycle. EMBO J. 34, 531–543 (2015).
-
Bekker-Jensen, D. B. et al. An optimized shotgun strategy for the rapid generation of comprehensive human proteomes. Cell Syst. 4, 587–599.e4 (2017).
-
Brenes, A. J., Lamond, A. I. & Cantrell, D. A. The immunological proteome resource. Nat. Immunol. 24, 731 (2023).
-
Wittig, K. A., Sansam, C. G., Noble, T. D., Goins, D. & Sansam, C. L. The CRL4DTL E3 ligase induces degradation of the DNA replication initiation factor TICRR/TRESLIN specifically during S phase. Nucleic Acids Res. 49, 10507–10523 (2021).
-
Kumagai, A. & Dunphy, W. G. Binding of the treslin-MTBP complex to specific regions of the human genome promotes the initiation of DNA replication. Cell Rep. 32, 108178 (2020).
-
Zonderland, G. et al. The TRESLIN-MTBP complex couples completion of DNA replication with S/G2 transition. Mol. Cell 82, 3350–3365.e7 (2022).
-
Noble, T. D., Sansam, C. G., Wittig, K. A., Majchrzycka, B. & Sansam, C. L. Cell cycle-dependent TICRR/TRESLIN and MTBP chromatin binding mechanisms and patterns. Genome Biol. 26, 194 (2025).
-
Thakur, B. L. et al. Selective interactions at pre-replication complexes categorize baseline and dormant origins. Nat. Commun. 16, 4140 (2025).
-
Yeeles, J. T., Deegan, T. D., Janska, A., Early, A. & Diffley, J. F. Regulated eukaryotic DNA replication origin firing with purified proteins. Nature 0, 431–435 (2015).
-
Alver, R. C., Chadha, G. S., Gillespie, P. J. & Blow, J. J. Reversal of DDK-mediated MCM phosphorylation by Rif1-PP1 regulates replication initiation and replisome stability independently of ATR/Chk1. Cell Rep. 18, 2508–2520 (2017).
-
Hiraga, S. et al. Human RIF1 and protein phosphatase 1 stimulate DNA replication origin licensing but suppress origin activation. Embo Rep. 18, 403–419 (2017).
-
Volpi, I., Gillespie, P. J., Chadha, G. S. & Blow, J. J. The role of DDK and Treslin–MTBP in coordinating replication licensing and pre-initiation complex formation. Open Biol. 11, 210121 (2021).
-
Arbona, J.-M. et al. Neural network and kinetic modelling of human genome replication reveal replication origin locations and strengths. PLoS Comput. Biol. 19, e1011138 (2023).
-
Tian, M. et al. Integrative analysis of DNA replication origins and ORC/MCM binding sites in human cells reveals a lack of overlap. eLife 12, RP89548 (2024).
-
Cho, C.-Y., Seller, C. A. & O’Farrell, P. H. Temporal control of late replication and coordination of origin firing by self-stabilizing Rif1-PP1 hubs in Drosophila. Proc. Natl. Acad. Sci. USA 119, e2200780119 (2022).
-
Sansam, C. G. et al. A mechanism for epigenetic control of DNA replication. Gene Dev. 32, 224–229 (2018).
-
Saldivar, J. C. et al. An intrinsic S/G2 checkpoint enforced by ATR. Science 361, 806–810 (2018).
-
Dileep, V. & Gilbert, D. M. Single-cell replication profiling to measure stochastic variation in mammalian replication timing. Nat. Commun. 9, 427 (2018).
-
Takahashi, S. et al. Genome-wide stability of the DNA replication program in single mammalian cells. Nat. Genet. 51, 529–540 (2019).
-
Bertolin, A. P. et al. The DNA replication checkpoint prevents PCNA/RFC depletion to protect forks from HLTF-induced collapse in human cells. Mol. Cell 85, 2474–2486.e6 (2025).
-
Canal, B. et al. The DNA replication checkpoint limits Okazaki fragment accumulation to protect and restart stalled forks. Mol. Cell 85, 2462–2473.e6 (2025).
-
Morafraile, E. C. et al. Checkpoint inhibition of origin firing prevents DNA topological stress. Genes Dev. 33, 1539–1554 (2019).
-
Buonomo, S. B. C., Wu, Y., Ferguson, D. & Lange, T. de. Mammalian Rif1 contributes to replication stress survival and homology-directed repair. J. Cell Biol. 187, 385–398 (2009).
-
MacAlpine, D. M., Rodríguez, H. K. & Bell, S. P. Coordination of replication and transcription along a Drosophila chromosome. Genes Dev. 18, 3094–3105 (2004).
-
Pourkarimi, E., Bellush, J. M. & Whitehouse, I. Spatiotemporal coupling and decoupling of gene transcription with DNA replication origins during embryogenesis in C. elegans. eLife 5, e21728 (2016).
-
Kumagai, A., Shevchenko, A., Shevchenko, A. & Dunphy, W. G. Direct regulation of Treslin by cyclin-dependent kinase is essential for the onset of DNA replication. J. Cell Biol. 193, 995–1007 (2011).
-
Sansam, C. G., Goins, D., Siefert, J. C., Clowdus, E. A. & Sansam, C. L. Cyclin-dependent kinase regulates the length of S phase through TICRR/TRESLIN phosphorylation. Genes Dev. 29, 555–566 (2015).
-
Iwai, K. et al. Molecular mechanism and potential target indication of TAK-931, a novel CDC7-selective inhibitor. Sci. Adv. 5, eaav3660 (2019).
-
Saito, Y. & Kanemaki, M. T. Targeted protein depletion using the auxin-inducible degron 2 (AID2) system. Curr. Protoc. 1, e219 (2021).
-
van Schaik, T. et al. Dynamic chromosomal interactions and control of heterochromatin positioning by Ki-67. EMBO Rep. 23, e55782 (2022).
-
Fu, H. et al. The DNA repair endonuclease Mus81 facilitates fast DNA replication in the absence of exogenous damage. Nat. Commun. 6, 6746 (2015).
-
Mas, A. M. et al. ORC1 binds to cis-transcribed RNAs for efficient activation of replication origins. Nat. Commun. 14, 4447 (2023).
-
Liang, H. et al. G-quadruplexes on chromosomal DNA negatively regulates topoisomerase 1 activity. Nucleic Acids Res. 52, 2142–2156 (2024).
-
Morales, J. et al. A joint NCBI and EMBL-EBI transcript set for clinical genomics and research. Nature 604, 310–315 (2022).
-
Lay, F. D. et al. The role of DNA methylation in directing the functional organization of the cancer epigenome. Genome Res. 25, 467–477 (2015).
Acknowledgements
We thank all members of the Kanemaki laboratory for discussion and support. We also thank Hiroyuki Araki (National Institute of Genetics) for his valuable comments on the manuscript. X.Z. was a NIG Postdoctoral Fellow, A.B. is a MEXT Scholarship Fellow, and YH was a JSPS Research Fellow for Young Scientists (DC2). C.C. received a JSPS Invitational Fellowship for Research in Japan. This work was supported by JSPS KAKENHI grant (JP23H02463), JST FOREST programme (JPMJFR204X), and Vehicle Racing Commemorative Foundation grant to Y.D.; by JSPS KAKENHI grants (JP21H04719, JP23H04925, JP25H00979, and JP22H04925 (PAGS)), JST CREST grant (JPMJCR21E6) to M.T.K.; and by AMED ASPIRE grant (JP25jf0126015) to Y.D. and M.T.K.
Ethics declarations
Competing interests
The authors declare no competing interests.
Peer review
Peer review information
Nature Communications thanks the anonymous reviewer(s) for their contribution to the peer review of this work. A peer review file is available.
Additional information
Publisher’s note Springer Nature remains neutral with regard to jurisdictional claims in published maps and institutional affiliations.
Supplementary information
Source data
Rights and permissions
Open Access This article is licensed under a Creative Commons Attribution-NonCommercial-NoDerivatives 4.0 International License, which permits any non-commercial use, sharing, distribution and reproduction in any medium or format, as long as you give appropriate credit to the original author(s) and the source, provide a link to the Creative Commons licence, and indicate if you modified the licensed material. You do not have permission under this licence to share adapted material derived from this article or parts of it. The images or other third party material in this article are included in the article’s Creative Commons licence, unless indicated otherwise in a credit line to the material. If material is not included in the article’s Creative Commons licence and your intended use is not permitted by statutory regulation or exceeds the permitted use, you will need to obtain permission directly from the copyright holder. To view a copy of this licence, visit http://creativecommons.org/licenses/by-nc-nd/4.0/.
About this article

Cite this article
Zhu, X., Bektash, A., Hatoyama, Y. et al. Regulated TRESLIN-MTBP loading governs initiation zones and replication timing in human DNA replication. Nat Commun 16, 10069 (2025). https://doi.org/10.1038/s41467-025-66278-7
-
Received:
-
Accepted:
-
Published:
-
Version of record:
-
DOI: https://doi.org/10.1038/s41467-025-66278-7