
Main
The RNA-targeting CRISPR effector protein Cas13 holds promise for numerous applications, such as RNA targeting, detection, editing and imaging1,2,3,4,5,6,7. Cas13 is activated by the hybridization of a CRISPR RNA (crRNA) spacer sequence to a complementary region in a target RNA (the protospacer)1,8. Once activated, Cas13 cleaves both the target RNA (cis-cleavage) and other RNAs in solution (trans-cleavage)1,2,3,9. However, the biophysical process by which the Cas13–crRNA complex binds to and is activated by a target RNA is poorly understood.
Determining the mechanism of Cas13 activation would solve several challenges. First, even with perfect complementarity between crRNA and protospacer, Cas13 activity levels can vary by several orders of magnitude10,11,12. While the specifics of the crRNA and target sequences including spacer length, nucleotide sequence and crRNA/protospacer mismatches are known to affect Cas13 activity, much of this variation remains unaccounted for10,11,12. RNA structure may explain this variation, as, unlike the CRISPR effector proteins Cas9 and Cas12, Cas13 is believed to be incapable of unwinding structured targets8,13. Models including only sequence effects while excluding structural effects have had success with a binary classification of active versus inactive crRNAs but have not been able to solve the regression problem of quantitatively predicting Cas13 activity from the crRNA sequence10,11,14. Second, although Cas13 activation requires crRNA–protospacer complementarity, Cas13 is frequently activated to a similar or even greater degree in the presence of single mismatches12,15,16. Addressing these challenges can lead to a sea change in diagnostic applications of Cas13, including for somatic mutation detection and for emerging pathogen surveillance. We hypothesized that these two poorly understood characteristics of Cas13 could be addressed by studying the activation of Cas13 in more detail using structured RNAs as a model system.
RNA molecules form intramolecular base pairs (secondary structures) that compete with intermolecular RNA–RNA interactions. We sought to explore how this competition affects the crRNA–target interactions underlying Cas13 activation. RNA secondary structure has long been suspected to influence Cas13 activity because of its competition with the crRNA for target base pairing but this has been challenging to study in isolation, as primary sequence and secondary structure are inextricably linked17. Previous studies showed a negative correlation between secondary structure and Cas13 activity when targeting endogenous RNAs2,18. However, by focusing on natural RNAs, these studies were unable to distinguish between effects on Cas13 caused by changes to target structure and those caused by changes to target sequence. Thus, the degree to which the RNA structure affects crRNA–target binding and Cas13 activity remains unclear.
Results
RNA structure reduces LwaCas13a activity
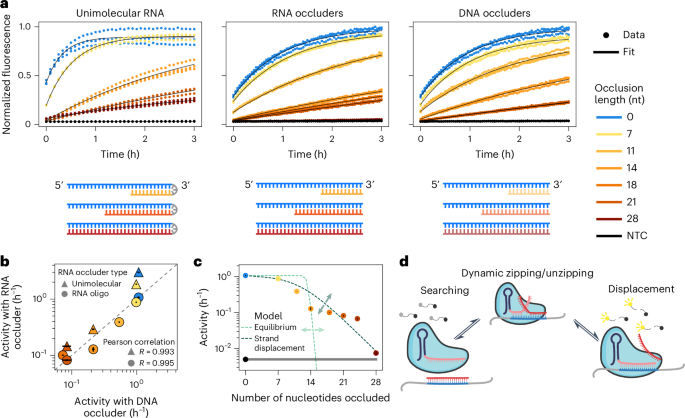
To isolate the effect of RNA structure on Cas13 activity, we designed a single-stranded RNA (ssRNA) protospacer sequence to which we could add variable amounts of secondary structure through intramolecular extension of an RNA hairpin or by adding external complementary RNA or DNA oligonucleotides of different lengths, termed ‘occluders’ (Fig. 1a and Extended Data Fig. 1). We designed the protospacer to reflect the viral sequence diversity that we used to train ADAPT10 and to have minimal secondary structure (Methods). We tested the ability of these structured protospacers to activate LwaCas13a using cleavage of a quenched fluorescent RNA to report activity. Increased secondary structure decreased Cas13 activity across all three assay conditions (Fig. 1a). We next quantified Cas13 activity by fitting the fluorescence curves to effectively first-order reaction equations, defining activity as the rate of reporter cleavage (h−1), a proxy for the concentration of active Cas13 in the system (Methods). We observed a high degree of correlation among the three types of target occlusion (Fig. 1b). Cas13 activity varied by an order of magnitude for the same sequence with different amounts of target occlusion (Fig. 1c). We furthermore saw similar variation in activity as a result of RNA structure for the Cas13 orthologs LbuCas13a and RfxCas13d, as well as for LwaCas13a with a spacer sequence of length 21 nt (Extended Data Fig. 2), demonstrating the generality of occlusion effects.

a, Different amounts of structure were introduced into the target through intramolecular structure, RNA oligos (occluders) and DNA occluders. The resulting fluorescence kinetic curves are shown. Target input concentration: 7.5 × 10⁸ cp per μl. Data from n = 3 technical replicates are shown (dots). b, Scatter plot comparing the impact of the different occlusion types depicted in a on Cas13 activity (x axis, Cas13 activity when occluded by DNA oligos; y axis, Cas13 activity when occluded by intramolecular RNA or RNA occluders). c, Cas13 activity versus occluder length for RNA occluders compared to two models: an equilibrium model based on crRNA–target hybridization free energies (light green) and a strand displacement model (dark green). Effects of changing parameters are indicated by arrows. The gray bar represents the NTC. d, Overview of strand displacement reactions. After initial binding to part of the target (blue), the crRNA (pink) and occluder (red) undergo a random walk process until one or the other is fully displaced. Displacement of the occluder leads to Cas13 activation. In b,c, the mean is displayed, with error bars showing the s.d. across n = 3 technical replicates.
Activity reduction is quantitatively explained by a kinetic strand displacement model
An equilibrium model based on the free energy of each target RNA (Methods) failed to quantitatively account for the degree of structure-mediated Cas13 activity reduction (Fig. 1c, light-green dotted line). Labeling the free energy of the target–occluder complex as (varDelta {G}_{{rm{u}}}), the disagreement between the large difference in thermodynamic drives ((exp [-beta varDelta {G}_{{rm{u}}}]) ranges over 30 orders of magnitude) and the smaller difference in activities (ranging over two orders of magnitude) cannot be explained by an equilibrium RNA–RNA hybridization framework. Given the known free energies of RNA–RNA binding19, the system temperature would have to be ~7,500 K to match an equilibrium model to the measured Cas13 activity reduction.
We next sought to find a suitable alternative framework to explain the measured activity levels; a strand displacement model presents one such framework20. In this model, after initial binding to the target, the crRNA and occluding strand compete through a random-walk-like process until either the occluding strand is fully displaced or the crRNA–Cas13 complex dissociates from the target RNA21,22 (Fig. 1d). We hypothesized that strand displacement must occur for Cas13 to bind structured RNA.
In the strand displacement model, Cas13 binds to an unstructured region of the protospacer (a ‘toehold’) and then attempts to undergo a one-dimensional random walk to displace the occluder. If the random walk completes before Cas13 dissociates, Cas13 is activated. Both the length of the random walk and the dissociation rate ku are quantitatively affected by the amount of structure. The data are ultimately best fit by a model in which the effect of structure on ku is dominant (Fig. 1c, dark-green dotted line, and Methods).
A massively multiplexed assay reveals structure effects are sequence independent
To probe the limits of the strand displacement model, we used a massively multiplexed assay to explore a broad range of target structure conditions for multiple sequences. Our assay uses DNA oligos to create secondary structure at defined positions in the target, having previously validated their effect as a proxy for RNA structure (Figs. 1b and 2a). We designed a single 1-kb-long RNA molecule with minimal internal secondary structure23 (Extended Data Fig. 1a–c); a NUPACK prediction estimated its minimum free energy because of intramolecular contacts to be ~−6 kcal mol−1, on par with random 35-nt-long RNA sequences24. Our target RNA is divided into two control blocks (one at each end of the molecule) and eight experimental blocks, allowing for efficient multiplexing10. Each block contains a 28-nt-long protospacer flanked by two 34-nt buffer regions. For occlusion, we used DNA oligos of lengths 10, 14, 21 and 28 nt in 3-nt-spaced tilings, for a total of 4,608 simultaneous conditions. We tested these conditions in parallel using a microfluidic chip-based assay25. Summaries of the resulting dataset are shown in Fig. 2b and Extended Data Figs. 2 and 3.

a, Overview of the multiplexed assay, in which a total of 4,608 simultaneous assays were performed, with oligo occluders of lengths 10, 14, 21 and 28 nt tiling each protospacer region in 3-nt increments. b, Overview of the Cas13 activity data from the multiplexed assay. Each data point represents the mean activity resulting from averaging four timeseries curves (Methods), normalized to the nonoccluded condition; positive and negative controls are not shown (Extended Data Fig. 3). Dashed lines represent the start and end of the protospacer. c, Heat map showing the degree of activity reduction (darker greens) by each 21mer and 28mer occluder. d, Cumulative histogram of inhibition asymmetry, defined as the ratio of activities when the same numbers of nucleotides are occluded at the 3′ versus 5′ ends of the protospacer (Extended Data Fig. 4c,d). e, Normalized Cas13 activity for 21mer (green) and 28mer (purple) occluders with different start positions in the region around the protospacer. Each line represents one crRNA. f, Strand displacement model prediction for activity as a function of occluding oligo, colored by the fraction of seed or switch regions occluded by the oligo. g, EMSA showing Cas13–crRNA complex with various combinations of target and occluders. P and 3′ represent 28mer occluders overlapping the protospacer or the region 3′ to the protospacer, respectively. A representative image of three replicate gels is shown. h, Bar chart showing the inhibitory effect of 28mer occluders overlapping the protospacer or the region 3′ to the protospacer, at different occluder concentrations and when annealing the occluder before or at the same time as the crRNA. In b–e, the mean of n = 4 replicates (two biological and two technical) is displayed. In e, error bars show the s.d. across n = 4 replicates (two biological and two technical). In h, the mean is displayed, with error bars showing the s.d. across n = 3 technical replicates.
Our results demonstrate that the reduction in Cas13 activity as a result of target structure is relatively sequence independent, with the eight experimental target blocks showing similar activity profiles in spite of large variation in absolute activity across these blocks (Fig. 2c and Extended Data Fig. 2). While 10-nt-long and 14-nt-long occluders had negligible effects on Cas13 activity, 21mers and 28mers had a strong effect. Consistent with earlier results, occluders binding to more of the protospacer typically led to a greater activity reduction. In contrast to other strand displacement systems22,26,27, the presence or absence of toeholds (unoccluded RNA) had little effect on Cas13 activity (Extended Data Fig. 4a,b), which we interpret to indicate that Cas13 may also bind nonspecifically to the RNA.
The data also revealed an unexpected asymmetry among the effect of occluders on Cas13, in which occluders binding to the 5′ end of the protospacer had a larger effect on Cas13 activity than occluders binding the same number of nucleotides at the 3′ end (Fig. 2d and Extended Data Fig. 4c–f). This asymmetry can be quantitatively explained within the strand displacement framework, as toeholds at the 3′ end of the protospacer have an extra cross-stacking interaction compared to those at the 5′ end, reducing ku by a factor of (exp (1.7)) (ref. 28). We found that the strand displacement model was able to quantitatively capture the effects of secondary structure on Cas13 activity (Fig. 2d,e). This strand displacement model provides an alternate framework for prior results, demonstrating the importance of ‘seed’ and ‘switch’ regions at positions 5–8 and 9–14, respectively (Fig. 2f)15,17.
Structure occluding the region 3′ of the protospacer inhibits Cas13
Surprisingly, when occluders are placed directly 3′ to the protospacer, Cas13 activity is potently inhibited. This second regime of inhibition exists across all tested crRNAs and inhibition is strong for both 21mer and 28mer occluders (Fig. 2c). The nonmonotonicity of this second activity trough cannot be explained using a strand displacement model, implying that this drop in activity is not because of a reduction in crRNA–target binding. In agreement with this hypothesis, an electrophoresis mobility shift assay (EMSA) showed that 3′ occlusion led to negligible reduction in binding affinity of the crRNA–Cas13 complex to the target, as opposed to protospacer occlusion, which led to a substantial reduction (Fig. 2g). We additionally confirmed this using isothermal titration calorimetry (ITC), which showed tight binding of the crRNA–Cas13 complex to an RNA with a 3′ occluder (Extended Data Fig. 4g,h).
To probe more fully whether the effect of occluders on Cas13 activity is a result of competitive or allosteric inhibition, we modified our typical protocol of preannealing occluders to the target. For the protospacer occluder but not for the 3′ occluder, we observed full rescue of Cas13 activity when the crRNA and occluder were added at the same time. Increasing the concentration of the 3′ occluder did not increase its inhibitory effect (Fig. 2h). These results indicate that the activity reduction conferred by occluding the region 3′ to the protospacer is likely the result of an allosteric rather than a competitive inhibitory effect.
Strand displacement enhances mismatch detection
We hypothesized that the insights from our strand displacement model could help us dramatically improve the specificity of Cas13-based RNA detection assays. Past work has shown that secondary structure can make nucleic acid hybridization more sensitive to mismatches, both in CRISPR-based approaches and in other assays29,30,31,32; we hypothesized that, given the kinetic nature of our assays, we could leverage the kinetic nature of strand displacement to similar ends without the necessity of a binding toehold required in other approaches. With no internal structure, even a mismatched crRNA is expected to bind strongly to the target in our model. However, an occluding strand provides an extra kinetic barrier that is less likely to be overcome by a mismatched crRNA than one that is perfectly complementary, thus improving specificity given the short dwell time of inactive Cas13 on the RNA (Fig. 3a). An ordinary differential equation (ODE)-based strand displacement model inspired by a previous study33 supported this hypothesis, revealing that, even when both complementary and mismatched invader strands bound strongly to the target in equilibrium, the mismatched invader took much longer to bind than the perfectly matched invader in the presence of an occluder (Fig. 3b).

Unless otherwise noted, the assay duration was 180 min. a, Schematic showing strand displacement by Cas13 with a perfectly matched target sequence versus one containing a mismatch. b, ODE-based model predictions of crRNA–target hybridization kinetics with and without occlusion and mismatches. c, Kinetic curves showing detection of a target sequence with and without a single A>U mismatch at spacer position 5, in the presence and absence of occlusion. The shaded region shows the range of fluorescence measurements for each condition across replicates. d, Maximum fluorescence ratios with and without occlusion at a variety of target input concentrations (Methods). Error bars represent the error as measured by the s.d. of n = 3 technical replicates propagated through the ratio calculation (Methods). e, Violin plots showing the ability of Cas13 to distinguish between WT targets (for crRNAs numbered as in Fig. 2c) and targets containing mutations at four different positions in the protospacer both with and without occlusion; the position is relative to the 5′ end of the protospacer. Each data point is the discrimination ratio of a perfectly matched to mismatched sequence (Methods). f, Data from e, but organized by mutation type. g, Heat map showing the ability of Cas13 to detect spiked-in target in a background of mismatched sequence at decreasing allele frequencies, both with and without occlusion. Asterisks indicate statistically significant detection over the no-spike-in control. Significance was determined using a one-tailed t-test at P < 0.05. Activity discrimination is defined analogously to mismatch discrimination (Methods). h, Specificity matrix showing Cas13 activity normalized for each target to its corresponding crRNA, with and without occlusion, for all possible crRNA and target nucleotides at position 5. In g,h, the means across n = 3 and n = 2 technical replicates, respectively, are shown.
We tested Cas13’s ability to differentiate between a perfectly complementary target and one containing a single A>U mutation at position 5 of the protospacer with and without secondary structure occlusion. We tested both occluding the target and occluding the crRNA, reasoning that strand displacement would, in either case, result in improved mismatch discrimination (Extended Data Fig. 5a,b). We decided to focus on crRNA occluders as these provide the added benefit of improving mismatch detection regardless of the identity of the mismatched target and their use does not require any sample manipulation before detection. The presence of a crRNA occluder resulted in a ~50-fold enhancement of specificity compared to the no-occluder condition (NOC), measured as the maximum ratio of wild type (WT) to mismatch fluorescence (Fig. 3c). This effect was robust to large variations in target concentration and was maximized at higher ~1–100 nM target input concentrations (Fig. 3d and Extended Data Fig. 6a).
We proceeded to explore the generality of Cas13 specificity enhancement by occluders. Using three different targets, four positions on each crRNA, two mutations for each position and four technical replicates, we tested how well a mismatch could be detected by Cas13 with and without a crRNA occluder. We measured Cas13 activity on the perfectly matched and mismatched targets, finding that, although only 74/96 mismatches (77%) led to any activity reduction in the absence of a crRNA occluder, all 96 (100%) led to a reduction with the occluder (Fig. 3e,f and Extended Data Fig. 7). Of the 24 separate mismatches tested, discrimination was significant (P < 0.05, one-sided t-test) in only 54% (13/24) without occluders and in 24/24 with occluders. We found that, without occlusion, the ability of Cas13 to distinguish between a perfectly matched target and a mismatched target was not guaranteed for any crRNA for any of the mismatch positions we tested, nor for any specific type of mutation (with the possible exception of G>U, for which we collected the fewest data points). However, using occluded crRNAs, Cas13 can distinguish perfectly matched from mismatched targets in a position-independent and mutation-independent manner.
We performed a dilution series of perfectly matched target RNAs and then spiked this target RNA into solutions of single-mismatch off-target RNAs. Without occlusion, the perfectly matched target was detected at allele frequencies of 11% (a 1:8 ratio) but not 6% (1:16); with occlusion, it was detected at frequencies as low as 0.4% (1:256) for all tested targets, an order-of-magnitude sensitivity enhancement (Fig. 3g and Extended Data Fig. 6b).
To explore nucleotide-specific effects, we mutated the crRNA and target sequences to all possible nucleotides at position 5 of the spacer. When testing all pairwise crRNA–target combinations, we observed extensive cross-reactivity between crRNAs and targets in the absence of occlusion. With occlusion, we observed specific detection of each target only by its perfectly matched crRNA (Fig. 3h and Extended Data Fig. 8). Occluded crRNAs can thus discriminate all four possible alleles at a given position, demonstrating the exquisite specificity of the approach.
Occluders enable variant calling in diagnostic settings
To test the efficacy of our occlusion strategy in real-world diagnostic contexts, we considered a set of SARS-CoV-2 and influenza A virus (IAV) variants of clinical importance and measured the extent to which Cas13 can distinguish among these both with and without occluders (Fig. 4a). While testing various occluder–target pairs, we found that a small subset of DNA sequences could serve as targets for LwaCas13a, activating trans-cleavage activity, a finding that was recently reported by others for LbuCas13a (ref. 34). To mitigate this effect, we tested several modified occluders, finding that incorporating a single locked nucleic acid at position 16 of the occluder (measured relative to the spacer) eliminates background activity and does not compromise performance (Extended Data Fig. 9a,b).

a, Schematic of detection workflow. b, Detection of Delta and Omicron SARS-CoV-2 spike gene RNA from amplified viral seedstocks. The fluorescence at the time point corresponding to the maximum discrimination ratio is shown, normalized independently for each target to its maximum. c, Cas13-based discrimination of ancestral (627E) IAV variant from multiple mammalian-adapted (627K) strains, as well as the rare 627V variant, all distinguished by a single-nucleotide substitution. In c,d, each target’s final fluorescence at 180 min was normalized independently to its maximum. d, Discrimination of a single-nucleotide substitution in IAV strains conferring oseltamivir resistance in six different isolates, using a single guide pair per NA subtype. e, Variant detection in US samples infected with Delta and Omicron strains of SARS-CoV-2. In e–g, the final fluorescence (x axis) is used to distinguish positive from negative calls, whereas the maximum fluorescence ratio (y axis) is used to distinguish variants. -, not detected. f, Discrimination of 627E from 627K in UK samples infected with seasonal IAV. g, Variant detection in Dutch samples infected with oseltamivir-sensitive (H) and oseltamivir-resistant (Y) single-nucleotide IAV variants. h, Discrimination of Delta versus Omicron SARS-CoV-2 variants in samples using a simple fluorescence readout. i, Discrimination of IAV 627E from 627K variants in samples and clinical isolates from persons tested positive for H5N1 since 2023 in Cambodia. The fluorescence at the time point corresponding to the maximum discrimination ratio was normalized independently for each target to its maximum. j, Using occluded Cas13 to distinguish seven variants of codon 12 of the KRAS gene with mCARMEN. The final fluorescence at 180 min was normalized independently for each target to its maximum. In b–d,i,j, the means across n = 2 technical replicates are shown.
We first sought to diagnose SARS-CoV-2 variants in amplified viral seedstocks, finding that occluded Cas13 is able to distinguish between the B.1.617.2 (Delta) and B.1.1.529 (Omicron) variants (Fig. 4b and Extended Data Fig. 10a). Next, we tested IAV variants with public health relevance. Of particular concern is the E627K substitution in the PB2 protein of avian IAV strains, driven by a single-nucleotide change, which is associated with mammalian adaptation, increases avian IAV replication and pathogenicity in humans, and which can currently only be diagnosed by sequencing35,36. With occluders, Cas13 was able to robustly distinguish the ancestral (627E) variant from multiple mammalian-adapted (627K) strains, as well as the 627V variant, which is becoming increasingly prevalent37 (Fig. 4c and Extended Data Fig. 9c). Another clinically important mutation occurs in the NA gene, encoding an H-to-Y substitution (commonly at position 275 in seasonal N1 strains) that confers resistance to oseltamivir (Tamiflu). We introduced this H>Y substitution into various strain backgrounds (1934 H1N1, 1968 H2N2, 1996 H5N1, 1999 H9N2, 2004 H3N2 and 2009 H1N1). Occluded Cas13 distinguished the WT from the mutant variant in all strains using only a single guide pair per NA subtype (that is, one for N1 strains and one for N2 strains) (Fig. 4d and Extended Data Fig. 10b).
To realize real-world deployability, we integrated our occluder methodology into SHERLOCK, a multiplexed and portable Cas13-based RNA detection protocol, finding that occluder-enhanced detection displays sensitivity of 10 copies (cp) per μl, the lowest concentration tested (Extended Data Fig. 6c). We tested 26 SARS-CoV-2 samples from the USA (20 positive and 6 negative samples). Occluded Cas13 was able to robustly distinguish positive from negative samples and to distinguish Delta from Omicron variants, failing to detect only a single sample with a Ct value > 35 and making no incorrect calls (Fig. 4e and Extended Data Fig. 10c; 95% sensitivity and 100% specificity). To perform discrimination, we measured the fluorescence ratio between crRNAs targeting the variants at the time where this ratio was highest, labeling the ratio (F_{{v}_{1}/{v}_{2}}) for variants v1 and v2 (Methods). We also analyzed 33 seasonal H1N1 or H3N2 IAV-positive samples from the UK and confirmed that occluded Cas13 was able to correctly identify the 627E or 627K variant in all samples for which Cas13-based detection showed a positive signal; six samples tested negative because of poor amplification resulting from sequence variation in the primer-binding regions (Fig. 4f and Extended Data Fig. 9d; 82% sensitivity and 100% specificity). We next tested eight IAV A(H1N1)pdm09 samples from infected persons from the Netherlands for the single-nucleotide oseltamivir-resistance mutation NA-H275Y, correctly calling all samples as containing the WT or resistant variant (Fig. 4g and Extended Data Fig. 10d; 100% sensitivity and 100% specificity). Moreover, occluded Cas13 was able to distinguish Delta from Omicron strains in samples using a visual fluorescence readout (Fig. 4h).
In the midst of the ongoing H5N1 avian influenza outbreak, we deployed our E627K assay for variant surveillance in Cambodia and tested two samples and 11 clinical isolates from persons tested positive for H5N1. Occluded Cas13 was able to robustly distinguish the persons with the E variant from those with the K variant with 100% sensitivity and specificity (Fig. 4i and Extended Data Fig. 9e). Additionally, the occluded Cas13 assay called one clinical isolate (which was originally reported to be the avian-adapted E variant) as being positive for both E and the mammalian-adapted K. Upon deep sequencing, this isolate was indeed confirmed to contain both E (50.8%) and K (48.3%) variants at position PB2 627. This underlines the power of occluded Cas13 in detecting rare or minor variants that may be missed in sequencing-based assays.
The variability of Cas13’s specificity has so far hampered the potential of using Cas13 for mutation detection at scale. Our occluder methodology is therefore poised to expand the utility of Cas13 for SNP detection beyond viral diagnostics. To demonstrate this principle, we used occluded Cas13 to distinguish somatic variants in the KRAS gene, a pan-cancer oncogene mutated in over 20% of human cancers38. We focused on seven somatic variants of codon 12, as this site is highly polymorphic and represents over 90% of oncogenic KRAS mutations. Its mutants are associated with negative outcomes for cancer survival, although different mutations have differential prognoses and treatment options, highlighting the importance of correct variant diagnosis39,40. To multiplex this large-scale panel, we integrated occluders into mCARMEN, which leverages microfluidics to test a large number of samples for a panel of crRNAs simultaneously. Occluded Cas13 was able to robustly distinguish all seven KRAS variants from one another, even though 24 of 42 variant pairs are distinguished by only a single-nucleotide substitution and none are distinguished by >2 substitutions (Fig. 4j and Extended Data Fig. 10e).
Discussion
In this study, we quantified the reduction in Cas13 activity because of secondary structure in the target RNA and showed that our results are quantitatively consistent with a strand-displacement-based model of Cas13 activation. We used this model to improve Cas13’s mismatch specificity by an order of magnitude and to identify single-nucleotide substitutions in RNA virus genomes.
Questions remain regarding the mechanism by which secondary structure 3′ to the protospacer leads to an allosteric reduction in Cas13 activity. For instance, extended complementarity between the target and the structural portion of the crRNA (known as the tag–antitag effect) inhibits Cas13 activity by preventing the proper formation of the active site41,42. Future structural and biochemical characterization will reveal whether the inhibitory region we discovered affects Cas13 by a similar or a different mechanism. Moreover, while our model explains the sequence-independent effects of RNA structure on Cas13, future work may develop more precise sequence-dependent models for these effects.
Our crRNA occlusion method is simple to implement experimentally as it only requires annealing a DNA oligo to the crRNA before adding the target RNA. Unlike in other studies leveraging RNA secondary structure to improve hybridization specificity, no toehold is required and all crRNA occluders used are complementary to the entire crRNA spacer. As we show, occluders yield substantially improved specificity even with no sophisticated crRNA design approaches; at the same time, the modularity of occluders means that our technique can be integrated with crRNA design tools of choice, including those based on machine learning models or informed by biochemical studies14,16,17. The improved specificity resulting from crRNA–occluder duplexes is associated with a reduction in Cas13 activity. Thus, this method is able to identify rare alleles; however, sample inputs matter and we found that samples with a Ct value over 35 do not benefit from our assay. Steps can also be taken to increase overall activity such as increasing concentrations of Cas13, reporter and/or crRNA.
Because of its negligible cost, ease of implementation, orthogonality with existing technologies and marked improvement in detection specificity, we anticipate the adoption of our crRNA occlusion approach into a wide range of Cas13-based techniques. For instance, our approach confers single-nucleotide specificity to deployable diagnostic assays, enabling emerging variant detection in resource-limited settings. Lastly, our proposed strand displacement model addresses a long-standing paradox, namely how a purportedly ssRNA-specific enzyme is able to robustly target RNAs in cellular environments where RNA structure is ubiquitous.
Methods
General reagents
Oligonucleotides were ordered from Integrated DNA Technologies (IDT). Unless otherwise noted, chemical reagents were ordered from Sigma. Oligonucleotide sequences are listed in Supplementary Table 1.
Ethics: clinical samples
IAV seasonal clinical samples consisted of nasopharyngeal swabs taken from hospitalized participants who were able to give consent during routine testing at Addenbrookes Hospital during the 2016–2020 flu seasons. Routine reverse transcription (RT)–qPCRs were performed to confirm that persons were positive for either H1N1 or H3N2 and negative for other respiratory viruses. Samples were anonymized after routine laboratory testing and no identifiable information generated with the leftover material as determined by the East of England Cambridge Central Research Ethics committee. The study protocol was prepared by A.J.W.t.V. and H.J. and reviewed and approved by the Health Research Authority (IRAS ID 258438; REC reference 19/EE/0049).
COVID-19 clinical samples consisted of self-collected saliva samples submitted with informed consent by Princeton University students, faculty and staff members for surveillance testing43. The presence of SARS-CoV-2 RNA was confirmed using RT–qPCR; samples were subsequently anonymized before further testing and no identifiable information was generated during subsequent analyses of leftover material. The study protocol was prepared by C.M and A.J.W.t.V. and reviewed and considered exempt from human subject research by the Princeton University Institutional Review Board.
Cambodian H5N1 clinical samples consisted of nasopharyngeal and/or oropharyngeal swabs taken during suspected H5N1 infections or routine testing from persons through the Cambodian influenza-like illness (ILI) and severe acute respiratory illness (SARI) surveillance systems44,45. The Cambodian ILI and SARI surveillance systems are integral components of the World Health Organization (WHO) global influenza surveillance and response system. These public health initiatives are managed by Cambodia’s Ministry of Health (MoH) and the Communicable Disease Control (CCDC) Department. For each human H5N1 case, a collaborative One Health investigation was carried out by the CCDC and MoH, alongside the National Animal Health and Production Research Institute and provincial authorities. This effort was supported by the US Centers for Disease Control and Prevention, the WHO and the Food and Agriculture Organization of the United Nations.
The oseltamivir-resistant virus samples were identified through the Dutch national sentinel general practitioner surveillance for acute respiratory infections, the Dutch national A(H1N1)pdm09 influenza case finding program and the Amsterdam and Groningen University Medical Centers. Reference numbers for sequenced viruses are provided in Supplementary Table 2.
crRNA design
Most crRNA spacers were designed to be perfectly complementary to their 28-nt protospacer region. For SARS-CoV-2-targeting sequences, a single synthetic mismatch was inserted at position 5 to improve baseline specificity. Spacers were appended to the 3′ end of the consensus direct repeat sequence for the Cas13 ortholog used (Supplementary Table 1) and ordered from IDT as Alt-R guide RNA.
Target design
For our tiling experiment, we designed an RNA molecule with a length of 961 nt and minimal internal secondary structure. After an initial G nucleotide, the molecule comprises ten target blocks, each defined by a 34-nt buffer region, a 28-nt protospacer and a second 34-nt buffer region. We sought to have as many as possible of the 28-nt protospacers resemble natural sequences.
To this end, we started with a set of 18,508 28-nt-long protospacer sequences compiled from the ADAPT dataset, which has a sequence composition representative of viral diversity10. A total of 3,391 sequences with poly(A), poly(C) or poly(U) stretches ≥ 5 nt or poly(G) stretches ≥ 4 nt were removed. Of the remaining sequences, we removed 6,459 that had low average measured activity, defined as ‹out_log_k› ≤ −2 (on a logarithmic scale from −4 to 0, where 0 is high activity) using the activity definitions and measurements from a previous study10. We used LandscapeFold46 with parameter m = 2 (m represents the minimum allowed stem length), disallowing pseudoknots, to predict the structure landscapes of the remaining sequences. LandscapeFold predicted that 1,287 of these remaining sequences had extremely low intramolecular structure, defined as all nucleotides having a ≥40% probability of being unpaired in equilibrium.
We then aimed to find a set of these sequences that were all dissimilar from one another. First, given a sequence s, we found all those sequences with a Hamming distance ≤ 15 from s. A pair of sequences with a Hamming distance of h share all but h nucleotides. Of these sequences, we chose the one with the least secondary structure to keep and removed the others, with total amount of secondary structure quantified as ({varSigma }_{n}{p}_{n}) where the sum is over nucleotides and ({p}_{n}) is the probability of the nucleotide being paired in equilibrium. We repeated this step for each sequence s we did not already remove. Next, we used a Smith–Waterman alignment47 to check for sequence similarity in nonidentical nucleotide positions, repeating the same procedure as above but, instead of Hamming distance, using the criterion of an alignment score ≥ 9 to define sequence similarity, where the alignment score parameters were (+1, −2, −2) for (match, mismatch, gap). This procedure resulted in a set of 20 sequences all distant from one another in sequence space.
Lastly, although we ensured each of these sequences had low secondary structure, we wanted to minimize binding between these sequences. For each pair of sequences, we used LandscapeFold with parameter m = 3 to predict the structure of the two strands, allowing for both intramolecular and intermolecular interactions. We defined two sequences to be incompatible if the resulting prediction had any nucleotide on either sequence with a ≤40% probability of being unpaired in equilibrium. We exhaustively enumerated the possible ordered sets of mutually compatible sequences, finding 60 ordered sets of five mutually compatible sequences and no set of six mutually compatible sequences. Of these 60 sets, we chose the one with the least structure. Under the assumption that entropic loop closure costs will create a barrier to non-neighbor sequence pairing (that is, where each sequence is less likely to pair to a sequence that is not its neighbor), we defined structure here as the sum, over the four pairs of neighboring sequences, of the maximum probability of a nucleotide being paired in that sequence pair. Thus, we arrived at a set of five distinct sequences from ADAPT with minimal intramolecular and intermolecular structure. These five sequences became the protospacer sequences corresponding to crRNAs 2, 4, 6, 8 and 9.
The other five protospacer sequences and the buffer regions were compiled out of 64 16-nt-long DNA sequences with minimal internal structure from Shortreed et al.23. Seven of these sequences with poly(A) or poly(T) stretches ≥ 5 nt were removed. Concatenating these sequences resulted in a long sequence with minimal structure, which we used to construct the rest of the 961-nt-long RNA target. We used NUPACK 3 (ref. 48) to predict the structure of the resulting target, finding various predicted stems. We then made individual point mutations in the buffer regions and non-ADAPT-derived protospacers to minimize the probabilities of the resulting stems (ensuring that NUPACK predicted no base pair forming with probability ≥ 60% in equilibrium) and to remove sequence similarity between targets (ensuring that there were no more than five identical consecutive nucleotides between the protospacer regions, no more than six identical consecutive nucleotides between two regions spanning a protospacer and a buffer and no more than eight identical consecutive nucleotides in buffer regions).
Lastly, we created a ‘shuffled’ version of the target, placing the target blocks (numbered 1–10 from 5′ to 3′ in the original target) in the following order: 1, 4, 2, 7, 5, 3, 9, 6, 8 and 10. We ensured that NUPACK 3 did not predict any base pair forming with probability ≥ 60% in the resulting sequence.
For our initial experiments (Fig. 1), we filtered the ADAPT dataset sequences to those with high activity (‹out_log_k› > −2) and perfect complementarity between target and crRNA in the ADAPT dataset. We then measured LandscapeFold’s prediction of the secondary structure of each candidate protospacer sequence. For each nucleotide, we calculated the total probability that the nucleotide is unpaired in equilibrium. The protospacer chosen had each nucleotide with at least a 92% probability of being unpaired in equilibrium.
RNA preparation (including structured targets)
RNA targets were ordered from IDT as DNA containing a T7 promoter sequence. Targets were then transcribed to RNA using the T7 HiScribe high-yield RNA synthesis kit in 55-μl reactions (New England Biolabs) with a 16-h incubation step at 37 °C and purified with 1.8× volume AMPure XP beads (Beckman Coulter) with the addition of 1.6× isopropanol, before eluting into 20 μl of nuclease-free (NF) water. All RNAs were then quantified using a NanoDrop One (Thermo Fisher Scientific) or Biotek Take3Trio (Agilent) and then stored in NF water at −80 °C for later use.
Occluded targets and crRNAs were prepared by mixing DNA and RNA oligo occluders with target RNA or crRNA in 60 mM KCl (Invitrogen) in NF water at a ratio of 2:1 (BioMark assays) or 10:1 (plate reader assays) and put through an annealing cycle consisting of a high-temperature melting step at 85 °C for 3 min, followed by gradual cooling to 10 °C at 0.1 °C s−1 followed by cooling to 4 °C. For massively multiplexed assays, occluders were first pooled by length and start position within the target block (Extended Data Fig. 1d) such that each resulting oligo pool contained all eight n-mers binding to a given position within each of the experimental target blocks. Targets and crRNAs were then used for detection assays immediately as described below.
Targets were input into detection reactions at various concentrations. For experiments in Fig. 1, targets were input at 7.5 × 10⁸ cp per μl. For experiments in Fig. 2a–f, targets were input at 8 × 10⁸ cp per μl. For Fig. 2h, targets were input at 5 × 10⁹ cp per μl. For experiments in Fig. 3a–f, input concentrations of 7.5 × 10⁹ cp per μl were used unless otherwise noted in figure caption. For Fig. 3g, targets were spiked in at the indicated allele frequency into a background of 5 × 10¹⁰ cp per μl (for occluded conditions) or 5 × 10⁸ cp per μl (for nonoccluded conditions). For Fig. 3h, occluded conditions used an input concentration of 5 × 10¹⁰ cp per μl, whereas nonoccluded conditions used a concentration of 5 × 10⁸ cp per μl.
Virus strains and seedstocks
Viral strains used are listed in Supplementary Table 2. Target controls were amplified from plasmids. Extracted viral genomic RNA samples were acquired from BEI Resources (hCoV-19/USA/MD-HP05285/2021 (B.1.617.2) Delta and hCoV-19/USA/GA-EHC-2811C/2021 (B.1.1.529) Omicron). Amplification reactions using 1 or 2 μl of viral RNA as the input (total reaction volume: 50 μl) were performed using the Qiagen One-Step RT–PCR kit according to the manufacturer’s specifications.
Clinical sample amplification
Total RNA was extracted from clinical samples using the trizol–chloroform method. Extracted RNA was then amplified using Qiagen One-Step RT–PCR (UK seasonal influenza samples, US SARS-CoV-2 samples and Cambodia H5N1 samples and isolates) or RT–recombinase polymerase amplification (TwistDx; Netherlands seasonal influenza samples, select SARS-CoV-2 samples) using either 1 or 2 μl of input material.
Cas13 detection assays
Standard bulk detection assays were performed by mixing target RNA or complementary DNA (cDNA) at a ratio of 10% v/v with 90% Cas13 detection mix. The detection mix consisted of 1× RNA detection buffer (20 mM HEPES pH 8.0, 54 mM KCl and 3.5% PEG-8000 in NF water), supplemented with 45 nM purified LwaCas13a (Genscript; stored in 100 mM Tris-HCl pH 7.5 and 1 mM DTT), 1 U per μl murine RNAse Inhibitor (New England Biolabs), 62.5 nM fluorescent reporter (/5FAM/rUrUrUrUrUrU/IABkFQ/; IDT), 22.5 nM processed crRNA (IDT) and 14 mM magnesium acetate. In experiments using crRNA occlusion, crRNAs were preannealed to DNA occluders as described above and used at a final concentration of 22.5 nM. Experiments using cDNA as the input included 0.3 mM ribonucleotide triphosphates (rNTPS; New England Biolabs) and 1 U per μl T7 polymerase (Biosearch). Minor adjustments to the detection mix were made for experiments using other orthologs of Cas13. For RfxCas13d, the Cas13 concentration was set to 90 nM and crRNA concentration was set to 45 nM. For LbuCas13a, Cas13 concentration was set to 10 nM and crRNA concentration to 5 nM. The 15-μl reactions were loaded in technical triplicate (Fig. 1) or duplicate (Figs. 2h and 3d–h and Extended Data Figs. 5–9) onto a Greiner 384-well clear-bottom microplate (Greiner, 788096) and measured on an Agilent BioTek Cytation 5 or Synergy H1 microplate reader for 3 h with excitation at 485 nm and detection at 528 nm every 5 min.
For tiling assays and the mCARMEN KRAS assay, Standard Biotools genotyping IFC (192.24 format) was used in a BioMark HD for multiplexed detection. Assay mix (10% of final reaction volume) contained 1× assay detection mix (Standard Biotools) supplemented with 100 nM crRNA, 100 nM LwaCas13a (Genscript; stored in 100 mM Tris-HCl pH 7.5 and 1 mM DTT). Sample mix (90% of final reaction volume) contained 1× sample buffer (44 mM Tris-HCl pH 7.5, 5.6 mM NaCl, 10 mM (tiling experiment) or 2 or 14 mM (KRAS) MgCl (comparison of Mg concentrations in Extended Data Fig. 6d), 1.1 mM DTT and 1.1% w/v PEG-8000), supplemented with murine RNAse Inhibitor (1 U per μl; New England Biolabs), fluorescent reporter (500 nM; IDT), 1× ROX reference dye (used for normalization of random fluctuations in fluorescence between chambers; Standard Biotools), 1× GE Buffer (Standard Biotools), 20 mM KCl and occluded RNA target (9 × 10⁸ cp per μl). Experiments using cDNA as the input included 0.9 mM rNTPS (New England Biolabs) and 0.125 U per μl T7 polymerase (Biosearch).
Sample volumes of 3.5 μl and assay volumes of 3.5 μl, in addition to appropriate volumes of control line fluid, actuation fluid, and pressure fluid (Standard Biotools), were loaded onto the 192.24 genotyping IFC chip (Standard Biotools). Chips were then placed into the Fluidigm Controller and loaded and mixed using the Load Mix 192.24 GE script (Standard Biotools).
After mixing, reactions (two technical replicates each) were run on BioMark HD at 37 °C for 8 h, with measurements taken in the FAM and ROX channels every 5 min. Normalized and background-subtracted fluorescence for a given time point was calculated as (FAM − FAM background)/(ROX − ROX background).
For fluorescence in-tube detection assays, Cas13 detection mix was prepared as in bulk detection assays with fluorescent reporter raised to 250 nM and crRNA raised to 45 nM in the final reaction. The 33-μl reactions were incubated at 37 °C for 3 h. Every 30 min, reactions were visualized with ultraviolet light on a transilluminator and captured with a smartphone camera.
Nondenaturing acrylamide gel electrophoresis
Two separate mixtures were prepared for the target RNA with occluders and the ribonucleoprotein (RNP) complex. Target RNA and occluders were first annealed at 1:1 ratio in 7.5 μl of tube A (final concentration 2 μM each in 7.5 μl) containing 1× binding buffer (24 mM KCl, 4 mM Tris-HCl pH 8.0, 0.4 mM DTT, 10% glycerol, 0.1 mg ml−1 BSA and 5 mM MgCl2) at 85 °C for 10 min followed by gradual cool down at a rate of 0.1 °C s−1. To prepare the RNP complex, dLwaCas13a was mixed with crRNA at 1:1.33 ratio in 7.5 μl of tube B (final concentration 2 μM and 2.67 μM, respectively, in 7.5 μl) containing 1× binding buffer and incubated at 37 °C for 15 min. Next, 7.5 μl of tube A was added to tube B to bring the final volume to 15 μl, followed by another 37 °C incubation for 30 min. Samples were then loaded into 5% Mini-PROTEAN TBE gel (Bio-Rad) and run in 0.5× TBE buffer. The gel was analyzed by imaging the FAM and Cy5 channels on an Azure Biosystems 600 imager before staining with SYBR gold for total nucleic acid visualization.
Activity fits
Fluorescence curves were converted to activity scores by fitting the curves to effectively first-order reactions. With a certain amount of active Cas13, the concentration of uncleaved reporter is expected to decrease exponentially according to the reaction
$${E}^{star }+Uto {E}^{star }+P$$
where ({E}^{star }) is the concentration of active Cas13, U is the concentration of uncleaved reporter and P is the concentration of cleaved reporter RNA. Labeling the (second-order) rate constant of this reaction as r, the concentration of P changes over time according to
$$P(t)={P}_{mathrm{tot}}-left({P}_{mathrm{tot}}-P(0)right){e}^{-r{E}^{* }t}$$
Assuming that ({E}^{star }) is constant over time, we define an activity score (nu =r{E}^{star }), which is an effective first-order rate constant (with units of inverse time). Assuming that r is constant across our assays, the activity score ν is, thus, a proxy for the amount of active Cas13. Given measured P(0), we find best-fit values of Ptot and ν to fit the kinetic curves. To account for curves very far from saturation (for example, no-target control (NTC) data) we set a minimum value of Ptot on the basis of data from saturating and near-saturating curves. For tiling data, we fit the first 50 time points (~4 h) to discount occasional apparent noise appearing at very late times.
Some assays including crRNA occluders displayed fluorescence curves that did not fit well to this effective first-order reaction (Extended Data Figs. 5–8), indicating a need to relax the assumption that A is constant over time. For data shown in Extended Data Figs. 7a and 8, we neglected the first several time points measured (15 and 10 time points, respectively, corresponding to 75 and 50 min), as we found that doing so increased the goodness of fit. For other assays using crRNA occluders—and those assays being directly compared to them (that is, data shown in Extended Data Figs. 5–7)—we fit the data to a series of two effective first-order reactions:
Labeling the first-order rate constant of each reaction ({k}_{1}) and ({k}_{2}), this model yields
$$P(t)={P}_{mathrm{tot}}-left({P}_{mathrm{tot}}-P(0)right)frac{{{k}_{1}e}^{-{k}_{2}t}-{k}_{2}{e}^{-{k}_{1}t}}{{k}_{1}-{k}_{2}}$$
We define activity in this case as ν = (1/k1 + 1/k2)−1, verifying that, if the equation is first order (that is, k1 ≫ k2), our previous definition of activity is recovered. We indeed find negligible change in the measured activities for NOC fluorescence curves between these two fits.
Tiling experiment activity correction
Each experimental condition in the tiling experiment was performed with four replicates: two technical replicates for each of the two shuffles of the 961-nt-long target sequence. While we found excellent agreement between technical replicates (Extended Data Fig. 3b), there was some variation between the results from each of the two target shuffles (Extended Data Fig. 3g,h). This variation was apparent in and correlated between the positive controls of crRNAs 1 and 10, which were always unoccluded (Extended Data Fig. 3c,g,h). We hypothesized that this variability results from small variations in target concentration in our different samples.
To correct for such variations, we sought to quantify how much each RNA sample differed from the mean. The RNA samples were divided into 192 sample conditions, each corresponding to a single oligo pool and one target shuffling, as described above (Extended Data Fig. 1c). Each of these 192 conditions was mixed with 24 assay conditions, corresponding to eight experimental crRNAs, two positive control crRNAs, one nontargeting crRNA, one no-crRNA control and two technical replicates of each.
For the two technical replicates of crRNAs 1 and 10 (that is, for each of the four positive control assay conditions of the 24 total assays), we considered the activity fit from the mean fluorescence curve, averaging over the 192 sample conditions (Extended Data Fig. 3b, black dashed lines). Then, for each sample condition and, for each positive control, we calculated the ratio of the control’s activity to its mean activity across all samples, obtaining an estimate of the degree to which that sample’s concentration deviated from the mean. We defined a correction factor as the average of these ratios. We then divided all activities measured for that sample by this correction. This activity correction not only decreased the spread of activities measured by the positive controls (Extended Data Fig. 3d–f) but also decreased the variance between measurements made on the two target shuffles (Extended Data Fig. 3g,h).
Mismatch discrimination
In Fig. 3d, we show the results of one simple metric by which to measure mismatch discrimination: the maximum of the ratio FPM/FMM, where FPM is the average fluorescence measurement across the perfectly matched conditions and FMM is that across the mismatched conditions. To account for the arbitrary offset of fluorescence, the minimum fluorescence measured across the NTC experiments was subtracted from both FPM and FMM before taking the ratio. As FPM and FMM are each measured as the average across three technical replicates, each measurement of FPM and FMM has an inherent error (σPM and σMM, respectively), which we quantify as the s.d. across the three technical replicates at each time point. The error of the ratio is then propagated as
$$frac{sqrt{{{{(F}_{mathrm{PM}}{sigma }_{mathrm{MM}})}^{2}+{(F}_{mathrm{MM}}{sigma }_{mathrm{PM}})}^{2}}}{{{(F}_{mathrm{MM}})}^{2}}$$
Elsewhere (Fig. 3e,f), we measure mismatch discrimination by a metric that relies on activity fits: log2(νPM/νMM). Thus, a mismatch discrimination of 1 indicates that the measured activity of the perfectly matched conditions is twice that of the mismatched conditions and a discrimination of 3 indicates that the perfectly matched conditions had eightfold higher activity than the mismatched conditions. We used a similar measure for discrimination at low allele frequencies (Fig. 3g), defining activity discrimination as log2(νf/ν0) where νf is the activity measured at allele frequency f and ν0 is the activity measured in the background alone.
Field-deployable variant discrimination
For the field-deployable results of Fig. 4, we implemented a method of activity discrimination that did not require curve-fitting. This method has two steps: (1) determine whether the sample is positive or negative for the RNA in question and (2) if positive, determine which variant is present.
For step 1, we tested whether the maximum fluorescence reached was higher than the fluorescence of the NTC. To avoid false positives, we used the maximum NTC value and, to account for NTC variability, inflated this number slightly when considering samples (multiplying it by 1.7). When two NTC conditions were assayed, we used one to determine this cutoff (and for normalization in step 2) and plotted the other.
Having determined which samples were positive, we then proceeded to discriminate among the variants. When more than two variants were present (Fig. 4c,j), we ensured that our assays did not saturate; thus, we were able to use final fluorescence values (at 180 min) as a measure of activity. We plotted ((F(c,t)-m)/left({{max}_{c}}right.) (F(c,t)-m)), where (F(c,t)) is the final fluorescence of crRNA c detecting target t and m is the maximum NTC value. In Fig. 4j, we set m to be the minimum fluorescence value of each target as the fluorescence curves were very far from saturation and relatively close to NTC.
When only two variants were being discriminated between (Fig. 4b,d–g,i), we used the fluorescence values at which discrimination was highest in place of the final fluorescence values in the above analysis. This enabled us to measure discrimination even for targets where both variants’ crRNAs saturated within the assay’s 180 min. To this end, for each target, we considered the ratio of fluorescence timeseries for the two crRNAs, (F_{{v}_{1}/{v}_{2}}(t)). We then took the logarithm of this curve, such that positive values imply that detection by one crRNA was higher and negative numbers imply that detection by the other crRNA was higher. We focused on the time point at which the absolute value of this number was maximal, with the caveat that, for each target, we neglected time points for which the maximum fluorescence across crRNAs was below the NTC threshold. In Fig. 4b,d,i, we show the fluorescence of each crRNA at this time point, plotted as in the other analogous panels as ((F(c,t)-m)/left({{max}_{c}}right.) (F(c,t)-m)), where (F(c,t)) is instead the fluorescence at the time point that maximizes discrimination. In Fig. 4e,g, we plot the maximum fluorescence reached for each target on the x axis and the maximum discrimination (which we denote ({log }_{2}left(F_{{v}_{1}/{v}_{2}} right))) on the y axis.
Equilibrium model
In an equilibrium model of crRNA–target hybridization, the target has a free energy ΔGu that depends on occluder conditions. We label the free energy of the crRNA–Cas13 complex as ΔGi (where the i represents ‘inactive’) and the free energy of the crRNA–Cas13–target complex as ΔGa (representing ‘active’). ΔGi and ΔGa are unknown parameters but are independent of the occluder. In equilibrium, the ratios of concentrations of reactants and of products are related to the differences in their free energies as follows49:
$$frac{[A]}{V[I][U]}={e}^{-(varDelta {G}_{{mathrm{a}}}-varDelta {G}_{mathrm{u}}-varDelta {G}_{mathrm{i}})/{k}_{B}T}$$
where ([A]) is the concentration of the crRNA–Cas13–target complex, ([I]) is the concentration of the crRNA–Cas13 complex, ([U]) is the concentration of the target, (V) represents the system volume, kB represents Boltzmann’s constant and T is the temperature in Kelvin. Assuming that the crRNA–Cas13 complex is in excess of the target, ([I]) is approximately a constant (independent of ([A])) and a conservation law requires ([A]+[U]={A}_{{rm{tot}}}) to be constant. Solving these two equations for the unknowns ([A]) and ([U]), we have
$$[A]={A}_{mathrm{tot}}/left(1+frac{{e}^{(varDelta {G}_{mathrm{a}}-varDelta {G}_{mathrm{u}}-varDelta {G}_{mathrm{i}})/{k}_{{rm{B}}}T}}{V[I]}right)$$
Our measured activity, ν, is proportional to ([A]) as defined previously: (nu =r[A]). There are two regimes to the activity curve. In the first, the first term in the denominator (unity) is dominant, leading to activity for short occluder lengths being roughly independent of the occluder length. The effective parameter (r{A}_{{rm{tot}}}) is set by the activity of Cas13 when presented with an unoccluded target. In the second regime, the second term in the denominator is dominant. In this regime,
$$log (nu )=log (r[A])approx frac{varDelta {G}_{mathrm{u}}}{{k}_{{rm{B}}}T}+log left(r{A}_{mathrm{tot}}V[I]{e}^{(varDelta {G}_{mathrm{i}}-varDelta {G}_{mathrm{a}})/{k}_{{rm{B}}}T}right)$$
Thus, in the second regime, the relationship between (log (nu )) and ΔGu is approximately linear. The free parameter represented by the second term shifts the line but cannot change its slope. The slope is set by the temperature of the system.
ODE model
We compared the binding rate of an invading strand to a target with and without an occluder in a model based on previous studies26,33. The model consists of a set of ODEs representing the flux into and out of states, where each state is defined by the set of base pairs formed. Transitions between states occur at a rate ke−ΔG where ΔG is the free energy barrier to the transition (in units of kBT where kB is Boltzmann’s constant and T is temperature in units of Kelvin) and k is an overall rate constant. An initial state consists of a target strand (bound to an occluding strand in the case where an occluding strand is considered), with an invading strand unbound. Initial binding of the invader strand to the toehold has a free energy barrier of ΔGa. The reverse step has a barrier of hΔGR, where h is the toehold length and ΔGR is the (absolute value of the) typical free energy of an RNA–RNA base pair.
In the no occluder case, subsequent forward steps (in which an additional base pair between target and invader forms) have a free energy barrier of 0, while reverse steps have a free energy barrier of ΔGR.
In the occluder case, the first step of the strand displacement reaction has barrier ΔGP + ΔGS − (ΔGR − ΔGD), where we subtract (ΔGR − ΔGD) from the models on which we base our work to account for the fact that, in our system, the invading strand is RNA while the occluding strand is DNA; ΔGD is the (absolute value of the) typical free energy of an RNA–DNA base pair. Subsequent forward steps in the strand displacement reaction have a barrier of ΔGS − (ΔGR − ΔGD), while backward steps all have a barrier of ΔGS. The barrier from the final state, in which the occluder has fully dissociated, back to the penultimate state has a barrier of ΔGDD.
Parameters were set following Irmisch et al.33 to ΔGa = 18.6, ΔGR = 2.52, ΔGs = 7.4, ΔGp = 3.5 and ΔGm = 9.5 (all in units of kBT) and an overall rate constant of k = 6 × 10⁷ s−1. We set ΔGD = 1.2 to be roughly half of ΔGR and ΔGDD = 25 to be large enough to prevent reassociation on the timescales considered. In Fig. 3b, we plot the results of h = 3, b = 27, with a mutation at the first position after the toehold.
Strand displacement model
In the strand displacement model; the amount of active Cas13 is not constant over the measurement window but is instead gradually increasing. Thus, because the initial conditions strongly affect the system behavior (as demonstrated experimentally in Fig. 2h) this is a nonequilibrium model. We denote the overall rate of Cas13 activation (multiplied by the concentration of the crRNA–Cas13 complex) by kslow to emphasize that this rate is slower than the rate of reporter cleavage. In this framework, the amount of fluorescent reporter P(t) depends on the amount of active target A(t). Using t0 to denote the time at which measurements begin, we have
$$P(t)={P}_{mathrm{tot}}-({P}_{mathrm{tot}}-P({t}_{0})){e}^{-{rA}(t)(t-{t}_{0})}$$
$$A(t)={A}_{mathrm{tot}}-({A}_{mathrm{tot}}-A({t}_{0})){e}^{-{k}_{mathrm{slow}}(t-{t}_{0})}$$
This predicts an overall sigmoidal behavior of the P(t) curves. In Fig. 1, the sigmoidal behavior is not apparent as the measurement window starts too late to see the initial sigmoidal behavior. However, the full sigmoidal behavior is apparent in various curves in Extended Data Figs. 5–10. For those curves where the full sigmoidal behavior is not apparent, the curves are well-approximated by exponentials. This can be understood in the context of this nonequilibrium model as, if activation is slow enough, the curves will appear exponential with a slope roughly proportional to the average concentration of active Cas13 over the measurement window. Mathematically, we integrate A(t) over the measurement window (which we denote as ranging from t0 to t0 + Δ) and divide by Δ to yield the average of A. Taylor expanding the exponentials in the slow-activation limit and keeping first-order terms, we arrive at
$$A(t)approx {A}_{{rm{tot}}}{k}_{{rm{slow}}}({t}_{0}+varDelta )$$
Thus, far from equilibrium, the activity is proportional to the rate of Cas13 activation. We now ask how structure affects this rate.
We consider a three-state model for Cas13 activation. Initial (toehold) binding has an association rate of kb and a dissociation rate of ku. Conversion from the toehold-bound state to active Cas13 has a rate k*. In this model,
$${k}_{mathrm{slow}}=frac{k^* }{1+frac{k^* +{k}_{mathrm{u}}}{{k}_{b}[I]}}approx frac{k^* {k}_{mathrm{b}}[I]}{k^* +{k}_{mathrm{u}}}$$
where the approximation assumes that kb is not sufficiently large that the reaction is effectively a single step.
Following previous work26, we assume that kb is structure independent. Structure can, therefore, affect ku (more structure makes the initial binding weaker, increasing ku) and/or k* (more structure increases the length of the strand displacement random walk, decreasing k*). We model the former as ku (propto exp (-L/{L}_{0})) where L is the toehold length and L0 is a free parameter. L0 is a free parameter (and is not determined directly by temperature) as the Cas13 enzyme may affect the strength of crRNA–target binding.
We model the effect of structure on k* by simulating 106 unbiased one-dimensional random walks of each different length (equal to the number of nucleotides of the protospacer occluded by structure) and setting k* ∝ 1/R, where R is the time it takes for the random walk to complete. As the probability of Cas13 not having dissociated within a time τ after activation is given by (e^{-{k}_{mathrm{u}}tau}), we can estimate the probability of Cas13 activation by integrating (e^{-{k}_{mathrm{u}}tau}), multiplied by the probability that the random walk completes at time τ, over all values of τ. More efficiently, the probability of Cas13 activation is calculated as (langle e^{-R/{R}_{0}} rangle) where the average is taken over all simulated random walks and R0 is proportional to 1/ku.
An equilibrium version of this three-state model cannot explain the initial-condition-dependent effects of structure and, furthermore, makes the prediction that Cas13 will be bound (in some form) to the target with near-100% probability unless almost the entire protospacer is occluded (that is >23/28 nt).
While a model accounting for the effects of structure on both ku and k* can fit the data, we find that the best fit is achieved when the effect on ku is dominant. Therefore, for simplicity, we present, in the figures, the model predictions assuming structure only affects ku. While ionic conditions (which differ between our initial data collection in Fig. 1 and the multiplexed data shown in Fig. 2) are expected to greatly affect overall rate constants and, therefore, must be refitted between the experiments, we hypothesized that the effect of Cas13 on crRNA–target binding strength will not be greatly affected. We, therefore, fitted L0 on the initial data of Fig. 1 (finding a best-fit value of L0 = 3.4) and did not refit it subsequently. Furthermore, we account for the asymmetry shown in Fig. 2 by multiplying ku by exp(1.7) when the toehold is on the 3′ end of the protospacer, as previous analysis found that such toeholds are 1.7 kBT more stable than toeholds from the other direction28. Therefore, our model predictions in Fig. 2 are the result of a fit with a single free parameter.
ITC
Catalytically inactive LwaCas13a (20 μl, 1.7 mM) was mixed with 10 nmol of crRNA 4 (multiplexed screen). The total volume was adjusted to 500 μl with Cas13 complexation buffer (600 mM NaCl, 50 mM Tris-HCl pH 7.5, 5% glycerol and 2 mM DTT) and allowed to complex at 37 °C for 30 min. The entire sample was then injected onto a Superdex 200 size-exclusion column. A minimal ITC buffer (200 mM NaCl and 100 mM Tris-HCl pH 7.5) was used to equilibrate the column, flush the loop and elute the sample. Three distinct peaks were eluted from the column, corresponding to the Cas13–crRNA complex, unbound protein and unbound crRNA. Fractions containing peaks suspected to correspond to the Cas13–crRNA complex were loaded on a gel and stained with SYBR gold and Coomassie blue to confirm the presence of protein and nucleic acid. These fractions were further dialyzed into ITC buffer overnight. Protein concentration was confirmed by absorbance at 280 nm. Occluded target RNA was prepared as described above in ITC buffer at a final concentration of 80 μM. The two species were loaded onto a Malvern MicroCal PEAQ-ITC calorimeter. Titration was performed using an initial injection of 0.5 μl of the occluded target RNA followed by 2-μl injections every 150 s for a total of 19 injections. Data collection and processing are automated, with user input of the binding stoichiometry, which was set to 1:1.
Reporting summary
Further information on research design is available in the Nature Portfolio Reporting Summary linked to this article.
Data availability
Additional data are available from GitHub (https://github.com/ofer-kimchi/Cas13-RNA-structure. Source data are provided with this paper.
Code availability
Code used to analyze data and generate figures is available from GitHub (https://github.com/ofer-kimchi/Cas13-RNA-structure).
References
-
East-Seletsky, A. et al. Two distinct RNase activities of CRISPR–C2c2 enable guide-RNA processing and RNA detection. Nature 538, 270–273 (2016).
-
Abudayyeh, O. O. et al. RNA targeting with CRISPR–Cas13. Nature 550, 280–284 (2017).
-
Gootenberg, J. S. et al. Nucleic acid detection with CRISPR–Cas13a/C2c2. Science 356, 438–442 (2017).
-
Cox, D. B. T. et al. RNA editing with CRISPR–Cas13. Science 358, 1019–1027 (2017).
-
Wang, H. et al. CRISPR-mediated live imaging of genome editing and transcription. Science 365, 1301–1305 (2019).
-
Yang, L.-Z. et al. Dynamic imaging of RNA in living cells by CRISPR–Cas13 systems. Mol. Cell 76, 981–997 (2019).
-
Schertzer, M. D. et al. Cas13d-mediated isoform-specific RNA knockdown with a unified computational and experimental toolbox. Nat. Commun. 16, 6948 (2025).
-
Abudayyeh, O. O., et al. C2c2 is a single-component programmable RNA-guided RNA-targeting CRISPR effector. Science 353, aaf5573 (2016).
-
Liu, L. et al. The molecular architecture for RNA-guided RNA cleavage by Cas13a. Cell 170, 714–726 (2017).
-
Metsky, H. C. et al. Designing sensitive viral diagnostics with machine learning. Nat. Biotechnol. 40, 1123–1131 (2022).
-
Wei, J. et al. Deep learning and CRISPR–Cas13d ortholog discovery for optimized RNA targeting. Cell Syst. 14, 1087–1102 (2023).
-
Wessels, H.-H. et al. Prediction of on-target and off-target activity of CRISPR–Cas13d guide RNAs using deep learning. Nat. Biotechnol. 42, 628–637 (2024).
-
Smargon, A. A. et al. Cas13b is a type VI-B CRISPR-associated RNA-guided RNase differentially regulated by accessory proteins Csx27 and Csx28. Mol. Cell 65, 618–630 (2017).
-
Mantena, S. et al. Model-directed generation of artificial CRISPR–Cas13a guide RNA sequences improves nucleic acid detection. Nat. Biotechnol. 43, 1266–1273 (2025).
-
Tambe, A., East-Seletsky, A., Knott, G. J., Doudna, J. A. & O’Connell, M. R. RNA binding and HEPN-nuclease activation are decoupled in CRISPR–Cas13a. Cell Rep. 24, 1025–1036 (2018).
-
Vargas, A. M. M. et al. New design strategies for ultra-specific CRISPR–Cas13a-based RNA-diagnostic tools with single-nucleotide mismatch sensitivity. Nucleic Acids Res. 52, 921–939 (2024).
-
Kuo, H.-C., Prupes, J., Chou, C.-W. & Finkelstein, I. J. Massively parallel profiling of RNA-targeting CRISPR–Cas13d. Nat. Commun. 15, 498 (2024).
-
Bandaru, S. et al. Structure-based design of gRNA for Cas13. Sci. Rep. 10, 1–12 (2020).
-
Turner, D. H. & Mathews, D. H. NNDB: the nearest neighbor parameter database for predicting stability of nucleic acid secondary structure. Nucleic Acids Res. 38, 2009–2011 (2009).
-
Simmel, F. C., Yurke, B. & Singh, H. R. Principles and applications of nucleic acid strand displacement reactions. Chem. Rev. 119, 6326–6369 (2019).
-
Radding, C. M., Beattie, K. L., Holloman, W. K. & Wiegand, R. C. Uptake of homologous single-stranded fragments by superhelical DNA. IV. Branch migration. J. Mol. Biol. 116, 825–839 (1977).
-
Zhang, D. Y. & Winfree, E. Control of DNA strand displacement kinetics using toehold exchange. J. Am. Chem. Soc. 131, 1–16 (2009).
-
Shortreed, M. R. et al. A thermodynamic approach to designing structure-free combinatorial DNA word sets. Nucleic Acids Res. 33, 4965–4977 (2005).
-
Fornace, M. E. et al. NUPACK: analysis and design of nucleic acid structures, devices, and systems. Preprint at chemRxiv https://doi.org/10.26434/chemrxiv-2022-xv98l (2022).
-
Welch, N. L. et al. Multiplexed CRISPR-based microfluidic platform for clinical testing of respiratory viruses and identification of SARS-CoV-2 variants. Nat. Med. 28, 1083–1094 (2022).
-
Srinivas, N. et al. On the biophysics and kinetics of toehold-mediated DNA strand displacement. Nucleic Acids Res. 41, 10641–10658 (2013).
-
Yurke, B. Using DNA to power nanostructures. Genet. Program. Evol. Mach. 4, 111–122 (2003).
-
Šulc, P., Ouldridge, T. E., Romano, F., Doye, J. P. K. & Louis, A. A. Modelling toehold-mediated RNA strand displacement. Biophys. J. 108, 1238–1247 (2015).
-
Zhang, D. Y., Chen, S. X. & Yin, P. Optimizing the specificity of nucleic acid hybridization. Nat. Chem. 4, 208–214 (2012).
-
Kocak, D. D. et al. Increasing the specificity of CRISPR systems with engineered RNA secondary structures. Nat. Biotechnol. 37, 657–666 (2019).
-
Haley, N. E. C. et al. Design of hidden thermodynamic driving for non-equilibrium systems via mismatch elimination during DNA strand displacement. Nat. Commun. 11, 2562 (2020).
-
Wu, Y. et al. A PAM-free CRISPR/Cas12a ultra-specific activation mode based on toehold-mediated strand displacement and branch migration. Nucleic Acids Res. 50, 11727–11737 (2022).
-
Irmisch, P., Ouldridge, T. E. & Seidel, R. Modeling DNA-strand displacement reactions in the presence of base-pair mismatches. J. Am. Chem. Soc. 142, 11451–11463 (2020).
-
Liu, Y., et al. LbuCas13a directly targets DNA and elicits strong trans-cleavage activity. Nat. Biomed. Eng. https://doi.org/10.1038/s41551-025-01424-6 (2025).
-
Taft, A. S. et al. Identification of mammalian-adapting mutations in the polymerase complex of an avian H5N1 influenza virus. Nat. Commun. 6, 7491 (2015).
-
Subbarao, E. K., London, W. & Murphy, B. R. A single amino acid in the PB2 gene of influenza A virus is a determinant of host range. J. Virol. 67, 1761–1764 (1993).
-
Guo, Y. et al. An emerging PB2-627 polymorphism increases the zoonotic risk of avian influenza virus by overcoming ANP32 host restriction in mammalian and avian hosts. J. Virol. 99, e008525 (2025).
-
Prior, I. A., Hood, F. E. & Hartley, J. L. The frequency of RAS mutations in cancer. Cancer Res. 80, 2969–2974 (2020).
-
Huang, L., Guo, Z., Wang, F. & Fu, L. KRAS mutation: from undruggable to druggable in cancer. Signal Transduct. Target. Ther. 6, 386 (2021).
-
Lee, J. K. et al. Comprehensive pan-cancer genomic landscape of KRAS altered cancers and real-world outcomes in solid tumors. NPJ Precis. Oncol. 6, 91 (2022).
-
Meeske, A. J. & Marraffini, L. A. RNA guide complementarity prevents self-targeting in type VI CRISPR systems. Mol. Cell 71, 791–801 (2018).
-
Wang, B. et al. Structural basis for self-cleavage prevention by tag:anti-tag pairing complementarity in type VI Cas13 CRISPR systems. Mol. Cell 81, 1100–1115 (2021).
-
Park, S. W., et al. Relative role of community transmission and campus contagion in driving the spread of SARS-CoV-2: lessons from Princeton University. PNAS Nexus 2, pgad201 (2023).
-
Um, S. et al. Human infection with avian influenza A(H9N2) virus, Cambodia, February 2021. Emerg. Infect. Dis. 27, 2742–2745 (2021).
-
Siegers, J. Y., et al. Genetic and antigenic characterization of an influenza A(H3N2) outbreak in Cambodia and the Greater Mekong subregion during the COVID-19 pandemic, 2020. J. Virol. 95, e0126721 (2021).
-
Kimchi, O., Cragnolini, T., Brenner, M. P. & Colwell, L. J. A polymer physics framework for the entropy of arbitrary pseudoknots. Biophys. J. 117, 520–532 (2019).
-
Smith, T. F. & Waterman, M. S. Identification of common molecular subsequences. J. Mol. Biol. 147, 195–197 (1981).
-
Zadeh, J. N. et al. NUPACK: analysis and design of nucleic acid systems. J. Comput. Chem. 32, 170–173 (2010).
-
Curatolo, A. I., Kimchi, O., Goodrich, C. P. & Brenner, M. P. A computational toolbox for the assembly yield of complex and heterogeneous structures. Nat. Commun. 14, 8328 (2023).
Acknowledgements
We thank B. Kang, B. Adamson, G. Goderski, R. Garmann and H. Dhaliwal, as well as the members of the C.M. and A.J.W.t.V. labs, for useful discussions. We thank Y. Wei and Y. Kang for providing cancer cell lines containing KRAS mutations. We thank the Dutch national sentinel general practitioner surveillance for acute respiratory infections (Nivel, Utrecht), the Dutch national A(H1N1)pdm09 influenza case finding program at National Institute of Public Health and the Environment, Bilthoven, and the Amsterdam and Groningen University Medical Centers for WT or NA-H275Y A(H1N1)pdm09 influenza virus samples. We thank Princeton University for its generous support of the clinical COVID testing laboratory and biorepository. The research reported in this manuscript was supported by National Institutes of Health grants DP2 AI175474 and R01 AI170520, Wellcome Trust and Royal Society grant 206579/17/Z and the Princeton Catalysis Initiative (to A.J.W.t.V.), National Institutes of Health grants R21 AI168808 and R01 AI182281, Centers for Disease Control and Prevention grant 75D30122C15113 and the Princeton Catalysis Initiative (to C.M.), funding from the Center for Health and Wellbeing (to A.J.W.t.V. and C.M.), the Peter B. Lewis ’55 Lewis–Sigler Institute/Genomics Fund through the Lewis–Sigler Institute of Integrative Genomics at Princeton University and the Branco Weiss Fellowship—Society in Science, administered by ETH Zürich (to O.K.). B.B.L. was supported by National Institutes of Health grants T32GM007388 and T32GM148739. C.H.L. was supported by National Institutes of Health National Institute of General Medical Sciences training grant T32GM007388 and a National Science Foundation graduate research fellowship DGE-2039656. L.T.N. was supported by the Princeton Omenn–Darling Bioengineering Institute Innovators program. A.M. and D.E. and the work conducted at Nivel and the National Institute of Public Health and the Environment were supported by The Ministry of Health, Welfare and Sport. The affinity measurements were conducted in the Princeton University Biophysics Core Facility.
Ethics declarations
Competing interests
O.K., B.B.L., O.R.S.D., A.J.W.t.V. and C.M. are coinventors on a patent application relating to this study. The other authors declare no competing interests.
Peer review
Peer review information
Nature Biotechnology thanks the anonymous reviewers for their contribution to the peer review of this work.
Additional information
Publisher’s note Springer Nature remains neutral with regard to jurisdictional claims in published maps and institutional affiliations.
Extended data
Extended Data Fig. 1 Multiplexing RNA secondary structure for Cas13-based assays.
a. Criteria used in the design of target RNAs for multiplexed detection assays. b. Histogram showing the minimum and total structure free energies of randomly generated RNA sequences, compared to the free energy of the two target RNAs used in the tiling experiment. c. NUPACK 3 predicted minimum free energy structures for the two experimental targets48. d. Overview of the multiplexed tiling experiment.
Extended Data Fig. 2 Activity profiles of Cas13 targeting occluded RNAs.
a–d. Cas13 activity as a function of occluder start position in each 96 nt target block; green shading represents protospacer. a: 28-mers. b: 21-mers. C: 14-mers. d: 10-mers. e–h. Same as A-D, with activities normalized to the non-occluded condition for each target block i. Activities of all negative control conditions. j. Activities as a function of occluder start position for a single target with all four occlusion lengths, normalized to the non-occluded condition. k. Effects of occluders on the activities of different Cas13 orthologs and spacer lengths: LwaCas13d complexed with a crRNA with a 28-nt-long spacer sequence (yellow), LwaCas13d with a crRNA with a 21-nt-long spacer sequence (red), RfxCas13d (green), and LbuCas13a (purple). Note on occluder nomenclature: occluders are named according to their start position from the 5’ end of the target block; all occluders here are 28nt in length. Occluder s19 binds to nucleotides 1-13 of the protospacer and extends into the 5’ flanking region, s31 binds to nucleotides 1-25 and extends slightly into the 5’ flanking region, s52 binds to nucleotides 18-28 and extends into the 3’ flanking region, and s61 binds to nucleotide 28 of the protospacer and extends into the 3’ flanking region. Lines in a–h, j, represent the mean, and error bars the standard deviation, of n = 4 replicates (two technical and two biological). Bar heights points in k represent the mean and error bars show the standard deviation of n = 2 technical replicates.
Extended Data Fig. 3 Controls and data normalization for multiplexed tiling assay.
a. Fluorescence curves for the set of experimental conditions chosen for the multiplexed tiling assay. b. Scatter plot showing activity correlation between technical replicates in the tiling experiment. c. Raw activity curves from the control (unoccluded) targets across all conditions in tiling assay. d. Cumulative histogram showing activity distribution for control target 1 before and after correction. e. Same as in d, but for control target 10. f. Dot plot showing activity correlations between the two control targets for all conditions before and after correction. g. Scatter plot showing activity correlation between the two target shufflings for all tested conditions, before and after correction. h. Histogram of ratio of activities of points of the two target shufflings, before and after correction, excluding negative controls. In d, e, h, represents standard deviation.
Extended Data Fig. 4 Strand displacement-based model accounts for asymmetries in occlusion pattern.
a–b. Correlation between activities resulting from 21-mer occluders and 28-mers occluding the same nucleotides. In a, 28-mers starting at positions 1, 4, 7, etc are matched with 21-mers starting at positions 3, 6, 9, etc; in b they are matched with 21-mers starting at positions 6, 9, 12, etc. c. Activity as a function of DNA occluder length for occluders of different lengths extending inwards from 3’ and 5’ ends of the protospacer. Strand displacement model predictions shown as dashed lines. Error bars show standard deviation of parameter fit. d. Data from tiling experiment plotted as in A and also including oligos occluding the middle of the protospacer (yellow). Small dots show individual data points from each crRNA; large dots show the mean and error bars show standard deviation across the 8 crRNAs. Model predictions shown as dashed lines. e. Ratio of activities resulting from 21-mer occluders targeting 3’ end of protospacer to those resulting from occluders targeting 5’ end, plotted as a function of occluder length. Each curve shows a different crRNA. Model prediction shown as dashed line. Lines show the mean, and error bars the standard deviation, across n = 4 replicates (two technical and two biological). Cumulative histograms of these data are shown in Fig. 2d. f. As in E, for 28-mer occluders. g. Isothermal titration calorimetry (ITC) data showing the differential power (DP) required to equilibrate the temperature of the reaction chamber in response to titration of 3’ occluded target RNA into a Cas13 RNP solution, which corresponds to the change in heat resulting from the binding that occurs. h. Binding curve derived by integrating the data shown in A with respect to time, yielding the enthalpy of interaction in kcal/mol as a function of molar ratio of the target RNA to the Cas13 RNP. The binding stoichiometry was set to 1:1.
Extended Data Fig. 5 Occlusion of target RNA and crRNA increase Cas13’s sensitivity to mismatches.
a. Bar charts representing Cas13 activity for perfectly-matched and mismatched targets when occluded by several different target-blocking occluders, as well as crRNA occluders and combinations thereof. Upper dotted line indicates activity saturation point; curves above saturation are not fit well by exponentials and therefore bars in this region are not accurate measurements of activity. b. Effects of crRNA occlusion and target occlusion, as well as both at once, on Cas13 specificity for two single mismatches and a double mismatch. c. NTC (no-target control) raw curves for conditions with and without a crRNA occluder. d. Raw fluorescence curves and fits for the data shown in a. In a–b, bar heights show the mean and error bars the standard deviation of n = 2 technical replicates.
Extended Data Fig. 6 Fluorescence curves from experiments probing Cas13 mismatch detection at low allele frequencies and varying target concentration with occlusion.
a. Raw fluorescence curves corresponding to Fig. 3d detecting presence of a mismatch at different target RNA concentrations with and without occlusion. Shaded regions show the range of fluorescence measurements for each condition across replicates. b. Raw fluorescence curves corresponding to Fig. 3g detecting mismatch detection sensitivity at decreasing allele frequency with and without occlusion. c: Raw fluorescence curves of a SHERLOCK assay detecting the Delta strain of SARS-CoV-2 at different concentrations. Data points show the mean and error bars show the standard deviation across n = 2 technical replicates. d: Comparison between normalized final fluorescence measured for KRAS variants (Fig. 4j) at different magnesium concentrations. Mean across n = 2 technical replicates is shown.
Extended Data Fig. 7 Mismatch detection using different types of occlusion.
Raw fluorescence curves corresponding to Fig. 3e-f detecting various mismatches within three different target sequences for no occlusion, target occlusion, crRNA occlusion, and target+crRNA occlusion conditions.
Extended Data Fig. 8 Fluorescence curves from Cas13 specificity matrix experiment with different types of occlusion.
Raw fluorescence curves corresponding to Fig. 3h using all possible crRNA and target nucleotides at a given position. Semi-transparent dashed lines show curve fits (see Methods).
Extended Data Fig. 9 Discrimination of IAV variants.
a: Fluorescence at 180 minutes is shown for different occluder modifications in absence of target (NTC=No target condition). b: Fluorescence curves for unmodified DNA occluders and occluders modified with a locked nucleic acid (LNA) at position 16. crRNA complementary to target shown as yellow circles, NTC as black squares. Data points represent the mean, and error bars represent the standard deviation of n = 2 technical replicates. c: Fluorescence curves corresponding to Fig. 4c. In c–e, each subplot shows results for different targets, with several targets sometimes grouped together in a single subplot and shown in different colors. Different crRNAs detecting these targets are shown as different line styles (solid/dashed/dotted). d: Fluorescence curves corresponding to Fig. 4f. e: Fluorescence curves corresponding to Fig. 4i.
Extended Data Fig. 10 Discrimination of SARS-CoV-2, IAV, and KRAS variants.
In a–d, each subplot shows results for different targets, with several targets sometimes grouped together in a single subplot and shown in different colors. Different crRNAs detecting these targets are shown as different line styles (solid/dashed). a: Fluorescence curves corresponding to Fig. 4b. b: Fluorescence curves corresponding to Fig. 4d. c: Fluorescence curves corresponding to Fig. 4e. d: Fluorescence curves corresponding to Fig. 4g. e: Fluorescence curves corresponding to Fig. 4j. Here, different crRNAs are shown as different colors, and each subplot corresponds to a single target.
Supplementary information
Source data
Rights and permissions
Open Access This article is licensed under a Creative Commons Attribution-NonCommercial-NoDerivatives 4.0 International License, which permits any non-commercial use, sharing, distribution and reproduction in any medium or format, as long as you give appropriate credit to the original author(s) and the source, provide a link to the Creative Commons licence, and indicate if you modified the licensed material. You do not have permission under this licence to share adapted material derived from this article or parts of it. The images or other third party material in this article are included in the article’s Creative Commons licence, unless indicated otherwise in a credit line to the material. If material is not included in the article’s Creative Commons licence and your intended use is not permitted by statutory regulation or exceeds the permitted use, you will need to obtain permission directly from the copyright holder. To view a copy of this licence, visit http://creativecommons.org/licenses/by-nc-nd/4.0/.
About this article

Cite this article
Larsen, B.B., Kimchi, O., Dunkley, O.R.S. et al. RNA structure modulates Cas13 activity and enables mismatch detection. Nat Biotechnol (2025). https://doi.org/10.1038/s41587-025-02868-6
-
Received:
-
Accepted:
-
Published:
-
DOI: https://doi.org/10.1038/s41587-025-02868-6