
Introduction
Contributions of nanobiotechnology to therapeutic health sciences have often caused a fundamental change in how the scientific community faces unsolved medical problems. Among many examples, amphiphilic lipid bilayer vesicles (published in 19641, approved in 1995 as Doxil2), PEGylation (published 19773, approved in 1990 as Adagen4 and lipid / nucleic acid nanoparticles (published in 19875, approved in 2018 as Onpattro6) have enabled, a few years later, the rapid emergence of PEGylated drug delivery systems. Under the pressure of a health global crisis, it is noteworthy that PEGylated drug delivery systems have been developed into high-performing and clinically viable medicinal products at unprecedented speeds, with a trajectory from pathogen identification to market authorization by regulatory agencies often years shorter than earlier nanotherapeutics timelines.
Such an inflationary expansion in nanomedicines’ clinical progression, that occurred around 20207, has unbalanced traditional working patterns for both industries and regulatory bodies and created novel challenges aimed to shorten bench-to-clinic timelines8.
With the manufacturers’ R&D departments propelled to high speeds by a vast injection of public funding, several post-production areas were conversely scaled-back and short-cut, e.g. pre-release pilot studies and product-quality testing. However, the dichotomy between timeliness and quality (that along with safety and efficacy stands as one of the main criteria used for drugs approval) must not be considered irresolvable, even at peak crisis. R&D and production processes of pharmaceutical products could be designed “a priori” to guarantee a built-in medical quality profile ensuring consistency and performance of the final product. Quality could be obtained in parallel with production rather than merely testing it serially afterwards. This is one of the core concepts in the “quality-by-design” (QbD) approach9. implementation in the pharmacological field is an extensive topic and it is duly described elsewhere10 but in general the process starts with the definition of a “prospective summary of the quality characteristics of the drug product that will be ideally achieved to assure the desired quality, at the desired safety and efficacy levels”, normally termed as quality target product profile (QTTP)11. The QTTP identifies a set of relevant critical quality attributes (CQAs) that affect product quality. CQAs in nanomedicines include both nanoparticles physical, chemical and biological properties (e.g. particle size distribution, stability, lipid composition, loading, surface properties etc.) as well as formulation process parameters that impact on product properties or quality. In nanomedicine formulations, the intricate interplay between formulation chemistry and formulation process parameters determines CQAs related to NPs’ composition, biophysical properties and, at length, biological activity. The complexity of these relationships requires a set of characterization techniques able to produce statistically meaningful correlations between lipid-based nanoparticle properties (CQAs) and their biological effects to guide decision-making in nanomedical products development. Analytical methods allowing control over critical nanomedicines design features have been developed for certain key aspects such as particle size distribution12 and drug loading and stability13 but also screening differences in CQAs among similar formulations14. In other areas of interest, for instance the surface chemistry of nanoparticles functional coatings, dedicated analytical methods are either lacking or highly dis-homogenous.
An important example of a difficult to determine CQA belonging to the surface properties subgroup is the integrity of the PEG(-lipid) coating. PEG coated nanoparticles, a.k.a. “stealth carriers”, represent the most common category in over-the-counter nano formulations and in R&D nanodrug products due to the ability of PEG chains to decrease carriers’ detectability and clearance by the immune system15. Therefore, validation and standardization of a methodology for measuring lipid-based NPs’ functional surface coating attributes is a major challenge for both regulators and R&D.
There have been so far a few experimental attempts to close this technical gap both analytically, in vitro and in vivo. Analytical techniques reported comprise: Fourier Transform infrared spectroscopy (FTIR)16, matrix assisted laser deposition ionization – time of flight mass spectrometry (MALDI-TOF MS)17, high performance liquid chromatography (HPLC)18 and nuclear magnetic resonance (NMR)19. However, most of these approaches rely on bulk NP analysis and lack surface specificity. An analytical technique able to measure functional coatings molecules surface densities in lipid-based nanoparticles is small-angle neutron scattering (SANS). By isotopic tuning of these nanoparticle structures with tail-deuterated phospholipids and using D2O as analysis medium to enhance contrast SANS allow to precisely probe at sub-nanometer scale molecular system attached inside or outside liposome bilayers20. Despite the fact that the large-scale character of neutron beamline facilities makes them impractical for routine R&D or regulatory studies these fundamental studies provide an excellent benchmark for testing the results of other, upcoming lab-scale analytical techniques. Despite the critical need of industry, regulatory and fundamental science actors for a suitable tool characterize the physical chemistry of nanomedicine surface coatings there is still a large analytical gap that requires innovative approaches.
Advanced surface chemical analysis techniques such as Time-of-Flight Secondary Ion Mass Spectrometry (ToF-SIMS), X-ray Photoelectron Spectroscopy (XPS) and visualization techniques such as transmission electron microscopy (TEM) offer the necessary depth of analyses to resolve chemical and spatial structure of nanotherapeutic particle coatings, providing that their internal organization is preserved during the transfer in ultra-high vacuum (UHV) analytical environment. Cryo-UHV characterization of liposomes and lipid nanoparticle’s structure has been demonstrated in several works based on transmission electron microscopy21, where carefully developed cryo-preparation methods allow to retain structural and dimensional properties of drug nanocarriers during the analysis. Similar protocols have been developed for surface chemistry analysis of biological interfaces using techniques such as ToF-SIMS22,23,24,25(notably including lipid nanoparticles (LNPs) depth profiling26) and XPS27,28,29.
In this work, we demonstrate the application of UHV- cryo- preparation and surface analysis techniques (ToF-SIMS) to qualitatively characterize the surface density of PEG chains on the outer surface of liposomal nanoparticles. In these proof-of –concept experiments, PEG coated liposomes were intentionally prepared with different nominal PEG-lipid molar concentrations in the starting formulation. For each formulation, size distribution and total lipid concentrations were assessed with DLS and HPLC, respectively. To directly evaluate the degree of incorporation of surface PEG functionalities on the formed liposomes functional coatings, the formulations were analyzed via cryo-ToF-SIMS. The methodology described in these experiment shows how application-relevant CQA’s in drugs nano formulations such as surface functionality densities can be semi-quantitatively measured via lab-scale surface analysis techniques, without resorting to large-scale facilities like neutron beamlines.
Results and discussion
Lipid-based nanoparticles formulation and quality control protocol
Controlled nanoprecipitation of lipid-based nanoparticles
Considering the complex biological barriers that oppose the drug delivery process, the issue of controlled nanoparticle design is paramount. Among crucial lipid-based nanoparticle parameters (size, shape, stiffness and surface composition; a.k.a. “the 4S”) affecting the biological response, the surface functionalization is probably the most influential and the hardest to control and characterize. As a proof-of-concept experiment for assessing a methodology to measure surface properties of liposomal nanomedicines, we selected a proxy for clinically relevant PEGylated liposomal formulation and varied the density of surface-grafted PEG chains to demonstrate the possibility of measuring CQAs in realistic conditions but without including the drug encapsulation step in order to reduce the chemical complexity of our model system. We employed a controlled nanoprecipitation approach for the bottom-up formulation of liposomes (small-size, unilamellar liposomes) with tunable surface properties using a commercial microfluidic system (see methods for details). The formulated empty liposomes were composed by POPC: Chol: DSPE-PEG2k (with a variable amount of steric stabilizer lipid DSPE-PEG2k mol% 3.0; 5.8; 8.5 and 15.5) obtaining a constant liposome size but an increasing final surface density of grafted PEG molecules within the different formulations. This specific formulation allowed to obtain a model liposomes system stable in large range of mol% values for DSPE-PEG, thus facilitating the study of varying surface functionalization The final product was purified in phosphate buffered saline solution (PBS). The choice of the four test PEGylated liposome formulations was designed a-priori to span across the two conformational regimes of PEG polymer chains with increasing PEG grafting density. The ratio between Flory dimension (Rf) and average grafting distance (D) for DSPE-PEG2k was calculated according to Labouta et al.30 and references therein. PEGylated liposomes in our experiment are designed to exhibit a Rf / D ratio spanning from 0.8 to 1.8 this covering both the non-interacting (or “mushrooms”, Rf / D < 1 ), transitional and the interacting (or “brush”, Rf / D > 1) regimes of surface PEG polymer chain organizations (see Table SI1 and figure SI1). The surface PEG layer conformation affects protein absorption on lipid-based nanoparticle surfaces. In the non-interacting regime the particle surface will only be partially covered with PEG and the POPC/Cholesterol bilayer will be partially exposed to the biological environment while in the interacting regime the surface will be mostly shielded by a conformal PEG chains corona that can sterically hinder protein binding and other biomolecule interactions. It has been observed that the PEG surface coating in the interacting regime can exhibit enough steric force to avoid liposome uptake from the mononuclear phagocyte system31.
Dialysis and preparation for UHV measurements
The overall formulation process can be divided in two steps: (i) formation of the liposome product by mixing organic and aqueous phases in the nanoprecipitation system, (ii) solvent exchange via dialysis to remove ethanol (in PBS or MilliQ water, depending on the subsequent experimental needs).Sample quality control measurements are performed at different formulation steps before committing to more time-consuming measurements in an UHV environment (TEM or ToF-SIMS). Standard controls in our protocol are liposomes’ particle size distribution determination (via DLS) and the total lipid composition measurement (via HPLC). The solvent exchange step to milliQ water is not necessary for therapeutic applications but in our protocol both cryogenic TEM and SIMS approaches will benefit from reduction of salts concentration in the original formulation buffer solution and thus lead to more robust characterization. ToF-SIMS spectra may be especially sensitive towards salts content due to cationization and matrix effects (see the supporting information section for more details)32. For this reason, a solvent exchange step involving dialysis in MilliQ water was implemented before analysis. Dialysis time was optimized to reduce buffer residuals concentration below 1%, by means of HPLC experiments.
Lipid-based nanoparticles size measurement
The consistency of the liposomes’ size distribution with expected formulation values must be verified within every formulation batch before tackling UHV-cryo-experiments. A straightforward way to assess the particle size distribution and solution sterility are DLS measurements that can be routinely executed in different liquid media at different steps of the protocol. Directly after formulation, our first formulation (POPC: Chol: DSPE-PEG2k 3.0 mol%) yields a liposome population with mean hydrodynamic diameter (Dz) of 87 ± 2 nm, full width at half maximum (FWHM) of 30 nm and polydispersity index (PDI) < 0.1 (according to intensity-based particle size distribution data). Batches showing either Dz values statistically deviating from the historical series average, high PDI values (e.g. PDI > 0.2 cut-off) and/or significant intensity in the Dz micron-size range were correlated to bad quality liposomal product and/or presence of impurities. A similar, DLS based size control experiment is normally run after dialysis to exclude adventitious contamination. In good quality batches, PDI values and (absence of) intensity in the 1–10 μm Dz range are normally the same as measured in buffer solution; however, after solvent exchange, Dz of liposomes is observed to increase up to 99 ± 4 nm, with similar FWHM and PDI. This is not a surprise since liposomes suspended in a hypo-osmotic solution (i.e. low external solute concentration, such as our dialysis conditions) will gain water from the exterior solution and swell33. In both cases, pre and post dialysis DLS measurements do not show a statistically relevant difference in size distribution between formulations with different PEGylated phospholipid concentrations (see figure SI2) indicating the absence of aggregates and/or non-vesicles material of different sizes in the material to be analyzed. In two cases out of 15 attempted formulations, the obtained liposomal products did not match the size distribution quality criteria, i.e. the sample was polydispersed showing secondary and tertiary distributions with average hydrodynamic radius > > 200 nm indicating the likely presence of aggregates and/or contaminations. In these cases, the samples were discarded without proceeding to further analysis.
To assess liposome morphology and confirm number-based size distributions measured via DLS, the formulated lipid nanoparticles were also analyzed via transmission electron microscopy. A cryo-TEM sample preparation and imaging method was used34 (see details in the methods section) to collect images of the sample in its most possible native state. Cryo-TEM approach is recognized to be one of the few direct imaging techniques that provides detailed structural and dimensional information of liposomes, enabling evaluation of the product’s homogeneity and structural integrity and purity with least possible distortions from material preparation35. However, due to the shortcomings of the cryo- approach for quantitative analysis, osmium tetroxide fixated TEM images of the samples were also collected as control experiments (see figure SI3-6) especially aimed towards statistical number-based distribution analysis of particles. The size distribution of nanocarriers is important as it can also affect their immunological interactions and pharmacokinetic behavior.

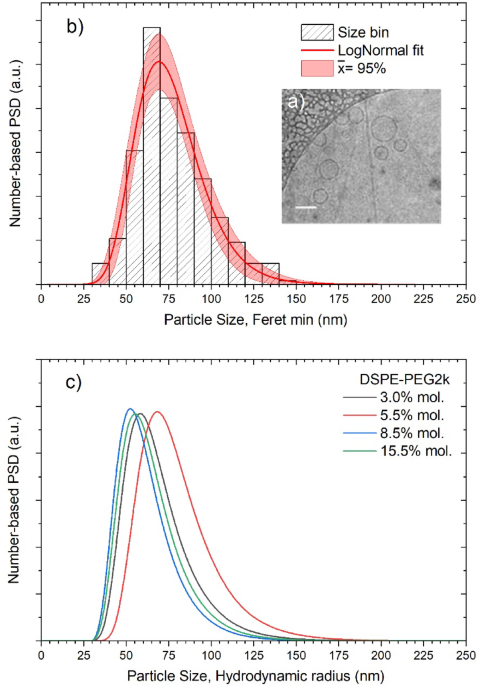
(a) Cryogenic TEM micrograph of the liposomes. Representative image of the liposomes with DSPE-PEG2k concentration of 3 mol % acquired in cryo-TEM mode at 120 kV; scale bar 100 nm. (b) Number based particle size distribution of liposomes (DSPE-PEG2k 3% mol.) derived by cryo-TEM imaging and size expressed as Feret min diameter (nm). Blue, size bins, total counts ca. 300 particles, three independent experiments. The red line shows the Lognormal fit to the data and corresponding 95% confidence level bands. (c) DLS intensity-based particle size distributions (hydrodynamic radius) for all formulations with varying DSPE-PEG2k concentration (3.0% 5.5% 8.5% and 15.5% mol.).
The detail obtained via cryo-TEM imaging allows a determination of liposome morphology and an evaluation of the phospholipid’s bilayer thickness. The liposomes observed in Fig. 1a exhibit smooth spherical morphology and a size compatible with the number-based particles distribution derived from negative staining imaging analysis (figure SI7) The thickness of the bilayer is estimated to be 8 ± 1.5 nm, from TEM images. These geometrical features are in line with other observations of similar systems by cryo-TEM20,21 and other techniques like SANS20,36 or qDIC37. Despite the small number of liposomal structures identified in vitrified cryo-samples (ca. 300 in three separate experiments), more than 99% of all observed particles showed unilamellar character, thus confirming another important liposomal quality attribute in this formulated product.
However, the morphological details of the functional coatings on liposomal surfaces are often difficult to resolve even in cryo-imaging due to low material density in the NP corona region yielding faint contrast. Isotopic labelling as contrast enhancement strategies can be improved in formulation built for this specific measurement20.
Figure 1b-c illustrates a comparison between NPs size distributions derived from TEM images (Feret min) and from DLS experiments (hydrodynamic radius and number-based size distributions) for different LPNs formulations with the same POPC/Cholesterol ratio but different PEGylated phospholipid content (i.e. nominally yielding the same bilayer structure but different functional coatings surface densities). Considering the experimental uncertainties and batch-to-batch reproducibility errors in the liposomes formulation there is a remarkable agreement between the overall characteristics of the particle size distributions obtained with the two methods. (see supporting information discussion, figure SI6). Both methods report a size distribution for POPC: Chol: DSPE-PEG2k 3.0 mol% liposomes peaking in the 60–70 nm interval (using 10 nm wide size bins) and spanning from a minimum of 30 to a maximum of 130 nm. Morphological differences in PEG coatings are considered difficult to estimate or separate with statistical confidence from NP sizing data in both cryo-TEM and DLS experiments. For this reason, differences in size distribution characteristics for formulations with different DSPE-PEG2k content (Fig. 1b) are attributed to experimental fluctuations in the formulation and measurement process rather than to measurable sample differences.
Total lipid concentration measurement by HPLC-CAD
High Performance Liquid Chromatography (HPLC) coupled to a Charged Aerosol Detector (CAD) allows efficient separation and accurate quantification of individual lipid components in liposomal formulations. The linearity of the CAD response in the mass-flow range of interest (i.e. 5 to 300 µg mL-1) was verified for POPC, Cholesterol and DPSE-PEG2k standards. The calibration curves are presented in Figure SI8a-c. Dialyzed liposomal formulations were injected in the HPLC system following methanol-based solubilization of the individual lipids. The chromatograms of the four liposomal formulations containing increasing DSPE-PEG2k quantities are presented in Figure SI9. The concentrations of the three individual lipids and the total lipid concentrations are plotted as a function of the nominal DSPE-PEG2k molar concentration in Fig. 2a. The concentration ratios between the individual phospholipids (POPC and DSPE-PEG2k) and cholesterol are shown in Fig. 2b. It is important to note that HPLC-CAD analysis cannot distinguish between DSPE-PEG2k derived from PEG chains facing the internal or external surface of the liposomes, as the liposomes are completely disrupted during the methanol-based solubilization step prior to injection into the HPLC system. For liposome formulation methods derived from a co-extrusion approach, this possibility has been experimentally verified38,39. It is important to distinguish the amount of internalized PEG chains since their amount decreases formulation efficiency, interferes with cargo internalization and does not contribute to drug-carrier shielding in its operational environment. The liposome formation yield (by mass) during formulation ranged from 32 to 70% depending on the PEGylated phospholipid concentration. The yield of the final product is calculated for the whole formulation process and represents the sum of assembly efficiency losses in the nanoprecipitation system and losses due to dialysis. The analysis of the contribution of each lipid in Fig. 2a showed that while the concentration of the structural lipids of the bilayer (POPC and cholesterol) changed only slightly between the different formulations, the total mass increase was mainly determined by the incorporation of an increasing fraction of DSPE-PEG2k into the liposome structure. Therefore, similarly to the total lipid concentrations of the four different liposomal formulations, the concentration of DSPE-PEG2k detected in the liposomes increases with increasing nominal DSPE-PEG2k concentrations (from 3 mol% to 8.5 mol% while remaining constant at the highest nominal DSPE-PEG2k concentration (15.5% mol%).

(a) Total (green triangles) and individual lipid concentrations from HPLC measurements for POPC: Chol: DSPE-PEG2k liposomes formulations with 3/5.5/8.5/15.5 mol% DSPE-PEG2k. (b) concentration ratios for POPC/CHOL and DSPE-PEG2k/CHOL.
Lipid based nanoparticles functional coating characterization
Cryo ToF-SIMS method design for PEGylated lipid-based nanoparticles
After the formulation and dialysis steps and following positive results for particle size distribution and lipid concentrations in the quality control experiments (DLS and HPLC) the samples’ surface chemistry was characterized by cryo ToF-SIMS experiments. Sample transfer into UHV chamber was executed utilizing a fast-freezing protocol adapted from Shchukarev et al.,29,40 see methods section for the details. For water-based systems like liposomes, the cryogenic approach has the important benefit of preserving the structural organization of these soft nanoparticles in the UHV analytical environment of the ToF-SIMS spectrometer and allow to study intact solid-aqueous interfaces, in analogy with the cryo-TEM approach. The ToF-SIMS experiment was designed as follows: first the three individual molecular components of the liposome’s formulations (phospholipid, PEGylated phospholipid and cholesterol) were analyzed, as thin films drop casted on Si substrates, using a Bi3+ primary ion beam. The mass spectra (both positive and negative) were analyzed for each material and three separated peaks list were created (with approx. 150 entries for each sample), in a supervised fashion, containing the characteristics fragmentation patterns and mass spectral fingerprint of each biomolecule. In the case of two phospholipids some spectral overlap was observed, since characteristics fragments of the phosphocholine headgroup, CxHyPNOz, were identified in both POPC and DSPE-2kPEG spectra. PEG chain characteristic CxHyOz fragments, monomers, di- and trimers were mainly found in the DSPE-2kPEG spectrum while full cholesterol molecule and dimers peaks were observed in the corresponding spectrum. Hydrocarbon fragments (CxHy) were observed in all samples. Weak signals of the full POPC and DSPE (without PEG chain) molecules were also detected in the corresponding samples. A selection of the characteristic peak assignments for all peak lists is given in table SI2, including the individual loadings values for the first three PC. The three individual peak lists were merged (logical union operation, {A}∪{B}∪{C}, resulting in ca. 320 unique entries) and the resulting list {M} was used to analyze the mass spectra recorded from liposomes samples formulated with different PEG mol% content using a Principal Component Analysis (PCA) approach41,42.
Cryo ToF-SIMS characterization of different PEG-coated LNPs
All spectra obtained from the experiment were mass calibrated and analyzed together using the same merged peak list {M}. The spectra ensemble used for MVA-PCA analysis comprised the three individual molecule films (POPC, DSPE-PEG2k and Cholesterol), a control sample of liposomes formulated with 3 mol%, a film of DSPE-PEG2k in PBS directly dried without cryogenic transfer on the substrate before dialysis, a second control sample of liposomes (again DSPE-PEG2k 3 mol% but in mQ-H2O) dried on the substrate after dialysis and the series of four liposome formulations formulated with increasing DSPE-PEG2k content measured cryogenically after dialysis. For every sample type at least 8 mass spectra replicates were recorded. Some information about chemical differences in the functional coatings of different liposomal formulations can be gained by comparing intensities of individual mass peaks corresponding to specific diagnostic ions assigned to DSPE-PEG2k, POPC or Cholesterol molecules fragmentation patterns. An example is given in Fig. 3, were the spectra of the four liposomes are compared. Figure 3a shows the m/z region from 35 to 65, this portion of the spectrum includes the [C3-4Hy+] hydrocarbon clusters, common to all samples, several DSPE-PEG2k diagnostic ions of the form [C2-3HxO+] (most notably [C2H5O+] (45.03 m/z, PEG monomer + H) and [C3H7O+] at 59.05 m/z) and several POPC diagnostic ions of the form [C2-3HyN+] (most notably [C3H9N+] at 59.07 m/z. Some minor peaks originating from buffer solution ions and substrate are also present. This portion of the spectrum includes over 50 chemically assigned peaks, see Table SI2 for the complete peak list). Figure 3a shows that, while the relative intensities of hydrocarbon clusters [C3-4Hy+] and alkali ion [K+] peaks do not change drastically across the different samples the relative intensity of the [C2H5O+] (45.03 m/z, PEG monomer + H) peak increases with increase in molar concentration of DSPE-PEG 2k in the corresponding formulation. This behaviour is shown in more detail in Fig. 3b, highlighting the m/z = 45 mass region and showing the intensity increase of the [C2H5O+] peak while the nearby [CHS+], assigned to adventitious contamination, remains approximatively constant. A similar behavior can be seen in Fig. 3c, showing the mass region at m/z = 59. This spectral portion is particularly interesting due to the presence of three chemically identified peaks, [C3H9N+] at 59.07 m/z, diagnostic ion for POPC molecule coming from the fragmentation of the PC headgroup, [C3H7O+] at 59.05 m/z diagnostic ion for DSPE-PEG2k coming from the fragmentation of the PEG chain and [SiC2H7+] at 59.03 m/z, a molecular fragment coming from the substrate. Figure 3c shows how, for formulations incorporating increasing amounts of DSPE-PEG2k the relative intensities of these peaks change accordingly. While the substrate ion [SiC2H7+] intensity remains approximatively constant across all samples, the ratio between the two molecular diagnostic ions [C3H7O+] / [C3H9N+] increases with increasing DSPE-PEG2k content in the formulation. In particular, [C3H7O+] / [C3H9N+] < 1 for DSPE-PEG2k mol% below 5.5 and [C3H7O+] / [C3H9N+] < 1 and practically constant for DSPE-PEG2k mol% > 8.5. These behaviors suggest a PEG chain dominated surface chemistry for the two latter liposomal formulations while POPC appears to be more abundant than DSPE-PEG2k in the two former samples.

ToF-SIMS mass spectra comparison for liposomal formulations with different DSPE-PEG2k mol% content. Normalized intensity is calculated using total ion intensities. Panel (a) mass region m/z = 35–65, the regions enclosed in red dot lines are expanded in the following panels, (b) m/z = 44.90–45.10 mass region of the DSPE-PEG2k diagnostic ion [C2H5O+], (c) m/z = 58.97–59.17 mass region of the DSPE-PEG2k diagnostic ion [C3H7O+] and POPC diagnostic ion [C3H9N+].
However, considering the presence in the mass spectra of over 300 chemically identified peaks from the formulation’s molecules (not counting ca. 50 other peaks from salts, adventitious impurities and substrate), a univariate approach such as the one described in Fig. 3 is impractical. The mass spectra were therefore analyzed using a multivariate approach based on PCA.
The first two principal components (PC) loadings plots obtained from PCA analysis of these spectra ensemble are shown in Fig. 4 (for positive ions spectra). PC1 in the upper panel accounts for 61.3% of the dataset variance while PC2, in the lower panel, accounts for 29.5% (total PC1 + PC2 = 90.8%). In the graphs the individual loadings are color coded and grouped according to similar chemical structure and according to their likely origin from a specific molecular fragmentation pattern. In light blue are marked loadings corresponding to fragments with the structure [CxHyOz+], assigned to the PEG chain of DSPE-PEG2k. Some representative elements of this group are [C2H3O+] (43.01 m/z), [C2H5O+] (45.03 m/z, PEG monomer + H), [C3H7O+] (59.05 m/z), [C4H7O+] (71.04 m/z, PEG dimer – OH), [C4H7O2+] (87.04 m/z, PEG dimer – H)42,43.
In red are marked the loadings corresponding to fragments with the structure [CxHyPNOz+], these loadings describe the fragmentation of the phosphocholine headgroup present in both phospholipidic molecules, POPC and DSPE-PEG2k. The most representative loadings in this group are [C3H8N+] (58.06 m/z), [C5H12N+] (86.09 m/z), [C5H14NO+] (104.11 m/z, choline – H), [C5H13PNO3+] (166.06 m/z), [C5H15PNO4+] (184.06 m/z, phosphocholine – H). Ions fragments originating from phosphocholine headgroups can be used to tag, in principle, both POPC and DSPE-PEG2k surfaces. When the liposomes structural organization is preserved intact during the analysis as in cryogenic measurements, (see cryogenic TEM image, Fig. 1a) DSPE-PEG2k molecules will be incorporated in the lipid bilayer with the hydrophobic fatty acid tails pointing inside the bilayer and the hydrophilic PC headgroup plus the 40-monomers long polymeric PEG chain pointing outside the bilayer (either on the outer side of the liposome surface or on the inner side, towards the liposome interior). For PEG chains located on the outer surface of the liposome their spatial extension can be calculated30 in the different grafting density regimes. PEG chains in the liposome’s corona lie the closest to the phospholipidic surface in the non-interacting, or mushroom, regime and a conservative estimation for the patched PEG layer thickness in our thinnest case (3 mol%) yields ca. 3.2 nm. Using Bi3+ clusters at 25 keV as primary ion beam the average depth of analysis in our ToF-SIMS measurements is approximately 3 nm, therefore it is possible to consider PC headgroups ion fragments as specific of phospholipidic (POPC) surfaces and PEG polymers ion fragments as specific of PEGylated phospholipid surfaces (DSPE-PEG2k) without substantial chemical interference. [CxHyOz+] fragments are used as diagnostic ions for DSPE-PEG2k exhibiting PEG chains organized outward with respect to the liposome surface while [CxHyPNOz+] fragments are used as diagnostic ions for POPC. In Fig. 4, POPC specific ions fragments from phosphocholine headgroup are marked in red, while DSPE-PEG2k specific ions fragments from PEG polymer chain are marked in light blue.

PCA loading plots for the set of liposomes samples and individual ingredients control films. Individual loadings are color coded and grouped according to similar chemical structure and according to their likely origin from a specific molecular fragmentation pattern. More important chemical assignments for selected loadings are indicated in the graph.
For the last component of the formulation, cholesterol, there is significant chemical uncertainty in the identification of the fragmentation patterns using the lower-weight hydrocarbons due to the overlap with ion fragments originating the fatty acid hydrophobic tails of phospholipids in the liposome’s bilayer, considered up to [C18Hx+] in the case of these experiments. For cholesterol the most important specific fragments used to avoid identification ambiguities are [C27H45+] (369.38 m/z, cholesterol – OH), [C27H45O+] (385.35 m/z, cholesterol – H) and [C54H89O+] (753.77 m/z, cholesterol dimer – OH)44. Cholesterol specific ion fragments are marked in dark green in Fig. 4. All other ion fragments considered in the loadings plot of Fig. 4, mainly hydrocarbons of the form [CxHy+], x = [1…18], are grouped and marked with a different color according to number of C atoms.
Analyzing the correlations shown in the loadings plot (Fig. 4) it is noted that in principal component PC1 loadings corresponding to fragments with structure [CxHyOz+], associated to the PEG chains of DSPE-PEG2k molecules are strongly correlated and show high positive loadings while both characteristics loadings from POPC phospholipid ([CxHyPNOz+] group) and cholesterol show negative correlations. In contrast, principal component PC2 shows positive PEG and cholesterol related loadings and strongly negatively correlated POPC related loadings. Hydrocarbon related loadings with structure [CxHy+] are observed to be either positive or negatively correlated in both PC of Fig. 4. More specifically, it is noted in both components that loadings of heavier fragments (clusters from [C7Hy+] or heavier) always show the same correlation as cholesterol specific loadings while loadings of lighter fragments (clusters from [C3Hy+] or smaller) never show the same correlation as the heavier ones. Moreover, it is observed that in these two groups loadings within the same cluster (same number of C atoms, same color group) always exhibit the same loading sign and only in the intermediate group ([C4-6Hy+]) individual loadings within the cluster can have either positive or negative values. The interpretation of this behavior can be linked to the fragmentation patterns arising from the different molecular structures of cholesterol and of the fatty acid tails in the phospholipids. Heavy fragments from x > 7, [CxHy+] clusters are associated fragments from cholesterol aromatic structures while lighter fragments with x < 3 are likely more efficiently generated from the fragmentation of aliphatic chains in phospholipids’ fatty acids tails.

PC1 vs. PC2 scores plot indicating surface composition characteristics obtained from PCA of TOF-SIMS data.
The relationship between the different samples in this model experiment is better explained by looking at the scores plot of PC1 and PC2 shown in Fig. 5. According to the chemical interpretation of the PC1 and PC2 loadings given above the characteristic points of the surfaces of the three individual ingredients in our formulations define three ideal directions in the score plot plane. Data cluster from DSPE-PEG2k surfaces, being strongly correlated to PEG monomer fragments [CxHyOz+], shows positive scores on PC1 axis (I° quadrant). Cholesterol films have positive scores on PC2 axis and negative on PC1 (IV° quadrant), reflecting the two components’ correlations with [C27H45+] and [C27H45O+] loadings. POPC phospholipid has negative scores on PC2 (III° quadrant), as derived from the strong negative correlation of phosphocholine fragments loadings on that component (Fig. 3).
The position of the data clusters arising from individual molecule films can be used for interpretation of the data-clusters obtained from liposomal formulations mass spectra. First we consider the internal control samples, the green and violet data-points clusters represent the surfaces of liposomes formulated with 3 mol% DSPE-PEG2k (in PBS and dialyzed to MilliQ water respectively) when the micelles are transferred to the UHV analysis chamber without the cryogenic preparation step, but simply drop-casted and dried on the substrate surface. In this case, we assume that capillary forces acting on the liposomes structure upon drying and the quick evaporation of the water phase inside and outside the bilayer disrupt their structural organization leaving a continuous, homogeneous deposit on the substrate surface. For both dried liposomes surface the datapoint clusters on the scores plot lie in proximity of the POPC phospholipid cluster, aligned on the POPC-Cholesterol direction. This is coherent with the interpretation of disrupted liposomes forming a homogenously mixed surface where the chemistry is dominated by their most abundant components (mainly phospholipids in our case where both POPC and DSPE-PEG2k randomly oriented at the surface can contribute). In this case, spectral intensities and their contribution to PCA loadings can be considered roughly proportional to the molar concentration of the individual molecules in the formulation recipe. The slight variation between the scores clusters of dry liposomes formulated in PBS or in MilliQ water is attributed to peak intensities differences arising from cationization of molecular fragments with salts ions (mainly Na+, K+, Ca+) present onto the surface.
It is interesting to note how drastically the score values change when the same sample (POPC: Chol: DSPE-PEG2k liposomes with 3 mol% PEG lipid concentration) is analyzed after cryogenic sample preparation. Fast-freeze liposomes measured via cryo ToF-SIMS exhibit marked spectral differences with respect to measurements done on dried films. This is attributed to the fact that, in the cryogenic experiment, the molecules forming the liposomes maintain their spatial organization and therefore the signal must be determined mainly by the outer molecular layers, i.e. proportional to the surface densities of outwardly facing functionalities.
The scores of cryogenically measured 3% mol. PEG liposomes cluster at the center of the scores plot for PC1 and PC2 (Fig. 5) are statistically well separated from the corresponding dried sample and these datapoints lie now midway on the direction between the POPC phospholipid model surface and the DSPE-PEG2k model surface. Relative to the dried case, both PC1 and PC2 scores increased towards positive values and the cryo measurements cluster shifted towards the I° quadrant. This shift indicates a substantial change in the chemical composition of the surface, which is now characterized by a marked PEG character. Further proceeding to analyze the series of PEGylated liposomes measured in cryo-mode the scores of the different formulations with increasing PEG contents are observed to follow a similar behavior on the PC1/PC2 scores plot in Fig. 5. All datapoint clusters for different PEG formulations are in the same region of the PC1/PC2 scores plot, midway between the phospholipid and the PEGylated phospholipids representative areas. The clusters lie close to each other, but they are statistically separated (more than 2-sigma in both directions, i.e. 95% confidence) indicating that for all systems the nanoparticle surfaces are characterized by a roughly similar but not identical PEG character. A closer look also reveals that these points do not shift randomly but they are arranged in an organized manner. The formulations with more PEG content in the initial recipe are characterized by data clusters with higher scores on both PC1 and PC2 or, equivalently, they occupy a position closer to the DSPE-PEG2k model surface cluster. This behavior of the PEGylated liposome data clusters on the score plot is interpreted as follows: higher DSPE-PEG2k mol% concentration in the initial formulation recipe led to higher incorporation of PEGylated phospholipid in the liposomes and therefore a higher surface density of PEG chains appears on the outer liposome surfaces. This trend is captured by the PCA analysis of ToF-SIMS data when intact liposomes are analyzed in cryo-mode. Moving from the “non-interacting” to the “interacting” PEG chains regimes (see Figure SI1-inset), (i.e. with flexible mushroom like polymer chain conformations and possible gaps between PEG molecules or brush like dense structure with no gaps on the outer surface of liposomes) the surface chemistry shifts from a situation where POPC and PEG molecules are both present to a scenario where the surface is fully covered with PEG. Using PCA analysis, these differences in surface chemistry of the different liposomes can not only be distinguished but also qualitatively evaluated, starting from measured cryo ToF-SIMS spectra.
Negative SIMS spectra suggest similar interpretation as the positive but with less clear separation between sample scores. These data are not discussed here for sake of conciseness.
Deriving structure—composition relationships

PC1 scores obtained from ToF-SIMS data analysis (left axis) compared to DSPE-PEG2k nominal (red circle) and measured with HPLC (blue squares) concentration (right axis). Concentrations are normalized to values from POPC: Chol: DSPE-PEG2k liposomes formulations with 3% mol. DSPE-PEG2k.
The cluster scores on the PC1 component for the PEGylated liposomes samples series are also plotted in Fig. 6 (gray boxplot, left y-axis) together with the nominal DSPE-PEG2k mol% concentration in the formulation recipe (red circles, right y-axis) and with the concentration of DSPE-PEG2k measured by HPLC (blue squares, right y-axis). All data values are normalized to the PC1 mean score value for the POPC: Chol: DSPE-PEG2k liposomes with 3% mol. PEG lipid concentration. These three quantities are related to PEG concentration in different locations. Nominal DSPE-PEG2k concentration is related to the total amount of PEG in the product solution, bound in liposomes and unbound. HPLC data instead are related to the total concentration of PEGylated phospholipids incorporated within the whole liposomal structures (either on the inside or the outside of the bilayer); finally, SIMS data are correlated to the surface density of PEG chains present only on the outer surface of the liposomes. Data in Fig. 6 shows that while PEG concentration in the formulation solution increases linearly both liposome-bound PEG (HPLC) and surface grafted PEG chains (SIMS) exhibit a saturation type behavior starting from the formulation with 8.5% mol. PEG. This suggests that after a certain point raising the DSPE-PEG2k concentration in the formulation solution yields no or little increase in the concentration of inserted PEG on the liposome’s surfaces. Moreover, the relative increase PEG content is roughly similar between HPLC and SIMS data, suggesting that, in all conditions, most of the DSPE-PEG2k is incorporated in the bilayer structure with the PEG chains pointing outwards. It is also interesting to compare the results of Fig. 6 with the model design calculations of Table SI1 and figure SI1. Liposome formulations with 8.5% and 15.5% mol. DSPE-PEG2k concentration are expected to exhibit a surface PEG chain configuration in the interacting (or “brush”) regime with calculated Rf/D values well above unity and 100% surface coverage, i.e. fully formed PEG corona around the liposome bilayer. The average values of the PC1 scores clusters for these two points show a slight increase that could be possibly related to a slight densification of the PEG chains surrounding the liposome when more PEGylated lipids are available during the liposome formation. In theory, the two formulations at 3 mol% and 5.5 mol% DSPE-PEG2k concentration do not have enough PEGylated phospholipids in the formulation mixture to achieve full surface coverage and therefore the liposomes expected to be in the non-interacting, or “mushrooms”, regime. In these configurations the surface coverage is calculated to be below unity and the liposomal PEG corona shows empty spaces or patchy coating morphology. Even considering the limitations of the calculations used in this work it is interesting to note how cryo-SIMS measurements can qualitatively follow structural transitions in the surface coating morphology of different liposomal formulations. Scores in PC1 are just one of the possible metrics that can be used for such a qualitative description of the grafted PEG density on the outer liposomes shell. The increase in PEG surface coverage is therefore related to the increase of such values while the formation of a complete PEG corona results in saturation of the indicator. The intersection of the two trends indicates, in terms of the nominal synthesis parameters, the point of transition between the non-interacting and the interacting regimes.
Conclusions and outlook
In this work, we presented and discussed a methodology based on cryo ToF-SIMS analysis for qualitatively assessing grafted molecules surface density of LNPs functional coatings. As proof-of-concept experiment we describe the full experimental workflow, starting from controlled liposome formulation via nanoprecipitation approach, followed by quality control measurements via cryo-TEM, DLS (NPs size) and HPLC (total lipid concentration) and finally the surface chemical analysis of intact liposome outer layers with cryo ToF-SIMS. In this work an application relevant PEGylated liposomes formulation was used, varying the amount of PEG phospholipid in the formulation recipe. Processing of mass spectral data using a MVA-PCA approach allowed to extract qualitative surface chemistry descriptors unique of the organized PEG coating on the outer shell of the liposomes lipid bilayer in their native state. In our model experiments, it was possible to analytically distinguish between liposomal formulations with different PEG coatings. Moreover, the SIMS surface chemistry descriptor values were found to be proportional to surface density of grafted PEG functionalities and it was possible to use it to qualitatively capture the transition behavior between different regimes in the coating structural organization (i.e. from non-interacting, “mushroom” regime to interacting or “brush” regime).
The development of low-end analytical techniques for surface chemistry and composition of functional coatings of lipid-based nanoparticles in a hydrated environment are of great importance for the development of nanomedicine systems. A precise assessment of the physical-chemical properties of this kind of particles is a crucial tool for formulation development, quality control and to support interpretation of in vitro and in vivo data. To resolve the divergence between timeliness and quality, decision-making in nanomedicine development needs statistically significant correlations between design principles and biophysical properties, resulting from robust analytical methods.
The proposed method based on cryo ToF-SIMS has the potential to detect a wide variety of grafted molecules and could therefore be applied to the large variety of emerging LNPs functional coatings, beyond PET (such as protein-based functional coatings aiming to selectively target diseased cells to boost efficiency/reduce toxicity)46.
On the other side, quantitative measurements are challenging using SIMS and normally require carefully prepared materials and calibration experiments. Recently another cryogenic surface analysis approach, based on XPS28 demonstrated the possibility of quantitatively characterizing liposome surface chemistry and the degree of coverage of functional coatings of lipid-based nanoparticles systems. However, this is possible only when a unique chemical signal (i.e. an element or a bond type, resulting in a specific, non-overlapped component in the photoelectron spectrum) is present either in the coating and not in the bilayer, or vice versa. This approach is easier when NP systems exhibiting inorganic core and organic corona are studied47. The methodology proposed in this paper and the XPS approach share a vast common ground in terms of materials handling, preparation and fundamental know-how. They complement each other in terms of strength and weaknesses and could be envisioned as a powerful tandem to address the lack of analytical methodologies for determining nanomedicine surface coatings’ properties.
Experimental methods
Liposome nanoprecipitation
Formulation materials were purchased from Merck/Avanti Lipids and stored dried at − 20 °C in a refrigerator, care was taken to avoid stock vials contaminations. (A) 1-palmitoyl-2-oleoyl-glycero-3-phosphocholine, or PC(16:0/18:1) abbreviated in POPC through the text; CAS num. 26853-31-6, nominal MW 760.076, exact MW 759.578, molecular formula C42H82NO8P, purity > 99%. (B) Cholesterol, abbreviated in Chol through the text, CAS num. 57-88-5, nominal MW 386.654, exact MW 386.355, molecular formula C27H4O, purity > 99%. (C) 1,2-distearoyl-sn-glycero-3-phosphoethanolamine-N-[methoxy(polyethyleneglycol)-2000] (ammonium salt counter ion), or 18:0 PEG2000 PE abbreviated in DSPE-PEG2k through the text, CAS Num. 474922-77-5, nominal MW 2805.497, exact MW 2803.53, molecular formula C133H267N2O55P, purity > 99%.
Liposomal batches were formulated using microfluidic organic-aqueous nanoprecipitation methods by means of a commercial, benchtop microfluidic device (NanoAssemblr Ignite, Cytiva) specifically designed to produce small batches for R&D and for pre-clinical studies. The organic phase was prepared by dissolving the three lipids POPC, Chol and DSPE-PEG2k in ethanol to reach a total lipid concentration of 10 mg/ml. Molar ratios between POPC and Chol was kept fixed at 0.86 and the DSPE-PEG2k molar concentration was increased in a roughly linear fashion, at 3.0%, 5.5%, 8.5%, 15.5% mol. PEGylated liposomes in our experiment are designed to exhibit a Rf / D ratio spanning from 0.8 to 1.8 this covering both the non-interacting (or “mushrooms”, Rf / D < 1 ), transitional and the interacting (or “brush”, Rf / D > 1) regimes of surface PEG polymer chain organizations (see Table SI1 and figure SI1). We considered this choice interesting on a more fundamental level, aside from the purely clinical applications, to explore the capability of cryo ToF-SIMS approach to appreciate variations not only in the surface density of grafted functional molecules on the liposome corona but also variations in their structural organization. The aqueous phase was PBS buffer at pH 7.4 (Merck, P38135 Sigma Aldrich). Each phase was loaded in a 1 mL syringe (BD Plastipak) and locked to the microfluidic distribution system inlets. The two phases were then mixed through a commercial microfluidic cartridge (NanoAssembl Ignite NxGen cartridges, Cytiva) at a flow rate ratio of 1.5:1 (lipid: acqueous) and total flow rate of 12 mL/min. Specifically for ToF-SIMS analysis the obtained liposomes were dialyzed for 48 h in ultrapure water at volumes ratio 4000:1 MilliQ water to sample using 3.5 kDa cut-off cassettes (Slide-A-Lyzer G2 Dialysis Cassettes, Thermofisher). This step also serves to purify liposomal solution from unbound molecules prior measurements. In all other cases the final product was purified in phosphate buffered saline solution (PBS) pH 7.4 aqueous solvent The dialyzed liposomes were then stored at + 4 °C in a refrigerator before analysis.
TEM (negative staining and cryo)
TEM (JEOL JEM-2100, JEOL, Italy) coupled with EDX (Brüker, Italy) was used at 120 kV in TEM, cryo-TEM, and STEM modes to characterize the primary size, morphology and elemental composition of liposomes 3% PEG coated. Sample suspension was incubated with an osmium tetroxide solution 4% (w/v) in H2O for 30 min at room temperature to fix lipid layer and 3 µL were manually deposited on 200 mesh Formvar (Agar Scientific, USA) carbon-coated copper grid and dried overnight in a desiccator before analysis. Stock suspension, 4 µL, was cryo-fixed on formvar holey carbon film grid, pretreated by glow discharge (10mV, 30 s. Leica EM ACE 200, Microcontrol, Italy), by plunge freezing technique (Leica EM GP, Microcontrol, Italy).
Elemental analysis was performed in STEM, bright field and hypermap mode by EDX (Quantax software, Brüker, Italy) to determine the phosphate and oxygen content. Size distribution was counted automatically for TEM images on Osmium fixed sample, using Image-J and ParticleSizer plugin, respectively.
Dynamic light scattering
DLS measurements were conducted using a Zetasizer Nano ZS (Malvern Instruments, Worcestershire, UK). Liposomal formulations samples at different DSPE-PEG2k concentrations were diluted 5-fold with MilliQ water and transferred to single use semi-micro PMMA cuvettes (BRAND UV cuvette micro, H 8.5 mm, 70–850 µ L, Sigma-Aldrich). The zeta average size (nm) and PDI of the liposomal nanoparticles were measured at 25 °C at 173° backscatter angle, using the parameters of viscosity 0.8872 cP, refractive index 1.33, equilibration time 180 s. Three consecutive acquisitions, each one average of 10 individual measurements were conducted for each sample.
High performance liquid chromatography
Lipid quantitation in liposomal formulations was performed according to ASTM standard E3297-2148 using a Thermo-Dionex 3000 RS HPLC system fitted with a Waters xBridge RP HPLC BEH C18 column (13 nm pore size, 3.5 μm particle size, 3 mm x 150 mm). Detection of lipids was achieved using a Charged Aerosol Detector (CAD) Thermo-Dionex Corona Veo RS. Calibration was performed in the range of 5 to 300 µg mL-1 and adapted for all lipids of interest (i.e. Cholesterol, DSPE-PEG, HSPC and POPC).
Accuracy: The ASTM standard allows for 5% error (i.e. 95–105% recovery) on the determination of Chol, DSPE-PEG2k and HSPC in synthetic QC sample (i.e. a mixture of standard lipids in methanol). In our case, the error on the determination of Chol, DSPE-PEG2k and HSPC in QC sample was on average < 3% (n = 6 injections) with individual values ranging from 98.5 to 104.8%.
Precision: The relative standard deviation (RSD) on the determination of Chol, DSPE-PEG2k and HSPC in QC sample was < 2% (n = 6 injections) thus demonstrating good repeatability.
Repeatability was also checked with a standard LNP sample (9 independent preparations, 3 injections/preparation, total 18 injections) following the recommended methanol-based lipid solubilization prior to HPLC-CAD analysis. Overall RSD was < 5% for Chol & DSPE-PEG2k, and < 4% for HSPC. (Note: Discarding the results from preparation n.1, RSD is < 3% for all lipids)
Time-of-flight secondary ions mass spectrometry
Samples were analyzed by SIMS performed on two different ToF-SIMS spectrometers from ION-TOF GmbH, Münster, Germany: a TOF-IV (at JRC Ispra, dry samples) and TOF5 (at KIT-KNMFi, cryogenic measurements). Both machines are equipped with a Bi-cluster primary ion source and a reflectron type analyzer. Ultra-high vacuum (UHV) base pressure was < 9 × 10− 9 mbar during analysis. Samples were prepared via a method described elsewhere49,50,51. Each sample was analyzed within a static SIMS mode in high sensitivity mode52,53 and < 3 nm probing depth54,55,56,57. Bunched beam of 25 keV Bi3+ was used for primary beam scanning over 500 × 500 µm2 fields of view, 128 × 128 pixels, random raster, interlaced, 87 scans, dose density 5 × 1011 cm-2, 100 us cycle time, for both positive and negative secondary ions polarity. Spectra were calibrated using [C+], [CH+], [CH2+], [CH3+] [C3H3+] and [C7H7+] peaks for positive polarity and [CH–], [C2H–], [C4H–], [C3H3O2–] for negative polarity. Data post treatment and analysis as well as MVA-PCA were performed on all dataset using built-in routines in Surface Lab 7.2 (ION-TOF GmbH). MVA-PCA analysis settings were: XY binning none, Z binning sum all scans, spatial scaling none, spectral scaling root mean, centering spectral mean, number of factors six.
Data availability
Data is provided within the manuscript or supplementary information files. Processed data will be available upon reasonable request to the corresponding author. Raw data are available via the Karlsruhe Institute of Technology data catalouge under DOI: 10.35097/0y20kp1msuadj94s (https://radar.kit.edu/).
References
-
Bangham, A. D. & Horne, R. W. Negative staining of phospholipids and their structural modification by surface-active agents as observed in the electron microscope. J. Mol. Biol. 8, 660 (1964).
-
Chezy, Y., Barenholz, D. & Peer. Liposomes and other assemblies as drugs and nano-drugs: from basic and translational research to the clinics. J. Control. Release 2012, 160, 115.
-
Abuchowski, A., van Es, T., Palczuk, N. C. & Davis, F. F. Effect of covalent attachment of polyethylene glycol on immunogenicity and circulating life of bovine liver catalase. J. Biol. Chem. 252, 3578 (1977).
-
“Purple Book Database of Licensed Biological Products,” online database, avalaible at: https://purplebooksearch.fda.gov/.
-
Felgner, P. L. et al. Lipofection: a highly efficient, lipid-mediated DNA-transfection procedure. Proc. Natl. Acad. Sci. 84, 7413 (1987).
-
Urits, I. et al. A Review of Patisiran (ONPATTRO®) for the Treatment of Polyneuropathy in People with Hereditary Transthyretin Amyloidosis. Neurol. Ther. 9, 301 (2020).
-
Corbett, K. S. et al. SARS-CoV-2 mRNA vaccine design enabled by prototype pathogen preparedness. Nature 586, 567 (2020).
-
Guerrini, G., Magrì, D., Gioria, S., Medaglini, D. & Calzolai, L. Characterization of nanoparticles-based vaccines for COVID-19. Nat. Nanotechnol. 17, 570 (2022).
-
Csóka, I., Pallagi, E. & Paál, T. L. Extension of quality-by-design concept to the early development phase of pharmaceutical R&D processes. Drug Discov. Today 23, 1340 (2018).
-
Bastogne, T. Quality-by-design of nanopharmaceuticals – a state of the art. Nanomed. Nanotechnol. Biol. Med. 2017, 13, 2151.
-
Namjoshi, S. et al. Mohammed, Quality by Design: Development of the Quality Target Product Profile (QTPP) for Semisolid Topical Products. Pharmaceutics 2020, 12, https://doi.org/10.3390/pharmaceutics12030287.
-
Caputo, F., Clogston, J., Calzolai, L., Rösslein, M. & Prina-Mello, A. J. Control. Release 299, 31 (2019).
-
Caputo, F. et al. Measuring particle size distribution of nanoparticle enabled medicinal products, the joint view of EUNCL and NCI-NCL. A step by step approach combining orthogonal measurements with increasing complexity. J. Chromatogr. A 2021, 1635, 461767.
-
Lipsa, D. et al. Differences in Physico-Chemical Properties and Immunological Response in Nanosimilar Complex Drugs: The Case of Liposomal Doxorubicin. Int. J. Mol. Sci. 2023, 24. https://doi.org/10.3390/ijms241713612.
-
Shi, D. et al. To PEGylate or not to PEGylate: Immunological properties of nanomedicine’s most popular component, polyethylene glycol and its alternatives. Adv. Drug Deliv. Rev. 180, 114079 (2022).
-
Li, Y. P. et al. PEGylated PLGA nanoparticles as protein carriers: synthesis, preparation and biodistribution in rats. J. Control. Release 71, 203 (2001).
-
Ülkü, Ö., Atakay, M., Kohneshahri, M. Y., Uzun, C. & Salih, B. Site-specific characterization of peptide-polymer conjugates in various stoichiometries by MALDI-Tandem mass spectrometry. Microchem. J. 152, 104467 (2020).
-
Wöll, S., Schiller, S., Bachran, C., Swee, L. K. & Scherließ, R. Pentaglycine lipid derivates – rp-HPLC analytics for bioorthogonal anchor molecules in targeted, multiple-composite liposomal drug delivery systems. Int. J. Pharm. 547, 602 (2018).
-
Heald, C. R. et al. Poly(lactic acid)−Poly(ethylene oxide) (PLA−PEG) Nanoparticles: NMR Studies of the Central Solidlike PLA Core and the Liquid PEG Corona. Langmuir 18, 3669 (2002).
-
Mineart, K. P., Kelley, E. G., Nagao, M. & Prabhu, V. M. Processing–structure relationships of poly(ethylene glycol)-modified liposomes. Soft Matter 13, 5228 (2017).
-
U. Baxa, Characterization of Nanoparticles Intended for Drug Delivery in (Ed: S.E. McNeil), Springer New York, New York, NY, 2018, pp. 73–88.
-
Sjövall, P., Lausmaa, J., Nygren, H., Carlsson, L. & Malmberg, P. Imaging of membrane lipids in single cells by imprint-imaging time-of-flight secondary ion mass spectrometry Anal. Chem. 75, 3429 (2003).
-
Prinz, C., Höök, F., Malm, J. & Sjövall, P. Structural Effects in the Analysis of Supported Lipid Bilayers by Time-of-Flight Secondary Ion Mass Spectrometry. Langmuir 23, 8035 (2007).
-
Sjövall, P., Agnarsson, B., Carlred, L., Gunnarsson, A. & Höök, F. Liposome binding for multiplexed biomolecule detection and imaging using ToF-SIMS. Surf. Interface Anal. 46, 707 (2014).
-
Hannestad, J. K., Höök, F. & Sjövall, P. Nanometer-scale molecular organization in lipid membranes studied by time-of-flight secondary ion mass spectrometry. Biointerphases 13, 03B408 (2018).
-
Kotowska, A. et al. Study on molecular orientation and stratification in RNA-lipid nanoparticles by cryogenic orbitrap secondary ion mass spectrometry. Commun Chem 8, 160 (2025).
-
Ramstedt, M. & Shchukarev, A. Analysis of Bacterial Cell Surface Chemical Composition Using Cryogenic X-Ray Photoelectron Spectroscopy. Methods Mol. Biol. 1440, 215 (2016).
-
Cant, D. J. H. et al. Cryo-XPS for surface characterisation of nanomedicines. J. Phys. Chem. A 127, 8220 (2023).
-
Shchukarev, A. & Ramstedt, M. Cryo-XPS: probing intact interfaces in nature and life. Surf. Interface Anal. 49, 349 (2017).
-
Labouta, H. I. et al. Surface-grafted polyethylene glycol conformation impacts the transport of PEG-functionalized liposomes through a tumour extracellular matrix model. RSC Adv. 8, 7697 (2018).
-
Jokerst, J. V., Lobovkina, T., Zare, R. N. & Gambhir, S. S. Nanoparticle PEGylation for imaging and therapy. Nanomedicine 6, 715 (2011).
-
Seah, M. P. & Shard, A. G. The matrix effect in secondary ion mass spectrometry. Appl. Surf. Sci. 439, 605 (2018).
-
Silverstein, T. P. & Williamson, J. C. Liposome permeability probed by laser light scattering. Biochem. Mol. Biol. Educ. 47, 239 (2019).
-
Thompson, R. F., Walker, M., Siebert, C. A., Muench, S. P. & Ranson, N. A. An introduction to sample preparation and imaging by cryo-electron microscopy for structural biology. Methods 100, 3 (2016).
-
S. Peretz Damari, D. Shamrakov, M. Varenik, E. Koren, E. Nativ-Roth, Y. Barenholz, O. Regev, Practical aspects in size and morphology characterization of drug-loaded nano-liposomes. Int. J. Pharm. 2018, 547, 648.
-
P. Balgavý, M. Dubničková, N. Kučerka, M. A. Kiselev, S. P. Yaradaikin, D. Uhrı́ková, Bilayer thickness and lipid interface area in unilamellar extruded 1,2-diacylphosphatidylcholine liposomes: A small-angle neutron scattering study. Biochim. Biophys. Acta – Biomembr. 2001, 1512, 40.
-
Regan, D., Williams, J., Borri, P. & Langbein, W. Lipid Bilayer Thickness Measured by Quantitative DIC Reveals Phase Transitions and Effects of Substrate Hydrophilicity. Langmuir 35, 13805 (2019).
-
Pantusa, M., Bartucci, R., Marsh, D. & Sportelli, L. Shifts in chain-melting transition temperature of liposomal membranes by polymer-grafted lipids. Biochim. Biophys. Acta – Biomembr. 1614, 165 (2003).
-
Varga, Z. et al. A closer look at the structure of sterically stabilized liposomes: a small-angle X-ray scattering study. J. Phys. Chem. B 114, 6850 (2010).
-
Shchukarev, A. XPS at solid–solution interface: experimental approaches. Surf. Interface Anal. 38, 682 (2006).
-
Graham, D. J. & Castner, D. G. Image and Spectral Processing for ToF-SIMS Analysis of Biological Materials. Mass Spectrom. 2, S0014 (2013).
-
Welch, N. G., Madiona, R. M. T., Scoble, J. A., Muir, B. W. & Pigram, P. J. Surface Adsorbed Antibody Characterization Using ToF-SIMS with Principal Component Analysis and Artificial Neural Networks. Langmuir 32, 10824 (2016).
-
Shen, Y., Son, J. & Yu, X.-Y. ToF-SIMS evaluation of PEG-related mass peaks and applications in PEG detection in cosmetic products. Sci. Rep. 14, 14980 (2024).
-
Belu, A. M., Graham, D. J. & Castner, D. G. Time-of-flight secondary ion mass spectrometry: techniques and applications for the characterization of biomaterial surfaces. Biomaterials 24, 3635 (2003).
-
Manaprasertsak, A. et al. Alterations of the chemical profile of cholesterol in cancer tissue as traced with ToF-SIMS. Analyst 149, 5344 (2024).
-
Sanità, G., Carrese, B., & Lamberti, A. Nanoparticle Surface Functionalization: How to Improve Biocompatibility and Cellular Internalization. Front. Mol. Biosci. 2020, 7.
-
Raboni, S. et al. Conjugation to gold nanoparticles of methionine gamma-lyase, a cancer-starving enzyme. Physicochemical characterization of the nanocomplex for prospective nanomedicine applications. Int. J. Pharm. 2024, 653, 123882.
-
Standard Test Method for Lipid Quantitation in Liposomal Formulations Using High Performance Liquid Chromatography (HPLC) with a Charged Aerosol Detector (CAD) https://www.astm.org/e3297-21.html.
-
Bennet, F. et al. VAMAS TWA2 interlaboratory comparison: Surface analysis of TiO2 nanoparticles using ToF-SIMS. J. Vac. Sci. Technol. A 41, 53210 (2023).
-
Bañuls-Ciscar, J. et al. A methodology to investigate heterogeneous oxidation of thermally aged cross-linked polyethylene by ToF-SIMS. Surf. Interface Anal. 52, 1178 (2020).
-
F. Bennet, A. Müller, J. Radnik, Y. Hachenberger, H. Jungnickel, P. Laux, A. Luch, J. Tentschert, F. Bennet, Y. Laux, P. Luch, Preparation of Nanoparticles for ToF-SIMS and XPS Analysis. J. Vis. Exp 2020, 61758.
-
Graham, D. J. & Gamble, L. J. Back to the basics of time-of-flight secondary ion mass spectrometry of bio-related samples. I. Instrumentation and data collection. Biointerphases 18(2), 021201 (2023).
-
Lee, J., Gilmore, I., Seah, M., Levick, A. & Shard, A. Topography and field effects in secondary ion mass spectrometry Part II: insulating samples. Surf. Interface Anal. 44, 2 (2011).
-
Muramoto, S., Brison, J. & Castner, D. G. Exploring the Surface Sensitivity of ToF-SIMS by Measuring the Implantation and Sampling Depths of Bin and C60 Ions in Organic Films. Anal. Chem. 84(1), 365–372 (2012).
-
Garrison, B. J. & Postawa, Z. Computational view of surface based organic mass spectrometry. Mass. Spec. Rev. 27(4), 289–315 (2008).
-
Hagenoff, B., Deimel, M., Benninghoven, A., Siegmund, H. U. & Holtkamp, D. Analysis of Langmuir-Blodgett overlayers by time-of-flight secondary ion mass spectrometry (TOF-SIMS). J Phys. D Appl. Phys. 25(5), 818 (1992).
-
A. Delcorte, P. Betrand, X. Arys, A. Jonaas, E. Wischeroff, B. Mayer, A. Laschewshy ToF-SIMS study of alternate polyelectrolyte thin films: Chemical surface characterization and molecular secondary ions sampling depth. Surf. Sci. 1996, 366, 149–165.
Acknowledgements
FF kindly acknowledges Maria Paula Caldeira-Guimares Sampaio-Melo do Minho for the dedication and the efforts to keep him off administrative paperwork and use his time to measure liposome surface coatings. No generative AI tool was used for writing this manuscript.
Funding
This study has received part of its funding from the European Union’s Horizon 2020 research and innovation program under grant agreement No 101007417 having benefitted from the access provided by Karlsruhe Institute of Technology – KIT – KNMF – in Karlsruhe (GER) within the framework of the NFFA-Europe Pilot Transnational Access Activity, proposal ID425. This study was supported by the European Commission Joint Research Centre – Exploratory Research Program Call 2023, project ID: PANGOLIN, hosted by F.2 Unit -Technologies for Health in the Nanobiotechnology Laboratories at JRC – Ispra.
Ethics declarations
Competing interests
The authors declare no competing interests.
Additional information
Publisher’s note
Springer Nature remains neutral with regard to jurisdictional claims in published maps and institutional affiliations.
Electronic supplementary material
Rights and permissions
Open Access This article is licensed under a Creative Commons Attribution-NonCommercial-NoDerivatives 4.0 International License, which permits any non-commercial use, sharing, distribution and reproduction in any medium or format, as long as you give appropriate credit to the original author(s) and the source, provide a link to the Creative Commons licence, and indicate if you modified the licensed material. You do not have permission under this licence to share adapted material derived from this article or parts of it. The images or other third party material in this article are included in the article’s Creative Commons licence, unless indicated otherwise in a credit line to the material. If material is not included in the article’s Creative Commons licence and your intended use is not permitted by statutory regulation or exceeds the permitted use, you will need to obtain permission directly from the copyright holder. To view a copy of this licence, visit http://creativecommons.org/licenses/by-nc-nd/4.0/.
About this article

Cite this article
Fumagalli, F., Welle, A., Bucher, G. et al. Secondary ions mass spectrometric method for assessing surface density of pegylated liposomal nanomedicines. Sci Rep 15, 27060 (2025). https://doi.org/10.1038/s41598-025-03947-z
-
Received:
-
Accepted:
-
Published:
-
DOI: https://doi.org/10.1038/s41598-025-03947-z