Introduction
Noonan syndrome (NS) is an autosomal dominant disorder characterized by dysregulation of the RAS/MAPK pathway, affecting approximately 1 in 1000 to 2500 live births1. This multisystem condition presents distinctive facial features, short stature, cardiac abnormalities (particularly pulmonary valve stenosis), and neurodevelopmental differences2. Despite being one of the higher prevalence genetic disorders, NS frequently remains underdiagnosed due to its variable expressivity and phenotypic heterogeneity. While a definitive diagnosis relies on genetic evaluation initiated by clinical suspicion, the condition’s complex and diverse presentation often results in a lack of recognition and substantial diagnostic delays3,4.
Recent advances in artificial intelligence (AI) have created promising opportunities for enhancing rare disease detection5. For NS specifically, various computational approaches have shown promise, ranging from facial feature analysis6,7 to electronic health record (EHR)-based methods8. Our previous work demonstrated that deep learning models trained on structured EHR diagnosis texts could effectively identify potential NS cases8. However, translating this in silico success into clinical practice remains a critical challenge.
To address this gap, we conducted a comprehensive validation study of our deep learning approach. By deploying our model across a large patient cohort with available biological samples, we evaluated its real-world effectiveness through genetic sequencing and expert clinical assessment. This study provides essential insights into the clinical utility of computational screening tools for rare disease detection.
Results
Cohort characteristics and model risk score distribution
The study cohort comprised 92,493 patients enrolled in the DT Biobank as of May 1st, 2021 (demographics detailed in Table 1). After excluding 65 patients with pre-existing NS diagnoses, the remaining 92,428 patients were analyzed using their complete de-identified diagnosis description text. The dataset contained 14,969,183 diagnostic entries, including documented symptoms, clinical findings, phenotypic features, and disease diagnoses, with a mean of 162 entries per patient. These comprehensive diagnostic records served as input for the predictive DCNN model.
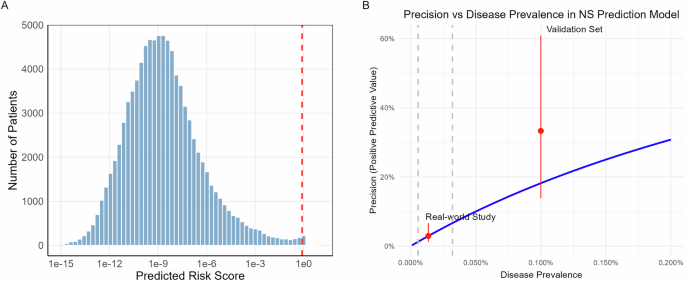
The model generated NS risk scores for all patients, with a mean score of 0.004 (distribution shown in Fig. 1A). The majority of patients received very low risk scores, with 171 patients (0.19%) exceeding our predetermined high-risk threshold of 0.8 (indicated by the red dashed line in Fig. 1A). This distribution aligns with the expected rarity of NS in this population and suggests that the model maintains appropriate specificity in real-world applications.

A Distribution of predicted NS risk scores across 92,428 patients plotted on a log10 scale. The red dashed line indicates the high-risk threshold (0.8). The strongly right-skewed distribution reflects the model’s high specificity, with 171 patients (0.19%) classified as high-risk. B Relationship between model precision and disease prevalence. The blue line shows the theoretical relationship at fixed sensitivity (40%) and specificity (99.82%). Red dots with error bars indicate observed precision in this real-world study (lower) and previous validation set (upper). Gray dashed lines mark the 95% confidence interval of the estimated disease prevalence in the current study cohort. Figure generated with R ggplot2.
To examine associations between demographic factors and risk prediction, we performed a linear regression analysis using log10-transformed risk scores as the dependent variable, with demographic factors plus diagnostic entry count as covariates. The regression model explained 7.6% of total score variance and revealed several significant associations, including lower scores in females compared to males, lower scores in Black patients compared to White patients, and negative correlation between score and age (Supplementary Table 2). The relationship between the score and the number of diagnostic entries was significant but non-linear: the score decreased with entry count up to 200 before showing an increasing trend. These relationships are visualized in Supplementary Fig. 1. Notably, none of these associations were observed within the high-risk group (score >0.8).
Chart review and genetic testing cohort selection
Manual chart review of the 171 high-risk patients was conducted in February 2022 by a clinical geneticist (KNW) and genetic counselor (AS) to identify and exclude those with existing genetic diagnoses prior to subsequent genetic sequencing.
The review identified 86 patients with prior genetic diagnoses, with Alagille syndrome (n = 15) and Williams syndrome (n = 13) being the most prevalent among 10 recurrent conditions (Supplementary Table 3). Notably, three patients received NS diagnoses after the initial EHR data extraction (May 2021), demonstrating the model’s predictive capability:
-
Patient A: Diagnosed May 2021, pathogenic heterozygous PTPN11 variant NM_002834.5(PTPN11):c.922 A > G (p.Asn308Asp). This variant is classified as Pathogenic by FDA expert panel in ClinVar.
-
Patient B: Diagnosed September 2021, pathogenic heterozygous PTPN11 variant NM_002834.5(PTPN11):c.854 T > C (p.Phe285Ser). This variant has been reported in multiple patients with NS and is classified as Pathogenic in ClinVar.
-
Patient C: Presented with characteristic NS features including short stature, intellectual disability, suggestive facial dysmorphology, mitral valve dysplasia/regurgitation, and impaired ventricular relaxation. Comprehensive genetic analysis revealed compound heterozygous pathogenic variants in LZTR1 confirmed to be in trans by phasing analysis:
-
NM_006767.4(LZTR1):c.263 G > T (p.Gly88Val). Classified as VUS in ClinVar and reclassified as Pathogenic based on ACMG criteria PVS1 (splice disruption), PM3 (in trans with pathogenic variant) and PM2 (population frequency)9.
-
NM_006767.4(LZTR1):c.1943-256 C > T. Classified as Pathogenic by ClinGen RASopathy VCEP. This intronic variant disrupts normal splicing, causing frameshift and premature termination.
-
The remaining 85 patients without identified prior genetic diagnoses proceeded to genetic evaluation through three pathways: two patients had previous clinical exome sequencing data available (with negative clinical genetic reports), 25 patients with isolated pulmonary stenosis qualified for whole genome sequencing through the GMKF Pulmonary Stenosis study, and 58 patients underwent whole exome sequencing.
Genetic sequencing results and case confirmation
Of the 85 patients selected for genetic testing, sequencing was successfully completed for 83 samples (2 clinical exome sequencing, 24 WGS, and 57 WES). Two samples failed sequencing due to inadequate DNA quality or quantity. All successfully sequenced samples met quality control criteria for DNA contamination, sequencing coverage, and sex concordance.
Filtered variants in candidate genes across all 83 samples were reviewed by the clinical geneticist, including 53 rare missense variants and 14 rare nonsense, frameshift, or deletion variants. This analysis confirmed two additional NS cases:
-
Patient D: Presented with short stature, VACTERL association, and Tetralogy of Fallot, with documented genetics consultations including a newborn evaluation in 2012. Sequencing revealed a heterozygous PTPN11 variant NM_002834.5(PTPN11):c.1529 A > G (p.Gln510Arg), classified as Pathogenic/Likely Pathogenic in ClinVar and through ACMG criteria (PM5, PP3, PM1, PM2, PP5).
-
Patient E: Presented with short stature, delayed bone age, and café au lait spots. Initially suspected of having NF1 at 4 months of age (without genetic confirmation), our sequencing identified a heterozygous in-frame deletion in NF1 (NC_000017.11(NM_000267.3):c.3285_3294del). This variant, classified as Likely Pathogenic (PM2, PP1, PP4), was independently confirmed by clinical testing in April 2022. This case was included as a true positive due to NF1’s inclusion in RASopathy panels and significant phenotypic overlap with NS10,11.
Additionally, phenotype-guided variant analysis identified three non-NS genetic diagnoses explaining clinical features. These findings included pathogenic variants in genes associated with other developmental disorders and congenital heart defects (detailed in Supplementary Table 4). Notably, we identified one patient with a pathogenic variant in ADNP, the gene associated with Helsmoortel-van der Aa syndrome (OMIM:615873), which was recently reported to exhibit phenotypic overlap with RASopathies12. The identification of these alternative diagnoses underscores the phenotypic overlap between NS and other genetic conditions, emphasizing the importance of comprehensive genetic evaluation in patients with complex clinical features.
In total, this validation study identified five previously undiagnosed NS cases: three confirmed through chart review and two by genetic sequencing. Detailed clinical and molecular characteristics of all five cases are summarized in Table 2.
Model performance and cohort prevalence analysis
Genetic sequencing validation identified 2 NS cases among 83 patients, yielding a precision of 2.41% (95% CI: 0.66%–8.37%). Including the three NS cases identified during the study period, a total of 5 NS cases were confirmed among 171 high-risk patients, yielding an overall precision of 2.92% (95% CI: 1.26%–6.66%). This real-world precision was notably lower than the 33.3% (95% CI: 13.8%–60.9%) achieved during the previous pseudo-prospective evaluation.
Despite the lower precision, the model maintained consistent specificity. With 166 false positives and n undiagnosed NS cases, specificity is (92,428 – 166 – n) / (92,428 – n), which approximates to 99.82%, given that n is very small relative to the cohort size. This result aligns closely with the 99.92% specificity (95% CI: 99.84% –99.96%) observed in our previous evaluation, conducted at a slightly higher risk score threshold (0.84 versus 0.8 in this study). Given that data sources and processing methods remained identical between studies, the marked decrease in precision can be primarily attributed to differences in disease prevalence, following the established relationship13:
-
precision = (sensitivity × prevalence) / [(sensitivity × prevalence) + ((1 – specificity) × (1 – prevalence))]
Figure 1B illustrates this relationship between precision and disease prevalence, assuming fixed sensitivity (40%) and specificity (99.82%). Based on our observed precision, the estimated disease prevalence in this real-world cohort is one case per 7379 individuals, equating to 12.5 undiagnosed NS cases in this study cohort of 92428. This prevalence is significantly lower than the one case per 1000 individuals used in our previous evaluation set. The calculated prevalence aligns with the expectations, as the DT Biobank likely contains fewer undiagnosed NS cases compared to diagnosed cases. When combining the estimated undiagnosed cases with the 65 known NS cases, the overall NS prevalence across all 92493 patients in the DT Biobank is one case per 1193 individuals.
Phenotypic analysis of high-risk patients
We conducted phenotype enrichment analysis using HPO terms to characterize the clinical phenotypes of model-identified high-risk patients. Comparing the 171 high-risk patients against the background population (n = 92,428), we identified significantly enriched phenotypes primarily associated with cardiac abnormalities, including pulmonic stenosis, cardiomegaly, atrial septal defect, as well as systemic manifestations such as failure to thrive, short stature, and feeding difficulties (detailed in Supplementary Table 5). When compared with the enriched phenotypes observed in the 65 previously diagnosed NS patients (Supplementary Table 6), the enriched phenotypes in the high-risk patients largely mirrored those observed in the NS patients (Fig. 2A). The majority of these NS phenotypes demonstrated stronger or similar enrichment in these high-risk patients (except Ptosis), supporting the model’s ability to identify clinically relevant features of NS.

A Comparison of HPO term enrichment between model-identified high-risk patients (n = 171) and known NS patients in DT(n = 65). The x-axis shows log2 fold enrichment in model-identified patients, while the y-axis shows that in known NS patients. For simplicity, only enriched HPO terms in NS patients (adjusted p < 0.01) at depths 4 to 6 in the ontology are included. Each point represents an HPO term. The diagonal dashed line indicates equal enrichment in both groups. Detailed enrichment analysis results are in Supplementary Table 5 and 6. B Longitudinal analysis of NS risk scores for five confirmed cases. Risk scores were calculated using cumulative diagnosis texts at each age point. Each patient’s trajectory (color-coded) shows distinct patterns of progression to high-risk status (>0.8). While some patients (C, E) demonstrated rapid transitions, others (A, B, D) showed more gradual progression with fluctuations. Figure generated with R ggplot2.
Comparative analyses within the high-risk group revealed subtle phenotypic patterns. The five confirmed NS cases showed potential enrichment of connective tissue phenotypes, particularly flexion contracture, though these associations did not remain significant after multiple hypothesis testing corrections (Supplementary Table 7). Demographic analysis found no significant differences in race, gender, or age between these five NS cases and other high-risk patients (Supplementary Table 8). While the 166 false positive cases showed no significantly enriched phenotypes compared to the overall high-risk group, analysis of specific genetic diagnoses revealed characteristic signatures: Alagille syndrome patients (n = 15) showed significant enrichment of splenic and hepatic abnormalities (Supplementary Table 9), while Williams syndrome patients (n = 13) demonstrated distinctive features including supravalvular aortic stenosis and oral cavity abnormalities (Supplementary Table 10).
Risk score trajectories of the confirmed NS patients
We conducted a longitudinal analysis of risk scores for the five confirmed NS patients by applying the predictive model to cumulative diagnosis texts for successive age points until the final EHR data extraction. While all patients converged to high-risk scores at their final assessment point, their trajectories varied considerably (Fig. 2B). Some patients (Patients C and E) exhibited rapid transitions from low to high scores, while others (Patients A, B, and D) demonstrated more gradual progression with notable fluctuations. Importantly, these trajectories revealed potential opportunities for earlier identification, as the majority of patients showed elevated risk scores years before their final model assessment.
Score increases typically corresponded to the documentation of NS-related phenotypes in the EHR, however, some fluctuations were less intuitive. For example, for Patient A, the documentation of “Congenital pulmonary valve stenosis” at age 4.39 years led to a marked increase in risk score, while the subsequent addition of “Personal history of surgery to heart and great vessels, presenting hazards to health” at age 4.58 years unexpectedly led to a decrease in the score.
Discussion
Our study provides real-world validation of an EHR-based deep learning approach for identifying undiagnosed NS cases, demonstrating both its capabilities and limitations in clinical practice. Through comprehensive genetic and clinical evaluation of model predictions, we identified two previously undiagnosed NS cases and validated three additional cases diagnosed during the study period. These findings confirm the model’s ability to detect previously undiagnosed NS patients in a clinical setting and offer valuable insights into the application of AI-based screening tools for rare genetic conditions.
The translation of computational performance to clinical practice revealed key considerations regarding model evaluation methodology. While the model achieved 33.3% precision in a pseudo-prospective in-silico evaluation, its real-world precision of 2.92% primarily reflects differences in disease prevalence rather than model degradation. This observation emphasizes the critical role of disease prevalence in designing and evaluating rare disease screening tools. Despite the drop in precision, the model maintained high specificity in this large cohort, demonstrating consistent behavior between the pseudo-prospective evaluation and real-world implementation. This consistency validates our previous evaluation approach and supports the use of pseudo-prospective testing as a reliable method for assessing rare disease screening tools.
Phenotypic analysis of high-risk patients revealed both the strengths and limitations of our approach. The significant enrichment of NS-associated features among high-risk patients, particularly cardiac abnormalities and growth parameters, validates the model’s ability to recognize clinically relevant patterns. However, the model’s reliance on EHR diagnosis text creates inherent limitations. For example, characteristic facial features such as ptosis and hypertelorism, although often present in more than 50% of NS patients clinically14,15, appeared in less than 20% of NS patients’ EHR documentation. Atypical NS presentations, especially those involving less common genes or subtle phenotypic features, may be underrecognized due to their limited representation in the training data. This discrepancy between clinical presentation and EHR documentation highlights the need for more comprehensive phenotype capture and suggests opportunities for complementary approaches, such as facial recognition-based screening tools, to enhance the detection of NS cases. Age-related fading of NS phenotypes, particularly facial features, may also limit recognition in older patients. Future models incorporating facial analysis could also include age to improve detection across age groups.
The substantial proportion of alternative genetic diagnoses among high-risk cases highlights the importance of considering rare genetic diseases holistically in computational screening approaches. Our chart review revealed that approximately half of the high-risk patients had other prior genetic diagnoses, including conditions like Alagille and Williams syndromes, underscoring significant phenotypic overlap across various genetic disorders. This finding points to a pathway to improve model performance through multi-disease classification approaches. Training models with multi-class labels or incorporating multiple genetic disease diagnoses from EHR could significantly enhance screening efficiency by reducing the burden of manual chart review and improving prediction precision. Expanding the model’s classification scope would also provide a more comprehensive approach to rare disease detection, potentially increasing its clinical utility.
In this study, risk scores demonstrated strong associations with diagnostic record count and demographic factors. The relationship between risk score and diagnostic entry count suggests potential bias in the training data and model development, which could be mitigated by normalizing features by patient encounter frequency or utilizing stratified, more balanced training data. The observed demographic associations aligns with prior findings that female and black patients tend to be underdiagnosed for rare genetic diseases in pediatric populations16, possibly reflecting differences in phenotype onset or recognition patterns.
Our study also provides insights into the current challenges of NS diagnosis. The identification of previously undiagnosed cases, including patients with documented NS-associated features who had not undergone genetic testing, suggests ongoing obstacles in recognizing and diagnosing NS in clinical practice. Furthermore, the estimated number of undiagnosed NS cases within the study cohort suggests additional undiagnosed cases may exist, emphasizing the need for improved diagnostic approaches.
Finally, several limitations of our study warrant discussion. First, while we assumed sensitivity remained consistent with our previous evaluation (40%), our study design cannot directly validate this assumption as we only evaluated patients above the 0.8 score threshold. Second, the reliance on available biobank samples may introduce selection bias. Third, reliance on genetic sequencing may affect clinical diagnosis of NS, given that underlying pathogenic variants remain unidentified in up to 20% of NS cases17. Finally, our findings from a single pediatric center may not fully generalize to other clinical settings or adult populations.
Despite these limitations, our results support the potential utility of EHR and AI-based screening tools in aiding rare disease detection. The model’s ability to identify both new and subsequently diagnosed NS cases demonstrates its promise in screening candidates for genetic evaluation. Future efforts should prioritize further improving prediction precision and specificity for NS relative to other genetic conditions, leveraging additional EHR data sources, integrating other genetic disease diagnoses, and developing multi-class classification models to enhance overall screening efficiency.
Methods
Study design and overview
Our validation study of the EHR-based NS prediction model comprised three primary steps: (1) applying our previously validated model to generate patient-specific risk scores from EHR data, (2) conducting systematic chart reviews of high-risk patients (NS risk score >0.8) to exclude those with documented genetic diagnoses, and (3) performing genetic sequencing and variant analysis for diagnostic confirmation in patients without prior diagnosis. The complete workflow is illustrated in Fig. 3. This study was conducted under approval from the Cincinnati Children’s Hospital Institutional Review Board (protocol number 2020-0685). All participants were previously enrolled in the Discover Together Biobank with broad informed consent for research use of their biological samples and health data. The IRB waived additional informed consent requirements for this minimal-risk study given the existing research consent and adequate confidentiality protections. This study was conducted in full compliance with the Declaration of Helsinki and all relevant ethical regulations for human subjects research.

Starting with 92,493 Discover Together Biobank patients in May 2021, high-risk patients (score >0.8) underwent chart review in February 2022 and genetic sequencing from August 2022. Yellow boxes indicate patient subgroups identified through chart review; green boxes indicate confirmed NS cases. Figure generated using diagrams.net.
Data description
The study cohort comprised patients enrolled in Cincinnati Children’s Hospital’s Discover Together (DT) Biobank with linked EHR-biological sample data. The phenotypic information was extracted from diagnosis description text in Cincinnati Children’s de-identified structured EHR database (i2b2), encompassing patient encounters, problem lists, and billing data. Of 92,493 enrolled patients at data extraction (May 2021), 65 had prior NS diagnoses documented in the EHR, leaving 92,428 patients for model evaluation. The DT Biobank’s diverse biological sample repository enabled comprehensive genetic validation of model predictions across this large and diverse cohort.
Deep learning model for NS risk scoring
The predictive model, as detailed previously8, processes de-identified EHR text to identify potential NS cases. The model architecture integrates deep convolutional neural network (DCNN) layers, dense forward-feed layers, and pooling layers, using tokenized and vectorized concatenated diagnosis texts as input. For this validation study, we employed the model version that achieved the highest area under the precision-recall curve (PR-AUC) in the previous held-out and pseudo-prospective validation sets.
The top diagnosis terms most predictive of NS risk, as learned by the model, are detailed in Table 1 of our prior publication8, and were not re-derived in this study. A risk score threshold of >0.8 was implemented to identify high-risk patients, based on previous performance metrics in the pseudo-prospective validation set (sensitivity 40%, specificity 99.92% at a risk score threshold of 0.84). Importantly, this study’s cohort (n = 92,428) was entirely independent from the original model training dataset to ensure that validation results reflected the model’s ability to generalize to new, unseen data.
Chart review and selection of patients for genetic sequencing
For patients with NS risk scores >0.8, a clinical geneticist (KNW) and genetic counselor (AS) with expertise in cardiovascular genetics performed comprehensive chart reviews to identify and exclude those with existing genetic diagnoses. The review process included examination of clinical notes, genetic testing reports, and documented diagnoses across the complete medical record in Epic® EHR system. Cases were classified as having prior genetic diagnosis if they had (1) documented pathogenic or likely pathogenic variants in known disease-causing genes, (2) confirmed clinically relevant chromosomal abnormalities, or (3) established clinical genetic diagnoses documented by clinicians.
Patients without prior genetic testing or with inconclusive genetic findings were retained for further evaluation. Disagreements in classification were resolved through consensus discussion. From the initial set of high-risk patients, those without prior genetic diagnoses and with available biobank specimens were selected for genetic sequencing validation.
Genetic sequencing and clinical evaluation
DNA samples were obtained from DT Biobank for patients with NS risk scores >0.8 who lacked prior genetic diagnoses. Genetic sequencing was performed through two pathways: patients with isolated pulmonary stenosis (PS) were sequenced via whole-genome sequencing (WGS) at the Broad Institute through an NIH Gabriella Miller Kids First (GMKF)-funded study, while remaining patients underwent whole-exome sequencing (WES) at Yale Center for Genome Analysis (YCGA).
For WES data, variant calling and joint genotyping were performed using the Sentieon® DNAseq pipeline18, generating cohort VCF file from FASTQ data. WGS data processing utilized GATK 3.519 for variant calling and joint genotyping at the Broad Institute. Both WES and WGS data were aligned to the hg38 reference human genome. WGS VCF files were filtered for coding regions plus 50 bp flanking sequences based on GENCODE v4320 for subsequent analysis. Quality control (QC) measures included assessment of cross-sample DNA contamination (VerifyBamID21), sequencing coverage (mosdepth22), and verification of reported versus genotype-based sex. QC failure criteria were defined as contamination FREEMIX score >0.05, mean coverage <20X, or sex mismatch.
Variant annotation used an in-house R pipeline incorporating gnomAD23 for population minor allele frequencies, ClinVar24 for pathogenicity classifications, protein consequences (synonymous, nonsynonymous, nonsense, frameshift, and splice site variants), and MetaSVM25 for deleteriousness prediction based on data from ANNOVAR26. Variants retained met the following criteria: rare frequency (MAF < 0.1%), location in NS/congenital heart defect-related genes27 (Supplementary Table 1), moderate or high predicted consequences, adequate coverage (>8x), high genotype quality (≥99), not classified as “Benign” in ClinVar, and predicted deleterious by MetaSVM. Phasing analysis using TinkerHap28 was performed when multiple variants were identified in the same gene to confirm compound heterozygosity. A clinical geneticist (KNW) manually reviewed filtered variants according to ACMG guidelines29 for NS diagnosis confirmation. This analysis was complemented using VarSeq™ (Golden Helix, Inc., Bozeman, MT, www.goldenhelix.com) software.
To explore potential alternative genetic diagnoses, we performed a phenotype-guided variant analysis using GDDP-V, an in-house variant analysis pipeline based on GDDP30. This additional analysis was necessary, as the study’s primary aim was not gene discovery for NS, and alternative genetic etiologies could account for discrepancies between sequencing results and model predictions. GDDP-V integrates phenotypic data with sequencing results by analyzing VCF files alongside Human Phenotype Ontology (HPO)31 terms, prioritizing variants based on both pathogenicity and phenotype relevance. For each patient, HPO terms were extracted through a two-step process: first, diagnosis texts were mapped to Systematized Nomenclature of Medicine-Clinical Terms (SNOMED CT®) codes using Epic-provided mappings, followed by conversion to HPO terms using Monarch Initiative32 mappings. These HPO terms and VCF files were subsequently processed through GDDP-V to identify potentially causative variants in genes outside the primary NS-associated gene set. This approach was particularly valuable for identifying non-NS genetic conditions in patients with overlapping clinical features. Lastly, clinical geneticists reviewed the pipeline output to identify and confirm additional genetic diagnoses.
Phenotype analysis
We conducted standardized phenotypic analysis using HPO terms. We obtained HPO terms for each patient using the mapping process described above. HPO term annotation and enrichment analysis were performed using the “simona” package33 in R, enabling systematic analysis of phenotypic patterns across patient groups. For patients with NS diagnosis, their phenotypes were censored at their NS diagnosis time to facilitate unbiased comparisons.
Statistical analysis
The model’s performance was evaluated using standard classification metrics, including precision (or positive predictive value, defined as the proportion of true positives among predicted positives), sensitivity (or recall, the proportion of actual NS cases that are above the risk score threshold), and specificity (the proportion of non-NS cases below the risk score threshold). Uncertainty was quantified by calculating 95% confidence intervals for these metrics using Wilson score intervals34, implemented using the “binom” package35. All statistical analyses and visualizations were performed in R.
Data availability
Individual-level electronic health record data cannot be made publicly available due to patient privacy regulations and Cincinnati Children’s Hospital institutional policies. The processed NS risk scores and aggregated phenotype data are available from the corresponding author upon reasonable request with appropriate institutional research agreements and IRB approval. The computational code for the deep learning model is available at https://github.com/xiaojoey/eNS.
References
-
Tidyman, W. E. & Rauen, K. A. The RASopathies: developmental syndromes of Ras/MAPK pathway dysregulation. Curr. Opin. Genet Dev. 19, 230–236, https://doi.org/10.1016/j.gde.2009.04.001 (2009).
-
Roberts, A. E., Allanson, J. E., Tartaglia, M. & Gelb, B. D. Noonan syndrome. Lancet 381, 333–342, https://doi.org/10.1016/S0140-6736(12)61023-X (2013).
-
Zenker, M., Edouard, T., Blair, J. C. & Cappa, M. Noonan syndrome: improving recognition and diagnosis. Arch. Dis. Child 107, 1073–1078, https://doi.org/10.1136/archdischild-2021-322858 (2022).
-
Wenger, B. M. et al. A genotype-first approach to exploring Mendelian cardiovascular traits with clear external manifestations. Genet Med. 23, 94–102, https://doi.org/10.1038/s41436-020-00973-2 (2021).
-
Hersh, W. R., Cohen, A. M., Nguyen, M. M., Bensching, K. L. & Deloughery, T. G. Clinical study applying machine learning to detect a rare disease: results and lessons learned. JAMIA Open 5, ooac053, https://doi.org/10.1093/jamiaopen/ooac053 (2022).
-
Gurovich, Y. et al. Identifying facial phenotypes of genetic disorders using deep learning. Nat. Med. 25, 60–64, https://doi.org/10.1038/s41591-018-0279-0 (2019).
-
Yang, H. et al. Automated facial recognition for noonan syndrome using novel deep convolutional neural network with additive angular margin loss. Front. Genet. 12, 669841 (2021).
-
Yang, Z. et al. Using deep learning and electronic health records to detect Noonan syndrome in pediatric patients. Genet. Med. 24, 2329–2337, https://doi.org/10.1016/j.gim.2022.08.002 (2022).
-
Wilcox, E. H. et al. Updated ACMG/AMP specifications for variant interpretation and gene curations from the ClinGen RASopathy expert panels. Genet. Med. Open 3, 103430 (2025).
-
Witkowski, L., Dillon, M. W., Murphy, E., M, S. L. & Mason-Suares, H. Expanding the Noonan spectrum/RASopathy NGS panel: benefits of adding NF1 and SPRED1. Mol. Genet Genom. Med. 8, e1180 (2020).
-
Tartaglia, M., Gelb, B. D. & Zenker, M. Noonan syndrome and clinically related disorders. Best. Pract. Res. Clin. Endocrinol. Metab. 25, 161–179 (2011).
-
Szabo, T. M. et al. Helsmoortel-Van der Aa syndrome-cardiothoracic and ectodermal manifestations in two patients as further support of a previous observation on phenotypic overlap with RASopathies. Genes 13, https://doi.org/10.3390/genes13122367 (2022).
-
Tenny, S. & Hoffman, M. R. in StatPearls [Internet] (StatPearls Publishing, 2023).
-
van Trier, D. C. et al. Ocular manifestations of noonan syndrome: a prospective clinical and genetic study of 25 patients. Ophthalmology 123, 2137–2146 (2016).
-
Lee, N. B., Kelly, L. & Sharland, M. Ocular manifestations of Noonan syndrome. Eye 6(Pt 3), 328–334 (1992).
-
Herr, K. et al. Estimating prevalence of rare genetic disease diagnoses using electronic health records in a children’s hospital. HGG Adv. 5, 100341 (2024).
-
Carcavilla, A. et al. [Noonan syndrome: genetic and clinical update and treatment options]. Pediatria 93, 61 e61–61 e14 (2020).
-
Kendig, K. I. et al. Sentieon DNASeq variant calling workflow demonstrates strong computational performance and accuracy. Front.Genet 10, 736, https://doi.org/10.3389/fgene.2019.00736 (2019).
-
Poplin, R. et al. Scaling accurate genetic variant discovery to tens of thousands of samples. BioRxiv, https://doi.org/10.1101/201178 (2017).
-
Frankish, A. et al. GENCODE reference annotation for the human and mouse genomes. Nucleic Acids Res. 47, D766–D773, https://doi.org/10.1093/nar/gky955 (2019).
-
Jun, G. et al. Detecting and estimating contamination of human DNA samples in sequencing and array-based genotype data. Am. J. Hum. Genet 91, 839–848, https://doi.org/10.1016/j.ajhg.2012.09.004 (2012).
-
Pedersen, B. S. & Quinlan, A. R. Mosdepth: quick coverage calculation for genomes and exomes. Bioinformatics 34, 867–868, https://doi.org/10.1093/bioinformatics/btx699 (2018).
-
Karczewski, K. J. et al. The mutational constraint spectrum quantified from variation in 141,456 humans. Nature 581, 434–443, https://doi.org/10.1038/s41586-020-2308-7 (2020).
-
Landrum, M. J. et al. ClinVar: public archive of relationships among sequence variation and human phenotype. Nucleic Acids Res. 42, D980–D985, https://doi.org/10.1093/nar/gkt1113 (2014).
-
Dong, C. et al. Comparison and integration of deleteriousness prediction methods for nonsynonymous SNVs in whole exome sequencing studies. Hum. Mol. Genet. 24, 2125–2137, https://doi.org/10.1093/hmg/ddu733 (2015).
-
Wang, K., Li, M. & Hakonarson, H. ANNOVAR: functional annotation of genetic variants from high-throughput sequencing data. Nucleic Acids Res. 38, e164, https://doi.org/10.1093/nar/gkq603 (2010).
-
Weaver, K. N. et al. Prevalence of genetic diagnoses in a cohort with valvar pulmonary stenosis. Circ. Genom. Precis Med. 15, e003635 (2022).
-
Hartmann, U., Shaham, E., Nathan, D., Blech, I. & Zeevi, D. TinkerHap – A novel read-based phasing algorithm with integrated multi-method support for enhanced accuracy. bioRxiv, 2025.2002.2016.638517, https://doi.org/10.1101/2025.02.16.638517 (2025).
-
Richards, S. et al. Standards and guidelines for the interpretation of sequence variants: a joint consensus recommendation of the American College of Medical Genetics and Genomics and the Association for Molecular Pathology. Genet Med. 17, 405–424, https://doi.org/10.1038/gim.2015.30 (2015).
-
Chen, J. et al. Novel phenotype-disease matching tool for rare genetic diseases. Genet Med. 21, 339–346, https://doi.org/10.1038/s41436-018-0050-4 (2019).
-
Gargano, M. A. et al. The Human Phenotype Ontology in 2024: phenotypes around the world. Nucleic Acids Res. 52, D1333–D1346, https://doi.org/10.1093/nar/gkad1005 (2024).
-
Putman, T. E. et al. The Monarch Initiative in 2024: an analytic platform integrating phenotypes, genes and diseases across species. Nucleic Acids Res. 52, D938–D949, https://doi.org/10.1093/nar/gkad1082 (2024).
-
Gu, Z. simona: a comprehensive R package for semantic similarity analysis on bio-ontologies. BMC Genom. 25, 869. https://doi.org/10.1186/s12864-024-10759-4 (2024).
-
Agresti, A. & Coull, B. A. Approximate is better than “exact” for interval estimation of binomial proportions. Am. Stat. 52, 119–126 (1998).
-
Binom: binomial confidence intervals for several parameterizations. R package version 1.1–1. 2014 (2014).
Acknowledgements
This study was partially supported by the Center for Pediatric Genomics (CpG) at Cincinnati Children’s Hospital Medical Center (CCHMC). The funder played no role in study design, data collection, analysis and interpretation of data, or the writing of this manuscript. The authors thank Mike Pauciulo for his assistance in preparing DNA samples for high-risk patients identified in the Discover Together Biobank. The authors also thank Janet Zahner and Alka Chandel for their support in extracting data from the CCHMC EHR systems.
Ethics declarations
Competing interests
The authors declare no competing interests.
Additional information
Publisher’s note Springer Nature remains neutral with regard to jurisdictional claims in published maps and institutional affiliations.
Supplementary information
Rights and permissions
Open Access This article is licensed under a Creative Commons Attribution-NonCommercial-NoDerivatives 4.0 International License, which permits any non-commercial use, sharing, distribution and reproduction in any medium or format, as long as you give appropriate credit to the original author(s) and the source, provide a link to the Creative Commons licence, and indicate if you modified the licensed material. You do not have permission under this licence to share adapted material derived from this article or parts of it. The images or other third party material in this article are included in the article’s Creative Commons licence, unless indicated otherwise in a credit line to the material. If material is not included in the article’s Creative Commons licence and your intended use is not permitted by statutory regulation or exceeds the permitted use, you will need to obtain permission directly from the copyright holder. To view a copy of this licence, visit http://creativecommons.org/licenses/by-nc-nd/4.0/.
About this article

Cite this article
Yang, Z., Shikany, A., Husami, A. et al. Sequencing validates deep learning models for EHR-based detection of Noonan syndrome in pediatric patients. npj Genom. Med. 10, 56 (2025). https://doi.org/10.1038/s41525-025-00512-5
-
Received:
-
Accepted:
-
Published:
-
DOI: https://doi.org/10.1038/s41525-025-00512-5