Main
Recent advances in spatial omics technologies, particularly in spatial transcriptomics and proteomics1,2, have enabled high-dimensional molecular profiling with preserved spatial context, offering unprecedented insights into tissue organization and disease pathogenesis. Despite these crucial advancements, current commercial platforms remain expensive and often have limited tissue capture areas. For instance, Visium HD3, which provides subcellular resolution and whole-transcriptome coverage, costs about US $7,000 per sample for a tissue capture area of only 6.5 mm × 6.5 mm, considerably smaller than typical tissue specimens. Other spatial omics platforms, including both spatial transcriptomics4,5,6,7,8,9 and spatial proteomics10,11,12,13,14, are similarly priced and constrained by small tissue capture areas. These technical and economic constraints necessitate careful experimental design. To avoid wasting valuable resources on suboptimal data acquisition, researchers must strategically select regions of interest (ROIs) within large tissue sections to ensure that spatial profiling captures the most biologically informative regions while minimizing cost and time investment.
Currently, ROI selection is predominantly manual, subjective and non-reproducible, relying heavily on the expertise of pathologists. This process typically involves visual inspection of hematoxylin and eosin (H&E) stained histology images, which are widely accessible and cost effective. However, because ROI selection is based on tissue morphology, the process is labour intensive and inherently subjective, making it prone to human error. Such variability introduces inconsistencies across experiments and laboratories, poses substantial challenges to reproducibility and compromises the reliability of spatial omics studies.
The critical problem of ROI selection in spatial omics studies remains underexplored in the existing literature. While several recent efforts have aimed to improve experimental design in spatial omics, they do not address the core challenge of ROI selection within tissue sections. For instance, Jones et al.15 developed an algorithm to optimize tissue sectioning strategies, but their method does not consider ROI selection within a given section. SOFisher16 employs reinforcement learning for automated field-of-view (FOV) selection. Its sequential decision-making approach requires gene expression data from FOVs selected in the previous steps. This iterative process is impractical in real-world settings owing to prolonged processing time and risk of RNA degradation. As such, these methods do not provide a solution to the practical challenge of ROI selection.
Here, we present Smart Spatial omics (S2-omics), a framework that addresses this critical methodological gap by providing a systematic, reproducible and computationally efficient approach for ROI selection using only H&E histology images. Previous studies17,18,19,20,21,22,23 have shown that similar histological patterns often correspond to similar spatial molecular profiles, supporting the premise that H&E-based ROI selection can effectively capture molecular heterogeneity across tissues. We demonstrate the versatility of S2-omics across multiple tissue types, including human breast, colon, kidney, liver and stomach. By applying S2-omics to experimental design in three leading spatial omics platforms, including Xenium, Visium HD and CosMx, we validate that S2-omics consistently identified ROIs enriched with biologically informative patterns, often matching or outperforming manual selections made by pathologists. Moreover, we highlight that suboptimal ROI selection can compromise biological discovery, resulting in missed molecular signals. S2-omics fulfills essential criteria for real-world deployment, including objectivity, consistency, cost effectiveness and computational scalability. By standardizing the ROI selection step, S2-omics ensures that the substantial investment in spatial omics experiments yield maximally informative data, thereby establishing it as a foundational tool for the field.
Results overview of S2-omics
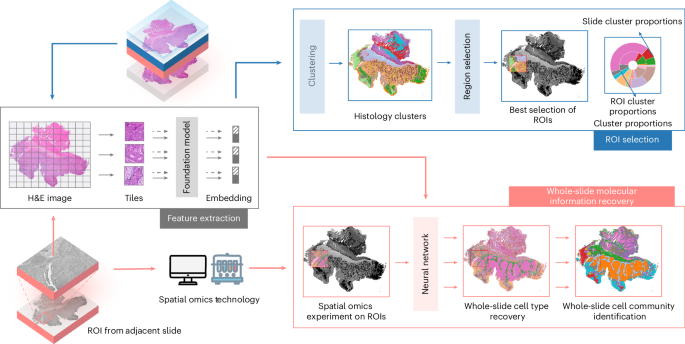
Figure 1 illustrates the S2-omics workflow, which consists of three components: histology image feature extraction, ROI selection and whole-slide molecular information recovery. To preserve tissue integrity for spatial molecular analysis on the target slice, S2-omics performs ROI selection using H&E image obtained from the immediately adjacent tissue section. The high architectural similarity between sequential thin tissue slices ensures that ROIs identified from the adjacent H&E-stained section can effectively guide experimental design for the target slice. To characterize tissue architecture, S2-omics leverages pre-trained pathology image foundation models to extract both global and local image features for all superpixels of size 8 μm × 8 μm on the adjacent H&E image. S2-omics employs the UNI24 model by default, but is compatible with other foundation models25,26,27,28,29,30.

Model summary of S2-omics. To preserve tissue integrity for spatial molecular analysis, S2-omics performs ROI selection using H&E images obtained from an adjacent tissue slice of the intended spatial omics section. The adjacent H&E image is divided into tiles and converted into hierarchical histology image features using a foundation model. These features are used to cluster histology image into functionally diverse regions, that is, histology clusters. ROI selection is then conducted with the clustering results to maximize the ROI score. After the spatial omics experiments over the selected ROI are completed, cell type and cell community predicting models are trained to predict cell type and cell community labels in unsampled tissue regions.
The second component, ROI selection, is designed to identify ROIs that best capture the diversity of tissue structures present within a tissue section. The image features extracted in the first component are used to segment the tissue into histologically distinct regions via unsupervised clustering. S2-omics then samples candidate regions across the whole slide. We introduce a metric, the ROI score (Methods), to quantify the representativeness of each candidate region. Guided by this score, S2-omics selects ROIs that aim to maximize the molecular information content and minimize the experimental cost of spatial omics profiling.
The final component, whole-slide molecular information recovery, is an optional virtual prediction module designed primarily to guide subsequent experiments, but it can also be used to validate ROI selection made by S2-omics. By propagating cell type and cell community labels from experimentally profiled ROIs across the entire tissue section using histological features, this module provides a tissue-wide perspective that informs downstream analyses and helps prioritize future experiments. In benchmarking contexts, the accuracy of these virtual predictions further serves as a biologically meaningful check that the selected ROIs are sufficiently representative to capture key molecular variation.
Application to a human gastric cancer sample to guide Xenium experiment
To evaluate the performance of S2-omics, we applied it to a gastric cancer sample (~10 mm × 24 mm) that included both high-resolution H&E image and 10x Xenium spatial transcriptomics data. This sample was chosen for its relatively large size, the presence of diverse and interesting tissue structures, and the availability of single-cell resolution gene expression data spanning the entire tissue section. These characteristics allowed us to evaluate whether the ROIs identified by S2-omics could effectively capture gene expression variation across the whole tissue. As shown in Fig. 2a, the tissue slice included not only typical gastric structures, but also tumour cells and multiple tertiary lymphoid structures (TLSs). TLSs are of particular interest because they are positively associated with improved responses to immunotherapy and better clinical outcomes31.

a, The ROI selected by S2-omics, visualized on H&E image and histology clusters, with a comparison between the histology cluster compositions of ROI and WSI. b–d, An evaluation of cell type and cell community label prediction with a visual comparison between the ground truth and S2-omics cell type and cell community predictions from the selected ROI: the ground truth and predicted image of an unsampled region at tumour boundary and another unsampled region involving a mature TLS are zoomed in for a detailed comparison (b), and a visual comparison between ground truth and S2-omics predicted cancer cells (c) and between ground truth and S2-omics predicted TLSs (d) are shown. DC, dendritic cells; epi, epithelial cells; endo, endothelial cells; fibro, fibroblast; macro, macrophages. The Xenium data-based annotation served as the ground truth for both cell type and cell community label predictions, and only the labels of superpixels inside the selected ROI were used for broadcasting model training to mimic the situation that the spatial omics experiment was only conducted in the ROI.
We considered a scenario where the budget permits the measurement of only a single ROI. With a fixed ROI size of 4 mm × 4 mm, S2-omics identified an optimal ROI, highlighted by the red box in Fig. 2a. Detailed examination revealed that this ROI encompasses all key structures. Our histology segmentation results demonstrated strong concordance with pathologist annotation, showing considerable overlaps between cluster 1 and tumour region, cluster 7 and intestinal metaplasia/tumour adjacent normal and cluster 9 and tumour-infiltrated stroma, among others. To further evaluate the selected ROI, we compared the histological cluster composition within the ROI (Fig 2a, red, inner ring) to that of the entire tissue slice (Fig 2a, grey, outer ring). Of the 11 clusters present in the tissue, seven were represented within the ROI, maintaining a balanced distribution. The four unsampled clusters corresponded to muscle region (clusters 2 and 6) and low-quality tissue regions (clusters 3 and 8). Although the clusters were identified solely based on histological information, they effectively captured meaningful cellular characteristics (Supplementary Fig. 1a). These findings indicate that, despite its smaller size, the selected ROI preserves the overall tissue architecture while enriched for under-represented clusters.
To further examine whether the ROI selected by S2-omics contains representative cell types and tissue structures, we broadcasted cell type and cell community labels from the ROI to the entire tissue slice and compared these predictions with annotations derived directly from Xenium gene expression measurements (Fig. 2b). Cell communities, which characterize distinct tissue structures, were identified using the methodology described in the Methods. The cell type composition of each cell community is shown in Supplementary Fig. 1b. Overall, the broadcasting performance was satisfactory, achieving prediction accuracies of 73.8% for cell types and 72.8% for cell communities. Such high accuracy confirms that S2-omics-selected ROIs contain sufficient cellular diversity to support robust inference of cellular and structural features from histological patterns. This validates both the biological relevance and representativeness of the automatically selected ROIs.
To further assess the performance of S2-omics, we focused on a tumour region and a TLS for detailed examination (Fig. 2b). In the tumour region, both the cell type and cell community predictions successfully recovered the tumour (community 5) and the tumour-infiltrated stroma (community 6 and community 7) boundary with high precision. For the selected TLS, the predicted cell community labels were highly accurate, and the cell type predictions revealed the expected TLS structure of B cell aggregates surrounded by T cells. To comprehensively evaluate the ability of S2-omics to predict tumour cells and TLSs, we isolated both annotated and S2-omics-predicted cancer cells and TLSs, and displayed the prediction results alongside the ground truth annotations (Fig. 2c,d). Notably, 73.4% of the tumour cells were correctly predicted. Among the 40 TLSs in the tissue, four were directly captured within the ROI, and 28 of the remaining 36 were recovered by S2-omics. Detailed true positive and false positive predictions for tumour cells and TLSs are shown in Extended Data Fig. 1a, and a Sankey diagram illustrating the relationship between predicted and ground truth cell type annotations is provided in Extended Data Fig. 1b. Collectively, these results demonstrate that the ROI selected by S2-omics effectively identified representative tissue structures. Moreover, the broadcasting based on the spatial gene expression data measured in the ROI reliably expanded cell-level labels across the entire tissue slice, providing valuable information for subsequent experiments.
To quantitatively assess the performance of S2-omics, we conducted a systematic benchmarking analysis using 500 randomly selected 4 mm × 4 mm ROIs centred within the tissue slice. The ROI selected by S2-omics achieved the highest ROI score (0.73), ranking within the top three for cell type prediction accuracy and within the top ten for cell community prediction accuracy among all randomly selected ROIs (Extended Data Fig. 1c). It is reassuring that, despite relying solely on histology without molecular input, S2-omics identified a near-optimal ROI for spatial omics profiling, as reflected in its strong predictive performance. To further demonstrate the importance of ROI selection, we randomly selected an ROI with a mediocre ROI score (0.65) (Extended Data Fig. 2a). As demonstrated in Extended Data Fig. 2b, this ROI captured very few enteroendocrine (EE) cells and cells from communities 1, 2, 3 and 5. Consequently, the molecular and morphological characteristics of these populations could not be adequately characterized, resulting in decreased accuracy for cell-level label prediction (Extended Data Fig. 2c). This example illustrates how suboptimal ROI selection can lead to missed biological signals and compromise discovery potential, underscoring the critical importance of strategic ROI selection.
Application to human colon cancer samples to guide the Visium HD experiment
We next evaluated S2-omics by comparing its performance with experts’ ROI selection using a colorectal cancer (CRC) section (P1 CRC, 20 mm × 16 mm). This section was measured using Visium HD within a 6.5 mm × 6.5 mm ROI selected by 10x Genomics researchers. To ensure a fair comparison, we applied S2-omics under the constraint that only one ROI of size 6.5 mm × 6.5 mm could be selected within the given budget. The ROI selected by S2-omics (Fig. 3a, solid red box) showed remarkable concordance with the ROI chosen by the 10x Genomics researchers (Fig. 3a, dashed red box), covering 89.3% of expert-selected cells while including 16.3% more valid superpixels. We carefully compared the histology cluster compositions of the two ROIs by visualizing them as pie charts (Fig. 3b). Compared with the experts’ selection, the ROI selected by S2-omics minimized blank space and achieved a more balanced distribution of histology clusters. Notably, it captured a higher proportion of the invasive cancer region, which is of particular interest to oncology researchers.

a, A visual comparison between ROIs separately selected by S2-omics (red box) and an experienced pathologist (dashed red box) on a CRC tissue section (P1 CRC). b, Histology cluster compositions of the two ROIs and their pie chart visualizations. c, Visium HD-based cell type annotation and S2-omics cell type prediction on the whole tissue section. For all superpixels that have Visium HD-based cell type annotation, their histology features and annotations were used as training data. Cell type labels of all superpixels that passed quality control were predicted using the trained model. d, The distribution of cell types in the histology clusters. Each square shows the percentage of cells in corresponding cell type category and histology cluster occupied in all cells in that cell type category. e–h, The application and evaluation on another CRC sample with paired Visium HD data (P5 CRC). CAF, cancer-associated-fibroblast; entero, enterocytes; myofibro, myofibroblast; neut, neutrophils; EE, enteroendocrine cells.
Ideally, we would further evaluate the quality of the S2-omics-selected ROI by performing cell-level label broadcasting with spatial gene expression data from the ROI. However, since such data are unavailable, we utilized the Visium HD data obtained from the ROI selected by 10x Genomics researchers. Given the 89.3% coverage of expert-selected cells, we expect the resulting performance to reflect the representativeness of samples captured by the S2-omics ROI. As shown in Fig. 3c,d, the predicted cell type distributions from S2-omics closely aligned with pathologist’s annotation, demonstrating strong correspondence between cell types and tissue compartments. This strong concordance confirms that S2-omics-selected ROIs capture sufficient representation of each cell type, enabling comprehensive biological characterization and accurate reconstruction of the spatial cellular distribution across the entire tissue specimen.
To further evaluate the performance of S2-omics, we applied it to two additional colon cancer samples and one healthy colon sample from different patients (Fig. 3e–h, Extended Data Fig. 3 and Supplementary Fig. 2). As expected, the S2-omics-selected ROIs largely overlap with the ROIs selected by 10x Genomics researchers, and the whole-slice cell type predictions generated by S2-omics were consistent with pathologist’s annotations. Specifically, the S2-omics ROI selection covered 89.2% of the superpixels in the pathologist-selected ROI for P5 CRC (Fig. 3e–h), 76.7% for P2 CRC (Extended Data Fig. 3) and 95.7% for P3 normal adjacent tissue (Supplementary Fig. 2). Notably, in P2 CRC, predictions by S2-omics uncovered previously uncharacterized tissue structures, including an evident aggregation of B cells and T cells at the tumour boundary in the lower-left region of the section (Extended Data Fig. 3e). This structure, which was not captured within the original Visium HD ROI, highlights the utility of S2-omics beyond ROI selection. By providing researchers with a detailed preview of tissue architecture across unmeasured tissue regions, S2-omics offers valuable insights that can guide decisions on additional spatial omics experiments and help identify biologically important regions for further investigation.
Application to human kidney samples to guide the CosMx experiment
Encouraged by the promising performance of S2-omics in guiding Xenium and Visium HD experiments, we next applied it to another popular spatial transcriptomics platform, CosMx32. Unlike other spatial transcriptomics technologies, CosMx experiments are conducted on small FOVs (0.5 mm × 0.5 mm each) rather than larger ROIs. The experiment’s runtime increases with the number of FOVs, creating a trade-off between the area captured and data quality due to RNA degradation over time. Thus, the number of FOVs in a single CosMx slide (~15 mm × 20 mm) is limited to 200 in most cases, merely covering approximately 1/6 of the chip area. The data analysed included two kidney tissue sections: one from a healthy sample (Fig. 4a, left) and the other from a sample with type 2 diabetes (T2D) (Fig. 4a, right). H&E image-based tissue segmentation revealed sample heterogeneity attributable to differences in disease status, but also identified common tissue structure, such as glomeruli (cluster 3). Given the unique characteristics of CosMx experiments, we developed two modes for the experimental design. The first mode identifies optimal FOVs, which may be non-contiguous, while the second mode selects larger ROIs (5 mm × 5 mm), suitable for researchers interested in obtaining a contiguous set of FOVs within each ROI. Both the FOV and ROI selections made by S2-omics for these two samples are shown in Fig. 4a, where the numbers of FOVs and ROIs were automatically determined as described in Methods. When applying S2-omics, we considered the two tissue samples simultaneously as they were positioned on the same slide and the H&E image encompassed both. Notably, the FOVs and ROIs selected by S2-omics effectively covered both samples. A closer examination of the histology composition pie charts in Fig. 4a revealed that S2-omics balanced the selection across different functional regions in both the FOV and ROI modes, giving equal importance to both tissue sections.

a, ROIs and FOVs selected by S2-omics with a comparison between histology cluster compositions of ROIs and WSI (top right) and a comparison between histology cluster compositions of FOVs and WSI (bottom right). The size of each FOV is 0.5 mm × 0.5 mm, the real physical size of CosMx FOVs, and the ROI size is 5 mm × 5 mm. b, A visual comparison between CosMx-based cell type annotation and S2-omics cell type prediction. CNT, connecting tube cells; DCT, distal convoluted tubule cells; IC, intercalated cells; PC, principal cells; VSMC, vascular smooth muscle cells; EC, endothelial cells; LOH, loop of Henle cells; PT, proximal tube cells. For all superpixels that have CosMx-based cell type annotation, their histology features and annotations served as training data. Cell type labels of all superpixels that passed quality control were predicted using the trained model through their histology features. c, A visual comparison between glomerulus (glom)-related cells identified with CosMx data and glom-related cells predicted by S2-omics. The glom-related cells include EC_glom, podo and glomerular PEC. d, Visualization of S2-omics cell type predictions based on ROIs and FOVs. The prediction models were trained only using spatial omics data in the ROIs or the FOVs.
To further assess the quality of S2-omics-selected ROIs, we performed cell-level label broadcasting. However, owing to the limited tissue coverage in the original CosMx data and the low cell and molecule capture efficiency of the measured FOVs, the data exhibited patchy patterns with noticeable tissue gaps. As a result, gene expression was missing for many cells, making it infeasible to assign gene expression-based cell-level labels as gold standard for evaluation. To address this issue, we first annotated cell type labels for cells captured in the CosMx experiment and then used S2-omics to broadcast these labels to the surrounding, unmeasured cells. The resulting CosMx-based and S2-omics-enhanced cell type distributions are shown in Fig. 4b. The dense and contiguous predictions generated by S2-omics enabled clearer identification of tissue structures, as demonstrated by a glomerulus surrounded by Bowman’s capsule.
With both CosMx-based and the enhanced cell type labels, we assessed the quality of S2-omics ROIs/FOVs through cell type broadcasting experiments using two key metrics: prediction accuracy compared with the CosMx derived labels and prediction consistency compared with the enhanced labels. As shown in Fig. 4c, when the broadcasting model was trained using CosMx data from the S2-omics-selected ROIs, we achieved a cell type prediction accuracy of 0.731 and a consistency of 0.657. Even when trained on just 11 small FOVs, the model maintained relatively high accuracy (0.657) and consistency (0.542). Although the accuracy for FOV-based recovery was lower, the two ROIs covered a noticeably larger tissue area compared with the 11 small FOVs (50 mm2 versus 2.75 mm2). This stark difference demonstrates that S2-omics can efficiently capture representative cells from a wide range of cell types and tissue structures and enable robust feature characterization even under strict budget constraints. Since RNA and protein degradation occur over time often forces spatial omics experiments to balance quality against tissue coverage, S2-omics offers a practical solution. Its intelligent FOV selection strategy maximizes the capture of biologically informative regions while minimizing the total experimental area required, thereby helping to mitigate the quality-versus-scale trade-off.
Optimal ROI selection should preserve not only cellular diversity but also key tissue structures. In the kidney, one such critical structure is the glomerulus, which comprises three key cell types: glomerular endothelial cells (EC_glom), podocytes (podo) and glomerular parietal epithelial cells (PEC). Previous studies have established that T2D is associated with a reduction in podo abundance, contributing to glomerular loss in diabetic nephropathy33,34. Therefore, an effective ROI selection strategy in this context should capture both healthy and T2D glomeruli while enabling robust identification of associated cell types using cells within the selected regions. As shown in Fig. 4a, S2-omics selected one ROI from the healthy tissue and one from the T2D tissue. For FOV-based selection, six FOVs were identified in the healthy section and five in the T2D section. Both selection strategies successfully captured representative glomeruli from each condition, allowing accurate reconstruction of the spatial distribution of glomerular cell types across the entire tissue specimen. Figure 4d shows that, using only cell type labels derived from the selected ROIs or FOVs, S2-omics precisely reconstructed the spatial architecture of glomeruli, effectively capturing differences between healthy and T2D tissues. These results highlight the ability of S2-omics to identify and preserve distinct, biologically relevant structures, even when such features exhibit subtle morphological differences. Moreover, S2-omics implicitly addresses common technical challenges in spatial transcriptomics, such as low cell capture rates and missing FOVs, by generating dense, contiguous and whole-slide cell type maps. This enhanced both the quality and interpretability of CosMx data, facilitating more robust downstream biological investigations.
Incorporating prior knowledge in ROI selection
In the previous applications, S2-omics treated all tissue regions equally during ROI selection, which is suitable for most scenarios. However, we recognize the importance of allowing user-defined prioritization of specific tissue ROIs. To demonstrate the ability of S2-omics to incorporate prior knowledge in ROI selection, we analysed a CRC tissue section (P1 CRC), where smooth muscle tissue that occupies about 32.1% of the tissue section was of lower interest (Fig. 5a, red contour). Without prior information, S2-omics default selection (Fig. 5b) included 5.1% of muscle associated regions (cluster 3 and cluster 9). When negative prior information about smooth muscle was incorporated into ROI selection (Fig. 5a, red superpixels), S2-omics identified a better ROI than the default selection, ignoring all the smooth muscle region.

An example of incorporating ‘negative prior’ information in ROI selection, applying S2-omics on a CRC tissue section (P1 CRC). ‘Negative prior’ refers to regions that are of less interest to researchers and can be discarded in ROI selection. In contrast, ‘positive prior’ refers to regions that researchers are mostly interested in. a, Visualization of a ‘negative prior’ where the ‘negative prior’ is a smooth muscle-dominated region. b, Visualization of the histology cluster compositions for an ROI selected by S2-omics without (w/o) prior (dotted red box) and ROI selected by S2-omics with (w/) prior (red box). c, An example of incorporating ‘positive prior’ in ROI selection, applying S2-omics on a gastric cancer tissue section. Here, the ‘positive prior’ is the carcinoma region. Visualization of the histology cluster compositions of the S2-omics-selected ROI without prior (dotted red box) and with prior (red box).
In practical applications, researchers may often have a specific interest in certain tissue areas, for example, the tumour region in a cancer sample. To illustrate this, we provided an example of adding ‘positive prior’ for a gastric cancer tissue section where the tumour cell occupied approximately one third of the section (Fig. 5c, blue contour). The default S2-omics ROI selection algorithm identified a ROI that included 83.9% normal and 16.1% tumour regions, reflecting the overall normal and tumour cell distribution in the entire tissue section. To mimic a researcher’s preference for tumour-focused analysis, we introduced a ‘positive prior’ by giving cluster 6, which matched well with carcinoma area, greater weight in the ROI selection process. This guided approach produced an ROI with 78.1% tumour content, demonstrating how user-defined priorities can effectively influence ROI selection and maximize the retrieval of desired information. In this example, the prior preference parameter ({rm{alpha }}) was set to 5, indicating the emphasized histology clusters are 5 times more important than other clusters (for details see Methods). Users can adjust this parameter to control the degree to which ROI selection prioritizes histology clusters with positive priors.
Applications to additional tissue types
To demonstrate the broad applicability of S2-omics, we applied it to additional tissue types. First, we analysed a breast cancer section (BC S1) with paired Xenium gene expression data to illustrate the ability of S2-omics to automatically determine the optimal number of ROIs. As shown in Fig. 6a, this sample includes both invasive cancer (cluster 9) and ductal carcinoma in situ (DCIS, cluster 8) regions. The invasive cancer is mainly located in the left half of the section, while the DCIS occupies the right half, making it challenging for a single small ROI to capture representative areas for both cancer types. To show a single ROI is insufficient to encompass all relevant tissue structures, we fixed the size of each ROI at 2 mm × 2 mm. Figure 6a displays the ROIs selected by S2-omics when the number of ROIs was set to one, two and three. S2-omics determined that two 2 mm × 2 mm ROIs were optimal for this sample as the ROI score increased noticeably when increasing from one to two ROIs but only showed a minor improvement when expanding from two to three.

a,b, The application of S2-omics to a breast cancer tissue section with a fixed ROI size (2 mm × 2 mm) but different numbers of ROIs: a visual comparison among S2-omics-selected ROIs when the numbers of ROIs are 1, 2, 3 and 4, and the corresponding pie charts for the histology cluster compositions (a) and Xenium-based cell type annotation and cell type predictions using various numbers of ROIs (b). Three representative areas of this section were selected for detailed comparison, where ‘area 1’ is a DCIS region surrounded by invasive cancer region, ‘area 2’ is an immune-infiltrated DCIS, region and ‘area 3’ is a typical DCIS region. c, A comparison of running time and ROI quality when applying S2-omics to a CRC section (P5 CRC) with different downsampling rates for histological feature extraction. The size of ROI was fixed at 6.5 mm × 6.5 mm. ROI quality was measured by the ROI score and the overlap rate with the ROI selected by an experienced pathologist.
To validate that two ROIs are sufficient while one ROI is not enough to effectively capture molecular variations in the tissue, we further examined cell type predictions from models trained using one, two and three ROIs. For a more detailed comparison, we selected three small representative areas and analysed the differences between Xenium-derived cell type annotations and predictions obtained with different numbers of ROIs for model training. The selected areas include a DCIS region surrounded by invasive cancer (area 1), an immune-infiltrated DCIS (area 2) and a typical DCIS (area 3) (Fig. 6b). As shown in Fig. 6b, all three models accurately predicted area 1. However, models trained with two and three ROIs provided better predictions for cell type distribution in areas 2 and 3 compared with the model trained with only one ROI. Notably, there was little difference between predictions obtained with two and three ROIs. The prediction accuracies are 75.1% with one ROI, 85.5% with two ROIs, 88.9% with three ROIs and 90.6% with four ROIs. These results indicate that two ROIs are sufficient to effectively characterize the cellular variations and tissue microenvironments present in this tissue section, making it an optimal selection for this section. These findings further validate the ability of S2-omics to automatically determine the optimal number of ROIs for efficient and informative tissue profiling.
To demonstrate the flexibility of S2-omics in handling diverse tissue types, we conducted additional experiments in which the number of ROIs was automatically determined. We applied S2-omics to additional cancer tissue samples (Extended Data Fig. 4 and Supplementary Figs. 3 and 4), and in all cases, it consistently selected optimal ROIs that captured representative tumour regions and enabled accurate reconstruction of spatial architecture across the entire tissue section. In a second breast cancer sample (BC S2) with paired Xenium gene expression data (Extended Data Fig. 4), S2-omics-selected ROI led to 76.2% accuracy in cell type prediction, 53.8% accuracy in cell community prediction and 90.6% accuracy in tumour cell prediction. Similar results were obtained in a liver cancer sample (Supplementary Fig. 3) and a kidney cancer sample (Supplementary Fig. 4). We further evaluated S2-omics on one healthy kidney section and one liver tissue section, both with paired Xenium gene expression data, to assess its ability to select ROIs that capture repetitive structural patterns. As shown in Supplementary Figs. 5 and 6, S2-omics effectively identified glomerular structure in the kidney and hepatic lobule structure in liver using minimal ROI areas. The biological information extracted from these ROIs enabled accurate reconstruction of cell types and cell communities across unmeasured tissue regions, highlighting the potential of S2-omics to reduce experimental costs while preserving comprehensive biological information.
Evaluation of S2-omics in non-standard scenarios
Previous evaluations focused on standard settings where tissues were large or histology is strongly correlated with molecular variation. To assess performance in more complex, real-world contexts, we examined four non-standard and more challenging scenarios. The first involved a whole-slide image (WSI) containing multiple small breast cancer biopsies of varying quality, including distorted adipose-dominated regions. Pathologist annotations identified four tissue regions: invasive cancer, benign breast tissue, benign stroma and benign fibro-adipose tissue (Extended Data Fig. 5, left). Using 1 mm × 1 mm ROI specifications, S2-omics automatically selected two ROIs, with one from invasive cancer and one from mixed benign breast tissue and stroma, while avoiding selecting low-quality benign fibro-adipose (Extended Data Fig. 5, right). These results reflected unbiased ROI selection without prior knowledge. With invasive cancer and histological clusters 1, 10, 13 and 14 specified as positive priors, S2-omics reoptimized ROI selection and identified two alternative ROIs that specifically targeted the invasive cancer regions, demonstrating adaptability to research-specific priorities (Supplementary Fig. 7). Beyond square ROIs, S2-omics also supports circular ROI selection, making it suitable for design of tissue microarrays (Supplementary Fig. 8).
Next, we applied S2-omics to three consecutive H&E-stained breast cancer sections35 containing both invasive cancer and immune infiltrates. Joint image segmentation of all sections yielded 15 consistent histological clusters, from which S2-omics selected a single ROI spanning with histological pattern spanning all sections and capturing both invasive cancer and immune infiltrates (Fig. 7a,b). This example demonstrates the capacity of S2-omics for robust, biologically relevant ROI selection in multisection analyses.

a,b, The application to a breast cancer sample: a pathologist’s annotation and H&E images of the consecutive sections (G1, G2 and G3) (a) and a 1.5 mm × 1.5 mm ROI selected by S2-omics, visualized on the joint histology segmentations of the consecutive sections obtained with S2-omics (b). c,d, The application to a CRC sample: an H&E image, joint segmentation and cell type prediction of slice 1 in which the H&E image was stained before the Visium HD experiment (c) and an H&E image, joint segmentation and cell type prediction of slice 2, in which the H&E image was stained after the Xenium experiment (d). The dashed red box indicates the ROI manually selected by the 10x pathologist, within which the Visium HD experiment was performed. Cell type labels derived from Visium HD data within the pathologist-selected ROI were exclusively used for training the S2-omics label broadcasting module. The red box refers to the 6.5 mm × 6.5 mm ROI selected by S2-omics.
In the third scenario, we analysed a CRC dataset involving two consecutive H&E sections, one high quality and one post-Xenium with staining artefacts (Fig. 7c,d). Despite severe batch effects between the two H&E images, S2-omics extracted histological features from both sections and performed joint segmentation, yielding 15 consistent clusters. It then selected a representative ROI with histological patterns spanning both sections, spatially proximal to the ROI manually chosen by the 10x expert. Additionally, cell type labels from Visium HD profiling of the 10x-selected ROI in section 1 was successfully broadcast across both sections, demonstrating that label broadcasting effectively mitigates batch effects and supports multisection analyses.
Finally, we tested S2-omics when histology and molecular profiles are weakly correlated. In a gastric cancer section with rare signet-ring cells (1.94% of spots) and subtle morphology, S2-omics segmented the H&E image into 15 clusters, with clusters 8 and 10 corresponding to the pathologist annotated signet-ring cells (Fig. 8a–d) and consistently enriching them across different ROI sizes (Fig. 8e). Importantly, signet-ring cells represent an early stage diffuse-type gastric carcinoma feature that is difficult to detect from H&E alone, highlighting the challenge of this case. In breast cancer, where CD4⁺ and CD8⁺ T cells are morphologically indistinguishable in H&E, S2-omics preserved their near-original proportions in selected ROIs (Extended Data Fig. 6). These results underscore the ability of S2-omics to identify informative ROIs even when morphological cues are weak.

a, An H&E image with magnified views of signet-ring cells from three distinct regions within the tissue section. b, The pathologist annotation of each Visium spot based on the H&E image. GSE, gastric surface epithelium; Lymph agg, lymphoid aggregates; GMG, gastric mucous glands. c, Histology clusters identified from the H&E image using S2-omics. d, Manually annotated signet-ring cells and histology clusters 8 and 10, showing noticeable spatial colocalization. e, ROIs selected by S2-omics, visualized on the H&E image, pathologist annotation of each Visium spot and the spatial distribution of signet-ring cells. The ROI size was set as 2 mm × 2 mm, 4 mm × 4 mm and 6.5 mm × 6.5 mm, respectively.
Robustness of S2-omics to the number of histology clusters and ROI size
S2-omics adopts a two-stage clustering strategy in which a tissue section is first partitioned into a relatively large number of preliminary clusters, followed by a guided merging process to produce the final segmentation (Methods). To evaluate the impact of cluster number selection on ROI identification, we applied S2-omics to a gastric cancer dataset while varying the final cluster numbers from 5 to 20. Remarkably, S2-omics consistently selected nearly identical tissue regions regardless of the chosen cluster number (Extended Data Fig. 7). This stability demonstrates the robustness of the ROI selection algorithm to moderate variations in tissue segmentation granularity.
To further investigate the impact of the number of histology clusters and ROI size on ROI selection, we conducted a series of experiments using the previously introduced gastric cancer dataset. In this analysis, we segmented the histology image with cluster numbers set to 6, 9, 12, 15, 18 and 21. For each segmentation result, we selected ROIs of three different sizes: 2 mm × 2 mm, 4 mm × 4 mm and 6 mm × 6 mm. As shown in Supplementary Fig. 9, S2-omics demonstrates greater robustness when the number of histology clusters or the ROI size increases. Notably, even with the smallest 2 mm × 2 mm ROIs, S2-omics successfully identified ROIs when provided with detailed histology segmentation, highlighting its effectiveness in selecting meaningful tissue regions.
Computational efficiency of S2-omics
To effectively guide spatial omics experiments, an ROI selection algorithm must be computationally efficient, allowing users to receive feedback quickly. S2-omics extracts histology image features using foundation models such as UNI. However, since S2-omics captures local image features at near single-cell resolution, processing large H&E images, which often contain hundreds of millions of pixels, can be computationally intensive. To enhance computational efficiency, S2-omics employs a downsampling strategy, where superpixels are down sampled based on a predefined downsampling rate. Our systematic evaluation of the computational performance of S2-omics across various H&E image dimensions and downsampling rates (Fig. 6c) showed that a 1:100 downsampling rate provides an optimal balance between ROI quality and processing speed. With this approach, S2-omics can select ROIs for a 20 mm × 20 mm tissue section in just 15 min on an Nvidia Tesla V100 16GB Tensor Core GPU, considerably improving usability without compromising accuracy.
Discussion
Here, we present S2-omics, an automated framework that uses only H&E images to guide spatial omics experimental design. This tool addresses two critical challenges in current spatial molecular profiling studies: subjective ROI selection and suboptimal experimental design. By leveraging recently developed pathology image foundation models to extract histological features, S2-omics identifies the most representative regions for analysis. When prior knowledge is available, it can prioritize or de-emphasize specific tissue areas, increasing its adaptability to diverse experimental needs.
Beyond ROI selection, S2-omics provides a virtual preview of whole-tissue molecular organization through cell type and cell community label broadcasting. By extrapolating information from limited spatial molecular data within the selected ROIs, S2-omics reconstructs tissue-wide cellular architecture, offering users an early, tissue-scale perspective before full experimental profiling. This approach not only informs downstream experimental design but also addresses technical challenges such as discontinuous sampling in certain platforms such as CosMx. Together, the speed, flexibility and tissue-wide inference capabilities make S2-omics a powerful tool for standardizing and optimizing spatial molecular profiling experiments.
While the current implementation is based on H&E images, S2-omics can be readily extended to incorporate other histological stains, such as trichrome, Elastica van Gieson stain or other stained images, for ROI selection. Furthermore, S2-omics can be adapted for ROI selection based on tissue regions defined by other molecular data. For instance, it can select ROIs based on cell types identified from PhenoCycler-Fusion and subsequently conduct spatial transcriptomics using the ROIs recommended by S2-omics13.
Although S2-omics has demonstrated strong performance, several limitations remain. First, it currently cannot accept DAPI or immunofluorescence images as input owing to the lack of appropriate feature extraction models for these image types. Second, S2-omics relies on pathology image foundation models for feature extraction that, while effective, require downsampling to maintain reasonable processing speed. Eliminating this need through more efficient feature extraction will be a priority for future development. Third, the current implementation handles only a small number of samples by concatenating them into a single composite image, a strategy that is not scalable for large-scale studies. Addressing these constraints will be essential for enabling S2-omics to fully support spatial omics design.
Given the growing interest in spatial omics, we anticipate that S2-omics will serve as a foundational tool for researchers, which enables them to allocate resources effectively by focusing on the most critical tissue regions and maximizing information gained from their experiments. This standardization is especially crucial for clinical and disease-focused studies, where consistent and reproducible outcomes are essential for generating meaningful and translatable biological insights. By addressing this fundamental yet overlooked step, S2-omics establishes a standard for experimental rigour and reproducibility in spatial omics research.
Methods
S2-omics consists of three components: a histology image feature extractor, a ROI selector and a whole-slide cell type/cell community broadcaster. Below, we provide a detailed description of each component.
Histology feature extractor
To facilitate the processing of histology images with different resolutions, we first rescaled each image so that the size of one pixel is 0.5 µm × 0.5 µm. This rescaling ensures that each 16 × 16-pixel tile, or superpixel, corresponds to 8 µm × 8 µm, approximately the size of a single cell. To ease the subsequent tiling procedure, we pad the rescaled image so that its height and width are both divisible by 224. A simple quality control process is applied to all superpixels. Specifically, superpixels with high average RGB values and low RGB variance are filtered out as they typically correspond to background regions or areas without nuclei. While any histology image feature extraction method can be used to obtain features for each superpixel, in this paper, we chose to use UNI21.
Let (Xin {R}^{{M}}times {R}^{{N}}times {R}^{{3}}) be the histology image with height (M) and width (N), and three RGB colour channels. We partition (X) into a ((M/16))-row, ((N/16))-column rectangular grid of 16 × 16-pixel image tiles: (X=)({({X}_{{m}_{1}{n}_{1}})}_{{m}_{1}=1,{n}_{1}=1}^{M/16,N/16}), where each ({X}_{{m}_{1}{n}_{1}}in {R}^{16}times {R}^{16}times {R}^{3}). Next, we crop all 224 × 224-pixel neighbourhood tiles that have a 16 × 16-pixel tile ({X}_{{m}_{1}{n}_{1}}) at its centre: ({X}^{mathrm{neighbour}}={({X}_{{m}_{1}{n}_{1}}^{mathrm{neighbour}})}_{{m}_{1}=1,{n}_{1}=1}^{M/16,N/16}), where each ({X}_{{m}_{1}{n}_{1}}^{mathrm{neighbour}}in {R}^{224}times {R}^{224})(times {R}^{3}). Centred on the small tile ({X}_{{m}_{1}{n}_{1}}), the large tile ({X}_{{m}_{1}{n}_{1}}^{mathrm{neighbour}}), which encompasses about 200 cells, captures the tissue microenvironment surrounding the centre cell. Extracting image features for all 16 × 16-pixel tiles and their corresponding 224 × 224-pixel neighbourhood tiles can be time consuming. To reduce computational time, a downsampling procedure can be applied to both (X) and ({X}^{mathrm{neighbour}}), avoiding extracting histology image features for every superpixel. In practice, we recommend using a down sampling rate of 1/100 for ROI selection to effectively reduce computational cost. In Fig. 6c we show that this downsampling strategy considerably reduces computational time while maintaining high accuracy in ROI selection.
In our recent iStar paper20, we demonstrated that hierarchically extracted image features are crucial for capturing both global and local image characteristics, which are essential for super-resolution gene expression prediction. However, foundation models such as UNI lack the capability to hierarchically extract such image features. To mimic the hierarchical image feature extraction used in iStar, we employ a 224 × 224-to-16 × 16 vision transformer (ViT)25, denoted as ({f}_{mathrm{ViT}}). The ViT maps each 224 × 224-pixel neighbourhood tile into a (C_{1})-dimensional feature vector,
$${z}_{{m}_{1}{n}_{1}}^{mathrm{neighbour}}={f}_{mathrm{ViT}}left({X}_{{m}_{1}{n}_{1}}^{mathrm{neighbour}}right)in {R}^{{{{C}}}_{1}}.$$
We introduce another function, ({f}_{mathrm{ViT}}^{,mathrm{inter}}), which extracts features of the 16 × 16-pixel tile located at the centre of the current 224 × 224-pixel neighbourhood tile. This function utilizes the output of the second-to-last layer of ({{rm{f}}}_{{rm{ViT}}}), yielding a ({{{C}}}_{2})-dimensional feature vector,
$${z}_{{m}_{1}{n}_{1}}={f}_{mathrm{ViT}}^{,mathrm{inter}}({X}_{{m}_{1}{n}_{1}})in {R}^{{{{C}}}_{2}}.$$
Next, we concatenate the local and neighbourhood features to obtain a combined histology feature image (H={({h}_{{m}_{1}{n}_{1}})}_{{m}_{1}=1,{n}_{1}=1}^{M/16,N/16}) of ({{{C}}}_{1}+{{{C}}}_{2}) channels, where each ({h}_{{m}_{1}{n}_{1}}in {R}^{{{{C}}}_{1}+{{{C}}}_{2}}) is the histology feature vector at superpixel (({m}_{1}{,n}_{1})).
In our implementation, we use UNI as ({f}_{mathrm{ViT}}), thus setting ({{{C}}}_{1}=)({{C}}_{2}=2,048). The user can replace UNI here with any pathology foundation model as long as its model structure is 224 × 224-to-16 × 16 ViT. In addition to the default UNI, S2-omics also provides additional foundation models, including HIPT25, Prov-GigaPath29 and Virchow2 (ref. 30) as options. Our evaluations have shown that the computational efficiency varies substantially across models. HIPT-based feature extraction is ten times faster than UNI owing to its more compact architecture and smaller training dataset. In contrast, GigaPath and Virchow2 require approximately three times longer processing times than UNI, consistent with their larger model sizes and computational complexity (Extended Data Fig. 8).
ROI selector
The ROI selector is designed to identify ROIs based on histology image segmentation. We consider two approaches for ROI selection: (1) without prior knowledge, where ROIs are chosen in an unbiased manner based solely on H&E image-derived features and (2) with prior knowledge, where biological or pathological information is incorporated to prioritize or de-emphasize specific tissue structures or cellular compositions during ROI selection.
Histology image segmentation
Once the histology image features are extracted, we segment the image into different clusters. First, we reduce the dimensionality of the histology image features using principal components analysis. Each dimensionality reduced feature vector includes 80 principal components, representing histological information in a 16 × 16 superpixel tile. These superpixels serve as individual samples, which we then cluster using the K-means algorithm. To capture hierarchical relationships among clusters and minimize the influence of outliers, we apply a two-stage hierarchical strategy. In the first stage, histological features are partitioned into a relatively large number of preliminary clusters using the K-means algorithm. A subsequent merging step consolidates over-segmented clusters based on image feature similarity. This approach minimizes the influence of outliers, which are later merged into stable and biologically meaningful regions in the final segmentation output. By default, S2-omics initializes with 20 clusters and merges them to about 15 under this procedure, a configuration that performed robustly across datasets in this study. We recommend this default and suggest adjusting parameters as needed for specific data types. Since histological patterns are strongly correlated with molecular variations, we will use these histology-based clusters to select ROIs. Spatial omics experiments conducted within these selected ROIs are expected to capture most molecular variations across the entire tissue slice.
While K-means serves as the default clustering algorithm owing to its robust performance (Extended Data Fig. 9), S2-omics also supports agglomerative clustering, BIRCH, Bisecting K-means, Fuzzy C-means, Leiden and Louvain as additional options, providing flexibility to accommodate diverse real-world datasets.
ROI selection without prior knowledge
We first illustrate our ROI selection algorithm when no prior knowledge about the tissue slice is available. In this case, the entire tissue slice is subject to ROI selection. S2-omics requires users to specify only the size of the ROI, after which the algorithm either identifies the optimal single ROI or automatically determines the optimal number and locations of multiple ROIs. For simplicity, we assume all ROIs are square shaped and of the same size. However, the algorithm can be easily modified to accommodate ROIs of varying sizes and non-square shapes if needed. Hereafter, a ROI refers to a square shaped region with pre-specified size by users. Our goal is to select ROI(s) from the entire tissue slice so that the tissue variations, as represented by histological clusters, in the entire tissue can be captured by the selected ROI(s).
Suppose our goal is to select R optimal ROIs ({{{rm{ROI}}}_{1},{{rm{ROI}}}_{2},ldots ,{{rm{ROI}}}_{{rm{R}}}}), where we need a metric to evaluate how effectively these square-shaped regions capture the tissue variation in the WSI. For simplicity, we call superpixels that passed quality control as valid superpixels in the following context. Ideally, selected ROIs should be representative of the tissue, meaning they should effectively capture tissue variations as reflected by histological clusters in the H&E image. To achieve this, the selected ROIs should satisfy two key criteria:
- 1.
Maximizing tissue content: the selected ROIs should minimize empty regions and capture as much tissue as possible.
- 2.
Ensuring cluster representativeness: the ROIs should include a diverse range of histological clusters, ensuring that both major and rare clusters are well represented. When no prior knowledge about the tissue is available, the ROIs should aim for equal representation of all tissue structures, capturing both common and rare histological patterns.
Guided by these principles, an ROI scoring metric should incorporate the following components: the first component is the coverage score, ({S}_{mathrm{coverage}}), which quantifies the proportion of valid superpixels within the selected ROIs. It is defined as
$${S}_{mathrm{coverage}}=sqrt{{sum }_{r=1}^{R}{n}_{mathrm{QC}}^{r}left/{sum }_{r=1}^{R}right.{n}^{r}},$$
where ({n}^{{r}}) is the number of superpixels in the (r)-th ROI ({{rm{ROI}}}_{{rm{r}}}), and ({n}_{mathrm{QC}}^{r}) is the number of superpixels that passed quality control within that ROI. This score encourages the selection ROIs with densely distributed cells rather than cell-sparse regions. The square root transformation is applied to ensure sparsely populated histological clusters are not over penalized. This adjustment prevents the ROI selection strategy from systematically ignoring regions with lower cell densities, which may still hold important biological significance.
The second component is the balance score, ({S}_{mathrm{balance}}), which evaluates how well the histological cluster distribution in the selected ROIs aligns with an ideal uniform distribution. Let ({{bf{C}}}_{mathrm{ROIs}}=({{{C}}}_{1},ldots ,{{{C}}}_{K})) represent the proportion of each histological cluster in the selected ROIs, and ({{bf{C}}}_{mathrm{Target}}=left[frac{1}{K},frac{1}{K},ldots ,frac{1}{K}right]) denote the ideal scenario where all clusters are equally represented. The balance score is defined as the cosine similarity between these two vectors
$${S}_{mathrm{balance}}=frac{{{bf{C}}}_{mathrm{ROIs}}bullet {{bf{C}}}_{mathrm{Target}}}{left|left|{{bf{C}}}_{mathrm{ROIs}}right|right|{mathrm{||}{bf{C}}}_{mathrm{Target}}mathrm{||}}=frac{{sum }_{k=1}^{K}{{{C}}}_{{k}}/K}{sqrt{{sum }_{k=1}^{K}{{{C}}}_{k}^{2}}sqrt{{sum }_{k=1}^{K}1/{K}^{2}}}.$$
This score ensures that the selected ROIs capture a diverse range of histological clusters, with rare clusters receiving appropriate representation.
To create an effective ROI selection metric, we must also account for diminishing returns when selecting additional ROIs. As the number of ROIs increases, the marginal benefit of adding another ROI decreases when the experimental cost continues to rise. To address this, we introduce a size score, ({S}_{mathrm{size}}), which reflects the impact of the total ROI size on overall quality. The size score is defined as the inverse of a logit function over the effective sampling rate of valid superpixels within the selected ROIs
$${S}_{mathrm{size}}=frac{1}{1+exp left(-2{sum }_{r=1}^{R}{n}_{mathrm{QC}}^{r}/{N}_{mathrm{QC}}right)},$$
where ({n}_{mathrm{QC}}^{r}), as mentioned previously, is the number of superpixels that passed quality control within that ROI, and ({N}_{mathrm{QC}}) is the total number of superpixels that passed quality control in the entire tissue slice. This function ensures that the score increases more slowly as the number of selected ROIs grows, balancing coverage and representativeness against experimental feasibility.
The final ROI score, ({S}_{mathrm{ROI}}), is defined as the weighted geometric mean of three component scores, including balance, coverage and size (Extended Data Fig. 10)
$${S}_{mathrm{ROI}}={S}_{mathrm{balance}}^{{w}_{1}}times {S}_{mathrm{coverage}}^{{w}_{2}}times {S}_{mathrm{size}}^{{w}_{3}}{,}$$
where ({w}_{1},{w}_{2},{w}_{3}) are tunable weights of non-negative real numbers that sum to 1, reflecting the relative importance of each component. In this study, we used the default setting (({w}_{1},{w}_{2},{w}_{3})=(frac{1}{3},frac{1}{3},frac{1}{3})), which prevents any single component from dominating the final score and ensures a balanced trade-off between maximizing tissue content, preserving histological diversity, and controlling experimental cost. Users may adjust these weights to emphasize specific priorities for their experimental design.
ROI selection using ROI scores
Next, we describe the procedure for selecting ROIs using this metric. When (R=1), we begin by randomly sampling (L) candidate ROIs from all possible ROIs centred within the tissue section. The ROI with the highest ({S}_{mathrm{ROI}}) score is selected as the optimal ROI. We set (L=500times {A}_{mathrm{WSI}}/{A}_{mathrm{ROI}}), where ({A}_{mathrm{WSI}}) and ({A}_{mathrm{ROI}}) denote the areas of the whole tissue section and a single ROI, respectively. The rationale behind this choice is that when the ROI size is large or the overall tissue section is small, fewer randomly sampled ROIs are needed to ensure comprehensive coverage of the tissue section.
When (R > 1), we need to address two questions: (1) determining the optimal number of ROIs and (2) identifying the optimal locations for these ROIs. There are two natural approaches to solving this dual problem. One approach is to select all ROIs simultaneously, but this requires an extremely large number of samples, as the search space grows exponentially with (R). The alternative approach is to selected ROIs sequentially, choosing ({mathrm{ROI}}_{r+1}) based on the previously selected ROIs ({{mathrm{ROI}}_{1},{mathrm{ROI}}_{2},ldots ,{mathrm{ROI}}_{{r}}}). However, this greedy strategy only guarantees local optimality at each step, which may lead to a suboptimal final set ({{mathrm{ROI}}_{1},{mathrm{ROI}}_{2},ldots ,{mathrm{ROI}}_{{R}}}). To balance computational efficiency with selection quality, we adopt a hybrid strategy:
-
For (R=2), we select the best ROI pair ({{{rm{ROI}}}_{1},{{rm{ROI}}}_{2}}) simultaneously among from ({L}^{2}) randomly sampled pairs, where L is defined as before.
-
For (R=2m), we divide the selection procedure into (m) steps, selecting the best ROI pair in each step from ({L}^{2}) randomly sampled pairs, conditioning on the previously selected pairs.
-
For (R=2m+1), we first determine the best ({{mathrm{ROI}}_{1},{mathrm{ROI}}_{2},ldots ,{mathrm{ROI}}_{2m}}) based on the pair-based selection strategy, and then add one final ROI from (L) random samples to maximize ({S}_{mathrm{ROI}}).
This hybrid approach ensures a more computationally feasible process while maintaining high-quality ROI coverage and representativeness.
Determination of the optimal number of ROIs
The optimal number of ROIs is determined through an iterative process, where we start from (R=1) upwards until the change in ({S}_{mathrm{ROI}}) falls below a predefined threshold ({rm{tau }}). Specifically, when reaching the optimal ROI score ({R}_{mathrm{optimal}}), we ensure that
-
The increase in ({S}_{mathrm{ROI}}) from ({R}_{mathrm{optimal}}) to ({R}_{mathrm{optimal}}+1) is smaller than ({rm{tau }}).
-
The increase in ({S}_{mathrm{ROI}}) from ({R}_{mathrm{optimal}}) to ({R}_{mathrm{optimal}}+2) is smaller than (2{rm{tau }}).
For all ROI selection experiments, we set ({rm{tau }}) at 0.03, while for FOV selection experiments, ({rm{tau }}) was set to 0 to enforce a stricter selection criterion.
ROI selection with prior knowledge
Experienced pathologists can refine ROI selection by leveraging prior knowledge. To mimic this capability, S2-omics offers an option for users to incorporate prior information into the ROI selection process. Specifically, after histology clusters are identified, users can designate certain clusters to be emphasized or discarded. The new balance score, ({S}_{mathrm{balance}}^{mathrm{prior}}), is calculated using the modified target proportion vector, ({{bf{C}}}_{mathrm{target}}^{mathrm{prior}}), which incorporates prior information. Suppose that among the (K) histology clusters, the user intends to emphasize clusters ({i}_{1},{i}_{2},ldots ,{i}_{{p}}) while excluding clusters ({j}_{1},{j}_{2},ldots ,{j}_{{q}}) from the ROI section. In this case, the prior target cluster proportion vector is defined as
$${{bf{C}}}_{mathrm{target}}^{mathrm{prior}}left({rm{i}}right)=left{begin{array}{rcl}frac{1+{rm{alpha }}}{K+{rm{alpha }}p-q}, & mathrm{if}iin {{i}_{1},{i}_{2},ldots ,{i}_{p}} & \ 0 & mathrm{if}iin {{,j}_{1},{j}_{2},ldots {,},{j}_{q}}, & forall i=1,2,ldots ,K.\ frac{1}{K+{rm{alpha }}p-q}, & mathrm{otherwise} & end{array}right.$$
Here ({{bf{C}}}_{mathrm{target}}^{mathrm{prior}}left(iright)) denotes the target proportion of cluster i, and ({rm{alpha }}) is the prior preference parameter that quantifies the user’s desired degree of emphasis. Specifically, clusters designated as positive priors are treated as ({rm{alpha }}) times more important than standard clusters. This formulation can be readily generalized to cases involving both positive and negative priors across multiple histological clusters. The final ROI score, ({S}_{mathrm{ROI}}), is then calculated using this revised balance score, while the overall ROI selection strategy remains consistent with the approach used in the absence of prior knowledge.
ROI selection for multiple tissue sections
S2-omics also supports ROI selection across multiple tissue sections. When multiple H&E images are available, S2-omics standardizes them by padding each image to uniform dimensions and concatenating them horizontally to construct a composite mega-image. This pre-processing step transforms multisection data into a single-section format, allowing the same feature extraction and ROI selection procedures used for individual sections to be applied consistently. In doing so, S2-omics ensures a unified and reproducible analytical workflow regardless of the number of sections under study.
Whole-slide cell type–cell community predictor
Once the ROIs are selected, spatial omics experiments will be conducted within these regions. The resulting data will enable us to characterize cell types present in the ROIs, and this information can subsequently be used to broadcast cell types and cell communities across the remaining portions of the tissue that were not subjected to spatial omics measurements. The whole-slide information predictor contains two auto-encoders, one for cell type label broadcasting and the other for cell community label broadcasting. A cell community is defined as a group of cells with similar cell type compositions within their surrounding neighbourhoods. Specifically, for each cell, its neighbourhood is determined by the 500 nearest neighbouring cells, identified using Euclidean distance based on their spatial locations. Similar concepts have been proposed by Schurch et al.36 and others37, which have demonstrated that cell communities often exhibit stronger association with clinically relevant phenotypes compared with traditionally obtained cell clusters. Below we describe the process for predicting cell type labels from histology images.
Suppose we have (n) cells within the selected ROIs, where each cell belongs to one of ({C}_{y}) different cell types. These cells’ cell type labels are given by (y=left{{y}_{1},{y}_{2},ldots ,{y}_{{n}}right}) and the corresponding histological features are (h=left{{h}_{1},{h}_{2},ldots ,{h}_{{n}}right}). To reduce the dimensionality of the histological features, we introduce an autoencoder consisting of an encoder, ({f}_{mathrm{enc}}), which maps the high-dimensional histological features to a lower-dimensional latent space, and a decoder, ({f}_{mathrm{dec}}) that reconstructs the original histological features from the latent representations. Additionally, we use a predictor ({f}_{mathrm{cls}}) to classify the cell type labels based on the latent embeddings from the autoencoder. The training objective consists of two components, including a reconstruction loss
$${L}_{mathrm{recon}}=frac{1}{2}mathop{sum }limits_{i=1}^{n}({left(,{f}_{mathrm{dec}}left(,{f}_{mathrm{enc}}left({h}_{{{i}}}right)right)-{h}_{i}right)}^{2}+|,{f}_{mathrm{dec}}(,{f}_{mathrm{enc}}left({h}_{i}right))-{h}_{i}|)$$
and a generalized cross-entropy loss, which is widely utilized for training neural networks with noisy labels38
$${L}_{mathrm{GCE}}^{q}=mathop{sum }limits_{i=1}^{n}mathop{sum }limits_{j=1}^{C_{y}}{I}left{y_{i}=jright}frac{1-f_{{rm{cls}}}^{,,j}left(f_{{mathrm{enc}}}left(h_{i}right)right)^{q}}{q}.$$
Here, ({f}_{mathrm{cls}}^{,,j}) represents the predicted probability for cell type (j) and (q) is a parameter controlling the generalized cross-entropy loss ({L}_{mathrm{GCE}}^{q}) and was fixed at 0.6 in all experiments. The total loss function is given by
$${L}_{mathrm{total}}={L}_{mathrm{recon}}+{L}_{{mathrm{GCE}}}^{q}.$$
This ensures that the model learns a meaningful representation of histological features while accurately predicting cell types. Once this prediction model is trained, we can predict the cell type labels of the whole slide using the histology image features (H=left(h_{m_{1}n_{1}}right)_{m_{1}=1,n_{1}=1}^{M/16,N/16}) as input. Cell community labels can be predicted using a similar approach.
Evaluation criteria for ROI selection quality
We assess the quality of ROI selection using the following metrics: ROI score, cell type broadcasting accuracy and cell community broadcasting accuracy. For tissue sections with manually selected ROIs informed by pathologist expertise, we introduce an additional metric that quantifies the overlap percentage between these ROIs and our selections. For tissue sections with paired CosMx data, which S2-omics leverages to enhance cell type spatial distribution, we assess the consistency between the predicted cell type distribution using all CosMx data and the prediction based solely on CosMx data within the selected ROI/FOV(s). All metrics range from 0 to 1, with higher values indicating better performance.
Handling of fragile tissue samples
Tissue handling and sectioning parameters, such as fixation protocol, tissue age, hydration state and sectioning thickness, are context specific and should be optimized in consultation with local histologists or other domain experts. For S2-omics analysis, the required H&E-stained WSI can serve as a reference for evaluating sample fragility and the risk of detachment or fragmentation during downstream processing. For high-risk specimens, users may generate multiple candidate ROIs and compare their associated ROI scores. The final ROI can then be selected in coordination with domain experts to balance tissue preservation with experimental objectives.
Statistics and reproducibility
For each analysis reported in the paper, the number of samples is equal to one as the goal of this study is to design an algorithm to select an optimal region for spatial omics experiments given a sample of interest. No data exclusions were conducted before analyses. No statistical test is involved in the paper and thus there is no need to have replications. No randomization was conducted in our study. As our study does not involve analysing treatment effect, there is no need for blinding. The version of S2-omics software used in this paper is v1.0.0.
Protocol
A step-by-step protocol for installing the software and an example application can be found on Nature Protocol Exchange39.
Reporting summary
Further information on research design is available in the Nature Portfolio Reporting Summary linked to this article.
Data availability
We analysed the following datasets: (1) 10x Genomics human kidney cancer and kidney non-diseased Xenium data (https://www.10xgenomics.com/datasets/human-kidney-preview-data-xenium-human-multi-tissue-and-cancer-panel-1-standard); (2) 10x Genomics human liver cancer and liver non-diseased Xenium data (https://www.10xgenomics.com/datasets/human-liver-data-xenium-human-multi-tissue-and-cancer-panel-1-standard); (3) 10x Genomics human breast cancer Xenium data, in situ sample 1 replicate 1, in situ sample 2 (https://www.10xgenomics.com/products/xenium-in-situ/preview-dataset-human-breast); (4) 10x Genomics human CRC and colon non-diseased Visium HD data, sample P1 CRC, sample P2 CRC, sample P3 NAT, sample P5 CRC, 10x Genomics humane CRC Xenium in Situ data, sample P1 CRC (https://www.10xgenomics.com/platforms/visium/product-family/dataset-human-crc); (5) human gastric cancer Xenium data generated by the Tae Hyun Hwang lab and available via Zenodo at https://zenodo.org/records/15164980 (ref. 40); (6) human gastric cancer H&E image generated by the Tae Hyun Hwang lab and available via Zenodo at https://zenodo.org/records/17227625 (ref. 41); (7) human kidney CosMx data generated by the Katalin Susztak lab and available via Zenodo at https://zenodo.org/records/17228449 (ref. 42); (8) human breast cancer data generated by Anderson et al.35 and available via Zenodo at https://zenodo.org/records/3957257, G1, G2 and G3 (ref. 43); (9) H&E image of breast cancer biopsies generated by the Anupma Nayak lab and available via Zenodo at https://zenodo.org/records/17228305 (ref. 44); and (10) H&E image of gastric cancer sample with signet-ring cells generated by the Linghua Wang lab and available via Zenodo at https://zenodo.org/records/17227906 (ref. 45). Details of the datasets analysed in this paper are described in Supplementary Table 1. Source data are provided with this paper. All other data supporting the findings of this study are available from the corresponding author on reasonable request.
Code availability
The S2-omics algorithm was implemented in Python and is available via GitHub at https://github.com/ddb-qiwang/S2Omics.
References
-
Bressan, D., Battistoni, G. & Hannon, G. J. The dawn of spatial omics. Science 381, eabq4964 (2023).
-
Chen, T.-Y., You, L., Hardillo, J. A. U. & Chien, M.-P. Spatial transcriptomic technologies. Cells 12, 2042 (2023).
-
Oliveira, M. F. D. et al. High-definition spatial transcriptomic profiling of immune cell populations in colorectal cancer. Nat. Genet. 57, 1512–1523 (2025).
-
Lubeck, E., Coskun, A. F., Zhiyentayev, T., Ahmad, M. & Cai, L. Single-cell in situ RNA profiling by sequential hybridization. Nat. Methods 11, 360–361 (2014).
-
Wang, X. et al. Three-dimensional intact-tissue sequencing of single-cell transcriptional states. Science 361, eaat5691 (2018).
-
Eng, C.-H. L. et al. Transcriptome-scale super-resolved imaging in tissues by RNA seqFISH+. Nature 568, 235–239 (2019).
-
Rodriques, S. G. et al. Slide-seq: a scalable technology for measuring genome-wide expression at high spatial resolution. Science 363, 1463–1467 (2019).
-
Zollinger, D. R., Lingle, S. E., Sorg, K., Beechem, J. M. & Merritt, C. R. GeoMx RNA assay: high multiplex, digital, spatial analysis of RNA in FFPE tissue. Methods Mol Biol. 2148, 331–345 (2020).
-
Xia, K. et al. The single-cell stereo-seq reveals region-specific cell subtypes and transcriptome profiling in Arabidopsis leaves. Dev. Cell 57, 1299–1310. e1294 (2022).
-
Angelo, M. et al. Multiplexed ion beam imaging of human breast tumors. Nat. Med. 20, 436–442 (2014).
-
Gessel, M. M., Norris, J. L. & Caprioli, R. M. MALDI imaging mass spectrometry: spatial molecular analysis to enable a new age of discovery. J. Proteom. 107, 71–82 (2014).
-
Goltsev, Y. et al. Deep profiling of mouse splenic architecture with CODEX multiplexed imaging. Cell 174, 968–981.e15 (2018).
-
Lin, J.-R. et al. Highly multiplexed immunofluorescence imaging of human tissues and tumors using t-CyCIF and conventional optical microscopes. elife 7, e31657 (2018).
-
Liu, Y. et al. High-spatial-resolution multi-omics sequencing via deterministic barcoding in tissue. Cell 183, 1665–1681. e1618 (2020).
-
Jones, A., Cai, D., Li, D. & Engelhardt, B. E. Optimizing the design of spatial genomic studies. Nat. Commun. 15, 4987 (2024).
-
Li, Z., Wu, W., Cui, Y., Jian, S. & Yuan, Z. SOFisher: reinforcement learning-guided experiment designs for spatial omics. Preprint at bioRxiv 2024.2007. 2005.602236 (2024).
-
He, B. et al. Integrating spatial gene expression and breast tumour morphology via deep learning. Nat. Biomed. Eng. 4, 827–834 (2020).
-
Bergenstråhle, L. et al. Super-resolved spatial transcriptomics by deep data fusion. Nat. Biotechnol. 40, 476–479 (2022).
-
Hu, J. et al. Deciphering tumor ecosystems at super resolution from spatial transcriptomics with TESLA. Cell Syst. 14, 404–417 e404 (2023).
-
Zhang, D. et al. Inferring super-resolution tissue architecture by integrating spatial transcriptomics with histology. Nat. Biotechnol. 42, 1372–1377 (2024).
-
Schroeder, A. et al. Scaling up spatial transcriptomics for large-sized tissues: uncovering cellular-level tissue architecture beyond conventional platforms with iSCALE. Nat. Methods 22, 1911–1922 (2025).
-
Coleman, K., Schroeder, A. & Li, M. Unlocking the power of spatial omics with AI. Nat. Methods https://doi.org/10.1038/s41592-024-02363-x (2024).
-
Hu, J. et al. Statistical and machine learning methods for spatially resolved transcriptomics with histology. Comput. Struct. Biotechnol. J. https://doi.org/10.1016/j.csbj.2021.06.052 (2021).
-
Chen, R. J. et al. Towards a general-purpose foundation model for computational pathology. Nat. Med. https://doi.org/10.1038/s41591-024-02857-3 (2024).
-
Chen, R. J. et al. Scaling vision transformers to gigapixel images via hierarchical self-supervised learning. In Proc. IEEE/CVF Conference on Computer Vision and Pattern Recognition 16123–16134 (IEEE, 2022).
-
Vorontsov, E. et al. A foundation model for clinical-grade computational pathology and rare cancers detection. Nat. Med. 30, 2924–2935 (2024).
-
Jaume, G. et al. Transcriptomics-guided slide representation learning in computational pathology. In Proc. IEEE/CVF Conference on Computer Vision and Pattern Recognition 9632–9644 (IEEE, 2024).
-
Lu, M. Y. et al. A visual-language foundation model for computational pathology. Nat. Med. 30, 863–874 (2024).
-
Xu, H. et al. A whole-slide foundation model for digital pathology from real-world data. Nature 630, 181–188 (2024).
-
Zimmermann, E. et al. Virchow2: scaling self-supervised mixed magnification models in pathology. Preprint at https://arxiv.org/abs/2408.00738 (2024).
-
Sautes-Fridman, C., Petitprez, F., Calderaro, J. & Fridman, W. H. Tertiary lymphoid structures in the era of cancer immunotherapy. Nat. Rev. Cancer https://doi.org/10.1038/s41568-019-0144-6 (2019).
-
He, S. et al. High-plex imaging of RNA and proteins at subcellular resolution in fixed tissue by spatial molecular imaging. Nat. Biotechnol. https://doi.org/10.1038/s41587-022-01483-z (2022).
-
Thomas, M. C. et al. Diabetic kidney disease. Nat. Rev. Dis. Prim. https://doi.org/10.1038/nrdp.2015.18 (2015).
-
Hu, S. et al. Crosstalk among podocytes, glomerular endothelial cells and mesangial cells in diabetic kidney disease: an updated review. Cell Commun. Signal. 22, 136 (2024).
-
Andersson, A. et al. Spatial deconvolution of HER2-positive breast cancer delineates tumor-associated cell type interactions. Nat. Commun. 12, 6012 (2021).
-
Schurch, C. M. et al. Coordinated cellular neighborhoods orchestrate antitumoral immunity at the colorectal cancer invasive front. Cell 182, 1341–1359 e1319 (2020).
-
Wu, Z. et al. Graph deep learning for the characterization of tumour microenvironments from spatial protein profiles in tissue specimens. Nat. Biomed. Eng. 6, 1435–1448 (2022).
-
Zhang, Z. & Sabuncu, M. Generalized cross entropy loss for training deep neural networks with noisy labels. In Proc. 31st International Conference on Neural Information Processing Systems 8778–8788 (Curran Associates, 2018).
-
Yuan, M. et al. Designing smart spatial omics experiments with S2-omics. Preprint at protocols.io https://doi.org/10.17504/protocols.io.bp2l6zpnkgqe/v2 (2025).
-
Hwang Lab. Gastric cancer Xenium sample – BS06-9313-8_Tumor. Zenodo https://doi.org/10.5281/zenodo.15164980 (2025).
-
Hwang Lab. Gastric cancer H&E only. Zenodo https://doi.org/10.5281/zenodo.17227625 (2025).
-
Susztak, K. Human kidney T2D and normal HE. Zenodo https://doi.org/10.5281/zenodo.17228449 (2025).
-
Andersson, A. Spatial deconvolution of HER2-positive breast tumors reveals novel intercellular relationships | Data. Zenodo https://doi.org/10.5281/zenodo.4751624 (2025).
-
Nayak, A. Human breast cancer. Zenodo https://doi.org/10.5281/zenodo.17228305 (2025).
-
Wang, L. Human gastric cancer HE only. Zenodo https://doi.org/10.5281/zenodo.17227906 (2025).
Acknowledgements
M.L. was partly supported by the following NIH grants R01HG013185, R01LM014592, U19NS135582, R01HL171595 and U01CA294518. T.H.H. was partly supported by NIH grants R01CA276690 and U01CA294518, DOD grant CA190578, the Eric and Wendy Schmidt Foundation’s AI Innovation Award through the Mayo Clinic Foundation and the Torrey Coast Foundation. L.W. was supported in part by the NIH National Cancer Institute grants U01CA294518, U01CA264583, R01CA266280 and U24CA274274, and Break Through Cancer. L.W. is a member of the James P. Allison Institute and the Institute for Data Science in Oncology at The University of Texas MD Anderson Cancer Center and receives research funding from both institutes.
Ethics declarations
Competing interests
M.L. receives research funding from Biogen unrelated to the current paper. M.L. is a co-founder of OmicPath AI. T.H.H. is a co-founder of Kure.ai therapeutics, and has received consulting fees from IQVIA; these affiliations and financial compensations are unrelated to the current paper. L.W. serves as a member of the Scientific Advisory Board for SELLAS Life Sciences and receives compensation outside the scope of this submitted work. The other authors declare no competing interests.
Peer review
Peer review information
Nature Cell Biology thanks Juexin Wang and the other, anonymous, reviewer(s) for their contribution to the peer review of this work. Peer reviewer reports are available.
Additional information
Publisher’s note Springer Nature remains neutral with regard to jurisdictional claims in published maps and institutional affiliations.
Extended data
Extended Data Fig. 1 Application to a gastric cancer tissue section.
a, True positive (TP) and false positive (TP) superpixels of S2-omics’s TLS prediction and cancer cell prediction using the cell type and cell community annotations within the selected ROI. b, Sankey diagrams between Xenium-based cell type/cell community annotation (left) and S2-omics’s prediction from the selected ROI (right). c, Quantitative evaluation of S2-omics’s ROI selection against 500 randomly sampled ROIs within the tissue section, covering the full range of all possible selection.
Extended Data Fig. 2 Example of a less favorable ROI in a gastric cancer tissue section.
a, Visualization of a less favorable ROI, the histology cluster and cell community compositions of the ROI. b, Cell type and cell community prediction from the ROI. For all superpixels that have Xenium-based cell type annotation, corresponding histology features and annotations were served as training data. Cell type labels of all superpixels that passed quality control were predicted using the trained model. c, Sankey diagrams between Xenium-based cell type/cell community annotation (left) and S2-omics’s prediction from the selected ROI (right).
Extended Data Fig. 3 Application to a colorectal cancer tissue section.
a, Visual comparison between ROIs separately selected by S2-omics (red box) and experienced pathologist (dashed red box) on a colorectal cancer tissue section (P2 CRC). b, Histology cluster compositions of the two ROIs and their pie chart visualizations. c, Visium HD-based cell type annotation and S2-omics’s cell type prediction on the whole tissue section. For all superpixels that have Visium HD-based cell type annotation, their histology features and annotations were served as training data. Cell type labels of all superpixels that passed quality control were predicted using the trained model. d, Distribution of cell types in histology clusters. Each square shows the percentage of cells in according cell type category and histology cluster occupied in all cells in that cell type category. e. the pathologist annotation and predicted cell type distribution of the ‘ulceration with inflammation’ region.
Extended Data Fig. 4 Application to a breast cancer tissue section.
a, H&E-stained image and histology segmentation obtained by S2-omics. 2 mm × 2 mm ROIs (red box) selected by S2-omics. b, Visual comparison between histology cluster and cell community compositions of WSI (outer ring) and S2-omics’s ROI (inner ring). c, Cell type enrichment in cell communities. d, Distribution of cell types in histology clusters. Each square shows the percentage of cells in according cell type category and histology cluster occupied in all cells in that cell type category. e, Visual comparison between the ground truth and S2-omics-predicted cell labels from the selected ROI. For all superpixels that have Xenium-based cell type and cell community annotation, according histology features and annotations were served as training data for cell type and cell community predictors. Cell type and cell community labels of all superpixels that passed quality control were predicted using the trained models. f, Sankey diagrams between Xenium-based cell type/cell community annotation (left) and S2-omics’s prediction from the selected ROI (right).
Extended Data Fig. 5 Application to a slide containing multiple breast cancer biopsies.
1 mm × 1 mm ROIs selected by S2-omics visualized on pathologist annotation and histology clusters identified by S2-omics. The histology cluster composition of selected ROIs is similar to, but more balanced than the histology cluster composition of the whole slide.
Extended Data Fig. 6 Application to a breast cancer section containing both CD4 + T and CD8 + T cells.
a, ROIs selected by S2-omics, visualized on the histology clusters identified from the H&E image using S2-omics. b, ROIs selected by S2-omics, visualized on the cell type annotation map of the tissue section derived from spatial transcriptomics (Xenium) data. c, histology clusters 4 and 7 are spatially highly correlated with T cells. d, ROIs selected by S2-omics, visualized on the spatial distribution and annotation CD4 + T and CD8 + T cells.
Extended Data Fig. 7 Impact of the number of final histology clusters on ROI selection in a gastric cancer section.
Left, H&E image with Euclidean distances between initial histology clusters and the merging thresholds. Right, ROIs selected by S2-omics, visualized on histology clusters obtained with different numbers of final clusters (after merging).
Extended Data Fig. 8 Comparative analysis of ROI selection and label broadcasting performance across S2-omics implementations using different foundation models for histological feature extraction.
a, Comparison between pathologist annotations and ROIs selected by S2-omics based on histological segmentations. Three different foundation models, including HIPT, Prov-GigaPath, and Virchow2, were employed for histological feature extraction. b, Cell type annotation maps derived from Xenium spatial transcriptomics data (ground truth) alongside cell type broadcasting results generated by different S2-omics implementations. For each S2-omics variant, the label broadcasting module was trained exclusively using cells within the ROI selected by that specific variant, along with their corresponding extracted histological features and cell type labels. Accuracy metrics were calculated using the Xenium-based cell type annotations as the reference standard.
Extended Data Fig. 9 Impact of clustering methods on ROI selection in a colorectal cancer section.
a, ROIs selected by S2-omics using histology segmentations obtained by different clustering algorithms, visualized on the histology clusters. b, Line charts showing S2-omics performance on ROI selection and histology segmentation across different clustering algorithms.
Extended Data Fig. 10 Composition of ROI score.
ROI score is the geometric average of balance score, coverage score and size score. All three sub-scores range from 0 to 1. The more similar the distribution of histology clusters inside the ROI is to uniform distribution, the larger the balance score. The less empty region a ROI includes, the larger its coverage score. The bigger the size of ROIs, the larger the size score.
Supplementary information
Rights and permissions
Open Access This article is licensed under a Creative Commons Attribution-NonCommercial-NoDerivatives 4.0 International License, which permits any non-commercial use, sharing, distribution and reproduction in any medium or format, as long as you give appropriate credit to the original author(s) and the source, provide a link to the Creative Commons licence, and indicate if you modified the licensed material. You do not have permission under this licence to share adapted material derived from this article or parts of it. The images or other third party material in this article are included in the article’s Creative Commons licence, unless indicated otherwise in a credit line to the material. If material is not included in the article’s Creative Commons licence and your intended use is not permitted by statutory regulation or exceeds the permitted use, you will need to obtain permission directly from the copyright holder. To view a copy of this licence, visit http://creativecommons.org/licenses/by-nc-nd/4.0/.
About this article

Cite this article
Yuan, M., Jin, K., Yan, H. et al. Smart spatial omics (S2-omics) optimizes region of interest selection to capture molecular heterogeneity in diverse tissues. Nat Cell Biol (2025). https://doi.org/10.1038/s41556-025-01811-w
-
Received:
-
Accepted:
-
Published:
-
Version of record:
-
DOI: https://doi.org/10.1038/s41556-025-01811-w