
Introduction
Oligonucleotides (ONs) are an important therapeutic modality within the medical toolbox for treating various diseases1,2,3. Currently, seventeen RNA-targeting ON therapeutics have been approved by the FDA3,4,5. Along with many successes2,3, several ONs had nevertheless stumbled due to unforeseen off-target toxicity during early phases of development6,7,8. The chemical moieties and molecular mechanisms responsible for some of these off-target effects have since been elucidated8,9,10,11,12,13,14,15 and have led to significant advancement in our strategy for evaluating safety pharmacology profile of potential ON drug candidates8,15,16,17. As more ONs with novel mechanisms, chemistries, and sequence designs are expected to enter the clinic, thorough assessment of the SAR underlying ON-related off-target effects is critical to ensure continued success of the field1,2,3,4,17,18,19.
The first-generation anti-miR-17, RGLS4326, is a 9 nucleotide (nt)-long chemically modified ON designed to target the miR-17 family of miRNAs for treatment of autosomal dominant polycystic kidney disease (ADPKD)20. In preclinical studies, RGLS4326 distributed preferentially to kidney and kidney cysts, inhibited miR-17, de-repressed miR-17 target genes Pkd1 and Pkd2, increased their encoded proteins Polycystin-1 (PC1) and Polycystin-2 (PC2), and attenuated kidney cyst growth in mouse models of ADPKD after repeat subcutaneous (SC) administration20,21,22. Repeat SC dosing of RGLS4326 was well tolerated in mice and monkeys in 7-week subchronic toxicity studies and supported the clinical development of RGLS432620. Following completion of a Phase 1 single-ascending-dose (SAD) clinical trial in healthy volunteers (HV) in which RGLS4326 was well tolerated, a Phase 1 multiple-ascending-dose (MAD) study in HV was initiated (https://www.prnewswire.com/news-releases/regulus-initiates-multiple-ascending-dose-study-in-healthy-volunteers-of-rgls4326-for-the-treatment-of-adpkd-300639435.html). Subsequently, chronic toxicity studies of RGLS4326 in mice and monkeys revealed CNS-related toxicity following chronic administration at high doses (https://www.prnewswire.com/news-releases/regulus-announces-strategic-update-and-corporate-restructuring-300676710.html). Although no CNS toxicity was ever observed in humans following repeat administration of RGLS4326 in either HV or ADPKD patients and despite having demonstrated an increase in the pharmacodynamic marker urinary PC1 and PC2 in ADPKD patients following RGLS4326 treatment in a Phase 1b study (https://www.prnewswire.com/news-releases/regulus-therapeutics-completes-dosing-in-phase-1-multiple-ascending-dose-study-of-rgls4326-in-healthy-volunteers-for-the-treatment-of-autosomal-dominant-polycystic-kidney-disease-adpkd-301097728.html)23, development of RGLS4326 was discontinued as it was desirable to eliminate this dose-limiting toxicity for the treatment of ADPKD.
Here, we investigate the SAR on the CNS toxicity, with the goal of designing the next-generation anti-miR-17 ON. We describe the discovery of a surprising aptamer-like direct interaction between RGLS4326 and the α-amino-3-hydroxy-5-methyl-4-isoxazolepropionic acid (AMPA) receptor24 (AMPAR) as the likely culprit of the CNS toxicity. The nucleobase guanine at 3’-terminus of RGLS4326 was determined to be critical for this ON-to-protein off-target interaction. We provide structural evidence that RGLS4326 binds directly to the ligand-binding domain (LBD) of AMPAR, ultimately inhibiting its function. By replacing the guanine with adenine and thereby eliminating the off-target AMPAR interaction, we discovered the next-generation anti-miR-17 RGLS8429 that is devoid of the CNS toxicity while retaining all favorable attributes of the first-generation anti-miR-17.
Results
CNS toxicity after RGLS4326 treatment in nonclinical toxicity studies
During development of RGLS4326, unexpected CNS toxicity (characterized by abnormal gait, lateral recumbency, ataxia, and lethargy) and mortality (including unscheduled euthanasia due to moribundity) were observed in a chronic toxicity study in mice (Supplementary Table 1). These observations occurred starting on Day 29 following weekly (QW) SC administration of RGLS4326 at 100 and 450 mg/kg. Given the unexpected nature of these observations compared to previous 7-week toxicity studies and the discovery of potential technical issues at the contract research laboratory, the study was terminated early at Week 14 to collect samples for further investigation. A new 27-week chronic study in mice was then initiated. In this study as well as the concurrent 39-week chronic toxicity study in monkeys, SC administration of RGLS4326 was well tolerated in mice at up to 300 mg/kg once every two weeks (Q2W) and in monkeys at up to 150 mg/kg QW until Day 83, at which point CNS toxicity started to emerge. The CNS toxicity in both species appeared to be acute, starting at 4–8 h after administration and often subsiding after 24 h.
In an investigative study in which mice received 3 daily (QD) SC doses of RGLS4326, CNS toxicities were evident shortly after dosing (Supplementary Table 1). Three of 40 mice died within 2 to 7 h after the first 2000 mg/kg dose. Most surviving animals developed body scratching between 1 and 4 h after each dose, often followed by disorientation, ataxia, lethargy, and unconsciousness between 4 and 8 h, with almost full recovery by 24 h. Clinical symptoms at 450 mg/kg were much milder and of shorter duration, with most animals developing mild body scratching and slight disorientation between 1 and 4 h after each dose, followed by almost full recovery by 8 h. No significant disorientation or other movement abnormalities were observed at 100 mg/kg.
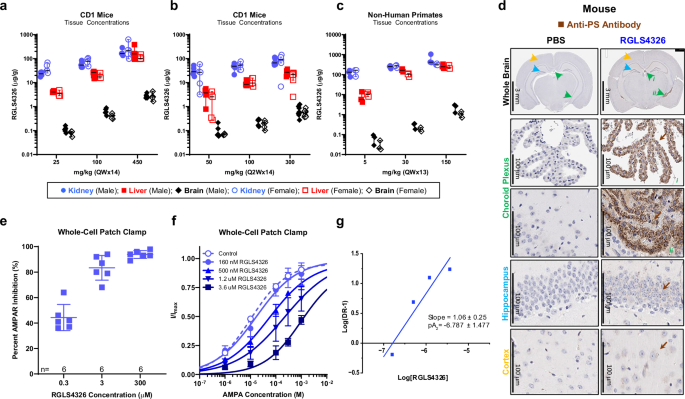
Despite the conventional notion that ONs do not cross blood-brain barriers (BBB) readily after systemic administration25,26,27,28, RGLS4326 was detected in the brain (both cerebral cortex and cerebellum) following repeated SC injections in mice and monkeys (Fig. 1a–c). Furthermore, immunohistochemistry assessment showed RGLS4326 was detected in the choroid plexus (CP) region, with faint to low staining in hippocampus and cortex after two QD SC injections at 2000 mg/kg in mice (Fig. 1d). The CNS exposure was unexpected and possibly due to the unconventional short length (9 nt) of RGLS4326.

a–c Kidney (blue circles), liver (red squares), and brain (black diamonds) concentrations of RGLS4326 in the chronic toxicity studies in male (closed symbols) and female (open symbols) mice and monkeys. CD-1 mice received 14 SC doses of RGLS4326 at a 25, 100, or 450 mg/kg QW (n = 5), or b 50 (n = 5), 100 (n = 5), or 300 mg/kg Q2W (n = 8 and 9 for male and female, respectively) c Monkeys received 13 SC doses of RGLS4326 at 5, 30, or 150 mg/kg QW (n = 3). Median ± 95% confidence interval. Tissues were harvested 48 h after the last dose. d Brain samples were harvested from C57BL6 mice 24 h after 2 SC doses of RGLS4326 at 2000 mg/kg QD (n = 3 mice). Representative immunohistochemistry images showing the presence of RGLS4326 labeled by anti-PS antibody (brown arrows) in the indicated brain regions, including the choroid plexus (green arrows), hippocampus (light blue arrows), and cortex (orange arrows). e–g Inhibition of AMPAR activity was measured in whole-cell patch-clamp studies using HEK293 cells expressing human GluA1 and GluA4 subunits. e Cells were treated with 10 μM of (S)-AMPA alone or in the presence of RGLS4326 at indicated concentrations (n = 6 biological replicates). Representative current traces are shown in Fig. S2a. f, g Cells were treated with indicated concentrations of (S)-AMPA and RGLS4326. f Fractional changes in current amplitude (I/Imax) in the presence of control (open circles) or RGLS4326 at 160 nM (closed circles), 500 nM (closed triangles), 1.2 μM (closed inverse triangles), and 3.6 μM (closed squares) relative to 1 mM (S)-AMPA alone are shown (n = 3 biological replicates, except for 3.6 μΜ where n = 4). Representative current traces are shown in Figure S2b-f. e, f Error bars indicate SD. g Schild plot analysis showing regression slope of ~1, indicating that RGLS4326 is a competitive antagonist of AMPAR. Parameters of fitting are shown, the errors are S.E. The potency of RGLS4326 that corresponds to pA2 = -6.787, Kb = 163 nM. Source data are provided as a Source Data File.
Overall, the occurrence and time course of RGLS4326-related CNS toxicity correlated with dose level, dosing frequency, duration, and both plasma and brain concentration profile; and were associated with brain exposure of RGLS4326 at ~1 μg/g (~0.3 μM) following repeat administrations.
RGLS4326 inhibits AMPAR ligand binding and function
Knockout of miR-17 in the developing neocortex restricts proliferation and transition of neural stem cells29. However, miR-17 expression normally declines and remains low in the brain after embryonic stages30. Furthermore, given no neurotoxicity was observed for adult mice with inducible miR-17 deletion31, we postulated that the RGLS4326-related CNS toxicity was not due to on-target inhibition of miR-17. In addition, because RGLS4326 does not contain features designed to support RNase H activity, a hybridization-dependent off-target mechanism resulting in cleavage and degradation of unintended transcripts was considered unlikely. Although a steric blocking mediated mechanism cannot be ruled out, we focused our investigation on potential off-target secondary pharmacology. Accordingly, the SpectrumScreen® binding panel was used to screen for potential interactions with RGLS4326 (Supplementary Table 2 and Supplementary Fig. 1). Of the 174 molecular targets tested, RGLS4326 inhibited ligand binding to 37 targets by >75% at 100 μM or >25% at 10 μM (Supplementary Table 3), including 3 receptors (AMPA, CCR5, and OX1) for which the IC50 values were <10 μM. However, inhibition of ligand binding did not necessarily lead to modulation of receptor function. RGLS4326 had no functional effect on CCR5 or OX1 receptors when tested in cell-based calcium uptake assays (Supplementary Table 3) but was found to be a competitive antagonist of AMPA receptor (AMPAR) in whole-cell patch-clamp studies (Fig. 1e–g and Supplementary Fig. 2). Interestingly, ~50% of inhibition of AMPAR activity was observed at 0.3 μM, coinciding with the brain exposure of RGLS4326 associated with CNS toxicity in the previous chronic toxicity studies.
AMPARs are ionotropic glutamate receptors composed of four subunits, GluA1 to GluA4. AMPAR subunits assemble homo- and heterotetrameric ion channels in glutamatergic synapses that mediate fast excitatory neurotransmission in the CNS24. The amino acid sequence of AMPAR is highly conserved across species. Perampanel, an FDA-approved potent non-competitive antagonist of AMPAR32 indicated for the treatment of epileptic seizures, also caused CNS toxicity (similar to that observed with RGLS4326) in mice, rats, dogs, and monkeys when administered at high doses33. Thus, off-target inhibition of AMPAR was hypothesized as the plausible mechanism of RGLS4326-related CNS toxicity.
3’-terminus guanine of RGLS4326 drives off-target AMPAR inhibition
RGLS4326 is a 9 nt-long full phosphorothioate (PS) backbone-modified ON composed of (S)-constrained ethyl, 2’-O-methyl, and 2’-deoxy-2’-fluoro nucleoside sugar modifications with sequence complementary to g1-g9 positions of the mature miR-1720,34,35 (Supplementary Fig. 3). To identify the next-generation anti-miR-17 ON with markedly reduced AMPAR inhibition while retaining all favorable attributes of RGLS4326, a small library of ~30 anti-miR-17 full PS-backboned ONs with different 2’-sugar modifications, sequences, and lengths compared to RGLS4326 were screened using a [3H]-radiolabeled AMPA ligand-binding assay (Supplementary Table 4). As shown in Fig. 2a, the presence of guanine at the 3’-terminus (3’G) plays a major role in inhibiting AMPA binding, where substitution with other nucleobases greatly altered the inhibition. In particular, substitution with inosine (which, like guanine, also contains a hydrogen bond acceptor (HBA) at the 6th position) had no impact on AMPA binding, whereas substitution with purines lacking the 6th position HBA showed notable reduction (Fig. 2b, c and Supplementary Table 4). Moreover, replacing (S)-constrained-ethyl of the 3’-terminal nucleoside with other 2’-sugar modifications did not notably reduce AMPA binding, implicating the 3’G of RGLS4326 as the moiety driving the off-target effect.

a, b Rat cerebral cortex synaptic membranes were incubated with 1 mM [3H]-AMPA and 1 mM L-glutamic acid in the presence of different anti-miR-17 ONs at indicated concentrations. Nucleobase sequence and chemical modifications of ONs tested are shown in Supplementary Table 4. Percent inhibition of [3H]-AMPA binding by a ONs with guanine at 3’-terminus (G; red squares) compared to non-guanine nucleobases (non-G; gray circles) and b ONs with hydrogen bond acceptor at 6th position (G or I; squares) compared to the nucleobases without (N, D, F, or A; circles) are shown. Selected ONs including RGLS4326 (blue), RGLS8429 (green), RG8430 (black) and RG8431 (dark gray) are highlighted for illustration purposes. 2’-sugar modifications of the 3’-terminal nucleosides are indicated (subscripts: S, M, E, D, or L). Non-linear fits of AMPAR inhibition are shown for illustration purposes only. c Chemical structures and numbering of purine positions. Hydrogen bond acceptors (magenta) and donors (blue) are highlighted. Source data are provided as a Source Data File.
Discovery of the next-generation anti-miR-17 RGLS8429
Complementarity between position g1 of miRNAs and t1 of target mRNAs is not required for their interactions34,35,36 (Fig. 3a). Likewise, substitution of 3’G at t1 of anti-miR-17s has no significant impact on their potency against miR-17 (Supplementary Fig. 4). Given the goal of maintaining all favorable attributes of RGLS4326, additional studies focused on three ONs: RGLS8429, RG8430, and RG8431, which contain the same chemical modifications and nucleobase sequence as RGLS4326, except for a single nucleobase substitution of 3’G at t1 with A, C, and U, respectively (Fig. 3b).

a Schematic illustration of miRNA (gray) binding to 3’untranslated region (3’UTR) of its target mRNA (black), highlighting that complementarity between position g1 of miRNA and t1 of target mRNA is not required for their interactions. Base-pairing between seed region of miRNA (g2-g7; black) and miRNA-binding motif of target mRNA (including 7mer-m8 site and non-conserved binding region) are also highlighted for illustration purposes. b Chemical modifications, base sequence, and the corresponding complementary binding regions of anti-miR-17 ONs to the miR-17 family of miRNAs are illustrated. Guanine at 3’terminus (red) compared to non-guanine nucleobases (gray). c-e De-repression of luciferase reporters containing c miR-17 binding motifs full-length 3’UTR of d PKD1 or e PKD2 genes in HeLa cells after treatment with RGLS4326 (blue squares), RGLS8429 (green circles), RG8430 (black triangles), and RG8431 (black inverse triangles), and control ON (gray circles). Non-linear fits of luciferase de-repression and their corresponding mean EC50 values (derived from n = 2 biological replicates) are shown. No curve constraint was applied. f Percent inhibition of AMPAR activity in GluA1/A4-expressing HEK293 cells after anti-miR-17 ON treatment at 0.3 and 3 μM are shown (n = 3 biological replicates). Error bars indicate SD. g CD-1 mice received 3 or 4 daily SC doses of anti-miR-17 ON at 100, 450, or 2000 mg/kg. CNS toxicity was observed with RGLS4326 (starting at 450 mg/kg), but not with RGLS8429, RG8430, or RG8431 (n = 10). h CD-1 mice received repeat SC doses of RGLS4326 (blue) or RGLS8429 (green) at indicated dose levels, frequency (QD, triangles; QW, squares; Q2W circles), and duration (n = 8–40 mice as indicated). Total dose levels for RGLS4326 associated with the occurrence of CNS toxicity following QD (#), QW (##), and Q2W (###) dosing are indicated. No CNS toxicity was observed for RGLS8429. Statistical Analysis: One-way ANOVA with Dunnett correction compared to RGLS4326. Source data are provided as a Source Data File.
As shown in Fig. 3c–e, all three ONs inhibited miR-17 with similar potency as RGLS4326. Interestingly, despite resembling AGO2’s preference for A at position t1 of target mRNA37, RGLS8429 (which also contains A at position t1) does not have higher potency against miR-17 compared to RG8430 and RG8431, indicating sequence complementary at t1 is not required for anti-miRNA activity. Importantly, all three ONs showed significantly reduced AMPAR inhibition compared to RGLS4326 (Fig. 3f). Furthermore, unlike RGLS4326 (Supplementary Table 1), all three ONs were well tolerated in mice following 4 daily SC doses up to 2000 mg/kg (Fig. 3g), with generally similar brain concentration achieved for all three ONs compared to RGLS4326 (Supplementary Table 5). When assessed against the previous secondary pharmacology panel (Supplementary Table 2), RGLS8429 inhibited fewer off-targets with ≥25% at 10 μM (anticipated IC50 values > 10 μM for all; Supplementary Table 6) than either RG8430 or RG8431 and was chosen for further evaluation in nonclinical toxicity studies (Supplementary Table 7). As shown in Fig. 3h, no CNS toxicity was observed with RGLS8429 in mice even at dose levels and durations exceeding those at which RGLS4326-related CNS toxicity occurred. Importantly, no CNS toxicity was observed with RGLS8429 up to 150 mg/kg in the 39 weeks chronic toxicity study in monkeys.
RGLS8429 retains all favorable attributes of RGLS4326
Similar to RGLS432620, RGLS8429 also inhibited all miR-17 family of miRNAs and not other unrelated miRNAs such as miR-33 (Supplementary Fig. 5). The pharmacology profiles of RGLS8429 were examined further in direct comparison with RGLS4326 (Supplementary Fig. 6). Both ONs de-repressed multiple miR-17 target genes including PKD1/2, increased PC1/2, and reduced cyst growth among different in vitro models, with similar potency (Fig. 4a–d). Furthermore, both ONs showed similar pharmacokinetic (PK) profiles characterized by rapid absorption followed by rapid clearance with preferential distribution to kidney compared with liver after single SC injection. No meaningful difference in the plasma, kidney, or liver PK parameters for RGLS4326 and RGLS8429 was observed (Fig. 4e and Supplementary Table 8). For both ONs, kidney exposures exceeded liver by >20-fold as assessed by AUClast. Both ONs showed stronger target engagement in kidney (≥75% for 14 days) than in liver (≤75% by 7 days; Fig. 4f–g) and exhibited similar potency in the kidney (Fig. 4h). Importantly, both ONs showed a similar efficacy profile in the Pkd1F/RC ADPKD mouse model after repeat SC dosing (Fig. 4i, j).

a–d Potency profiles. a De-repression of multiple miR-17 target genes (as measured by miR-17 PD-Sig20; n = 3 biological replicates) including b de-repression of Pkd1, Pkd2 and PC1/2 in mouse Pkd1RC/- ADPKD cells after transfection with PBS (black circle), RGLS4326 (blue square), RGLS8429 (green circle), or control ON (gray circle) at 300 nM (n = 4 biological replicates). c Increase of PC1/2 proteins in primary human ADPKD cyst cells (genotype PKD1+/Q2641) after transfection with control ON, RGLS4326, or RGLS8429 at 120 nM compared to PBS (black circle); n = 3. Protein size markers (kDa) are indicated. #, Non-specific band. For PC2, both dimer and monomer forms are shown. d Quantification of 3D cyst size of cells cultured in Matrigel after transfection with 120 nM of indicated ONs is shown (n = 201, 202, 102, and 101 as shown). e Plasma and tissue concentration-time profiles (n = 6). f–h Tissue target engagement profiles. C57BL6 mice received a single SC dose of RGLS8429 (green) or RGLS4326 (blue) at 30 mg/kg. e Kidney (circle), liver (square), and plasma (triangle) concentration-time profiles of RGLS8429 and RGLS4326 are shown (n = 6). Median ± 95% confidence interval. Target engagement (displacement of miR-1720) in f kidney and g liver tissues were measured and calculated percent inhibition (CPI) of miR-17-versus-time profiles is shown (n = 6). h C57BL6 mice received a single SC dose of PBS (n = 12–27) or RGLS8429 or RGLS4326 at 0.003, 0.03, 0.1, 0.3, 1, 3, 10, 30, and 300 mg/kg (n = 5–19). Nonlinear fits of CPI and estimated kidney concentration corresponding to 75% inhibition of miR-17 (EC75 values) are shown. Dotted lines indicate 95% CI. Curves were constrained between 0 to 100%. i, j Efficacy profiles. Kidney and blood samples were harvested from Pkd1F/RC mice on postnatal day (P)18 after SC administration of PBS (black circle) or RGLS8429 (green circle), RGLS4326 (blue square), or control ON (gray circle) at 20 mg/kg on P8, 10, 12, and 15 (n = 8); i Representative H&E kidney sections and j KW/BW, cyst index, proliferation index, and BUN levels are shown. Error bars indicate SD unless otherwise specified. Statistical analysis: One-way ANOVA with Dunnett correction compared to PBS. Source data are provided as a Source Data File.
CNS toxicity was not caused by on-target miR-17 inhibition
As shown in Supplementary Fig. 7, RGLS4326 was associated with severe CNS toxicity, resulting in death 24 h after a single unilateral intracerebroventricular (ICV) injection at 5 μg and above in adult C57BL6 mice. In contrast, RG8431 (which inhibits miR-17 but not AMPAR) was well tolerated at 50, 100, and 600 μg, with one death observed (likely incidental; often associated with mock ICV injections) at 300 μg. The difference in effects further supports that AMPAR inhibition, and not miR-17 inhibition, was indeed the culprit of RGLS4326-related CNS toxicity.
Cryo-EM structure of RGLS4326-bound AMPAR complex
To investigate the structural basis of AMPAR inhibition driven by 3’G of RGLS4326, we took advantage of a construct with the modified GluA2 subunit genetically fused to the auxiliary subunit transmembrane AMPAR regulatory protein (TARP) γ2 used previously for solving AMPAR structures (see Methods)37,38. First, RGLS4326 was confirmed to interact with and inhibit the function of GluA2-homotetrameric AMPAR (Fig. S8). Next, purified GluA2-γ2 was combined with RGLS4326 and subjected to cryogenic electron microscopy (cryo-EM) (Fig. S9–S12 and Supplementary Table 9).
Consistent with the originally described GluA2 structure39, the core of GluA2-γ2RGLS4326 represented a tetrameric receptor with the characteristic three-layer Y-shaped architecture composed of amino-terminal domains (ATDs), ligand-binding domains (LBDs), and transmembrane domains (TMDs), with an overall 2-fold rotational symmetry that relates the A/C and B/D pairs of diagonal subunits (Fig. 5a, b and Supplementary Fig. 11). Strikingly, pronounced densities with filamentous appearance resembling ONs sticking out from each of the LBD clamshells in the GluA2-γ2RGLS4326 structure were observed. These densities are stronger toward and inside each LBD and become weaker away from the protein (Supplementary Fig. 12a, b). Modeling of the filamentous densities with RGLS4326 showed unambiguously that the 3’-terminus of RGLS4326 is inserted into each LBD clamshell, with the 5-’terminus of RGLS4326 protruding outwards (Fig. 5a, b). For subunits B and D, RGLS4326 points away from the axis of the receptor’s overall 2-fold rotational symmetry. In contrast, the t6-t9 regions of RGLS4326 (their 5’-terminus portions) sticking out of subunits A and C are in close proximity and appear to interact with one another in the middle of the receptor, between the two (A/D and B/C) LBD dimers (Fig. 5c). The interaction is likely non-specific, as density at the region is weak, poorly resolved, and not based on Watson-Crick pairing.

a Three-dimensional (3D) molecular structure of GluA2-γ2RGLS4326 viewed parallel to the cell membrane (gray bars illustrate membrane boundaries), with GluA2 subunits A and C (yellow), B and D (pink), and γ2 (dark green) shown as ribbons, RGLS4326 (blue) shown as stick models, and cryo-EM density for RGLS4326 shown as blue mesh (contour level 4.0 in Pymol). b Structure of the GluA2-γ2RGLS4326 LBD layer viewed extracellularly from the level indicated by dashed line shown in (a). c LBDs of subunits A and C each bound to RGLS4326 viewed parallel to the membrane (top). Non-Watson-and-Crick interaction between two molecules of RGLS4326 viewed extracellularly, with the LBDs omitted for illustration purpose (bottom). d LBD of subunit B bound to RGLS4326 viewed parallel to the membrane, showing the 3’terminus of RGLS4326 binding inside the LBD clamshell and 5’terminus protruding outwards. The closeup view of the binding site (on the right), shows hydrogen bonds between RGLS4326 and residues of GluA2 (inset, black dotted lines). ATD, amino-terminal domain; LBD, ligand-binding domain; TMD, transmembrane domain. Individual RGLS4326 nucleobases (A, C, U, or G) and their corresponding anti-miR position (t1 to t9) are indicated.
Structural basis of AMPAR inhibition by RGLS4326
To better resolve the residues towards the 3’-terminus of RGLS4326 inside the LBDs, the ATD and micelle densities were subtracted from full-length GluA2-γ2RGLS4326 to generate an improved cryo-EM map of the LBD-TMD region (Supplementary Fig. 9 and Supplementary Table 9). As shown in Fig. 5d, the 3’G at t1 is located precisely where Glu binds within the LBD and interacts with the same residues, including P478, T480, R485, and Y732 (Fig. 5d, inset). In particular, the 6th position HBA of 3’G interacts directly with T480, whereas the pyrimidine-imidazole ring of 3’G lays below and parallel to the aromatic ring of Y450, suggesting π-stacking interactions between these residues. Furthermore, t2-U appears to interact with R453, T480, T482, G653, S654, E705, and K730, suggesting it might also play a role in AMPAR inhibition (Supplementary Fig. 13).
The LBD serves as a gating initiation domain for AMPAR. In the absence of ligands (apo state), LBD clamshell is typically open, and the ion channel is typically closed40. Binding of agonists such as Glu between the D1 and D2 lobes causes closure of the clamshell (Fig. 6a) and channel opening for ion conductance. In contrast, competitive antagonists such as ZK200775 or RGLS4326 act as wedges that stabilize the open clamshell conformation (Fig. 6b, c). Binding of RGLS4326 led to dramatic opening of LBD by ~31° compared to the closed clamshell confirmation (Fig. 6d). Interestingly, the GluA2-γ2RGLS4326 clamshell undergoes a further opening of ~5° compared to GluA2-γ2ZK, representing the greatest degree of clamshell opening observed among AMPAR structures to date (Fig. 6e).

a-c Ligand-binding domains (LBDs) from the a GluA2-γ2Glu+CTZ (orange; PBD ID: 5WEO), b GluA2ZK (dark gray; PDB ID: 3KG2), and c GluA2-γ2RGLS4326 (blue) structures. The extent of opening of the LBD clamshells is illustrated by sectors between the upper D1 and lower D2 lobes. d, e D1-based superpositions of LBDs from GluA2-γ2RGLS4326 and d GluA2-γ2Glu+CTZ or e GluA2ZK. Further openings of the LBD clamshells in the GluA2-γ2RGLS4326 structures (blue line) compared to GluA2-γ2Glu+CTZ (orange line) or GluA2ZK (dark gray line) are indicated. f LBD dimers from the open-state GluA2-γ2Glu+CTZ (orange) and closed-state GluA2ZK (dark gray) structures superimposed with LBD dimer from GluA2-γ2RGLS4326 (blue). Cα atoms of S635 and S741 are shown as spheres of the corresponding color, with the cross-dimer distances between S741 of the D1 lobes (top) and S635 of the D2 lobes (bottom) indicated. g Pore-forming domains M2 and M3 in GluA2-γ2RGLS4326, with residues lining the pore shown as sticks. For illustration purposes, only the A and C subunits are shown. The pore profile is shown as a space-filing model (light gray). h Pore radius for GluA2-γ2Glu+CTZ (orange), GluA2ZK (dark gray), and GluA2-γ2RGLS4326 (blue) calculated using HOLE. The vertical dashed line denotes the radius of a water molecule (1.4 Å). i Schematic illustration of RGLS4326 binding to AMPAR via the nucleobase guanine (G) at the 3’-terminus. RGLS4326 competes with the natural ligand (Glu) and binds directly to the LBD of AMPAR (left). This binding leads to opening of the LBD clamshells and closure of the ion channel pore, ultimately resulting in CNS toxicity. In contrast, RGLS8429 does not bind to AMPAR and is devoid of CNS toxicity (right).
Closing/opening of LBD clamshells during gating is converted to opening/closing of the ion channel due to back-to-back LBD dimer formation41. To investigate the effects of RGLS4326 on AMPAR gating, LBD dimers from GluA2-γ2RGLS4326 were compared to those from the GluA2-γ2ZK and GluA2-γ2Glu+CTZ structures (Fig. 6f). Although no substantial changes in D1-D1 interface were observed (19-21 Å), the D2-D2 distance in GluA2-γ2RGLS4326 (15 Å) was reduced compared to GluA2-γ2ZK (18 Å), and even more reduced compared to GluA2-γ2Glu+CTZ (31 Å). The smaller D2-D2 distance suggests that RGLS4326 promotes an LBD dimer conformation with the least strain applied to the LBD-TMD linkers, typically associated with the closed conformation of the ion channel. Indeed, the TMD of the GluA2-γ2RGLS4326 structure showed a clearly resolved central ion channel pore that is closed tightly at the gate region formed by the bundle crossing of the M3 helices (Fig. 6g). As shown in Fig. 6h, the gate region radius is similar between GluA2-γ2RGLS4326 and the closed ion channel structure (GluA2-γ2ZK) but is much smaller than in the open ion channel structure (GluA2-γ2Glu+CTZ).
The cryo-EM data confirmed that 3’G of RGLS4326 is driving the off-target AMPAR inhibition. As illustrated in Fig. 6i, the 3’G plays a major role in direct interaction between RGLS4326 and AMPAR, competes with Glu for binding to LBD, and promotes the opening of the LBD clamshells and closing of the ion channel, ultimately leading to AMPAR inhibition and CNS toxicity. In contrast, RGLS8429, in which 3’G is substituted with A, does not interact with AMPAR. Accordingly, RGLS8429 does not inhibit AMPAR activity, and is devoid of CNS toxicity.
Discussion
ON-related toxicity due to off-target protein binding has been recognized for decades1,10. For instance, complement activation and prolongation of activated partial thromboplastin times by PS ONs were shown to be caused by binding to Factor H and the tenase complex10,11,12,13, respectively, while reduction of off-target protein binding has been shown to mitigate cytotoxicity of toxic PS-containing ONs1,42. Interestingly, ONs containing higher numbers of G with closer proximity to the 3’-terminus have been shown to have higher potential for inducing acute neurotoxicity following ICV injections, whereas those with A have the least43. This G-related neurotoxicity was linked to AMPAR; however, the underlying mechanism remained unclear. Here, we pinpointed the 3’-terminal G of RGLS4326 as the linchpin for driving an aptamer-like direct ON-to-protein interaction with AMPAR.
AMPAR is a promising drug target for treating CNS-related diseases including Parkinson’s disease, epilepsy, and amyotrophic lateral sclerosis44. However, improvement upon existing small molecule AMPAR antagonists remains challenging. Serendipitously, our data showed that direct competitive antagonism of AMPAR by a short ON such as RGLS4326 is feasible. We showed that direct RGLS4326-AMPAR interaction was driven by the 6th position HBA of the 3’G of RGLS4326, whereas 2’-sugar modification at the 3’-terminus nucleoside had no significant impact. Hypothetically, other design elements of RGLS4326 that affect its overall tertiary structure (e.g., rigidity and chirality) might also contribute to the aptamer-like interaction. In addition, we showed that t2-U of RGLS4326 also interacts with AMPAR, while the t6-t9 regions appear to interact with one another. Furthermore, RGLS4326 was unexpectedly detected in the brain following repeat SC dosing where penetration of the BBB was likely facilitated by its unconventional short length. Although the exact mechanism responsible for the observed brain exposure (and putative spatial distribution among different brain regions and subcellular compartments) has not been elucidated, elements such as backbone chemistry, nucleobase sequence beyond 3’G, and length could be explored further for designing future AMPAR-targeting ON therapeutics. Furthermore, the impact of ON binding on endogenous AMPAR synthesis, dynamic trafficking and turnover as it relates to functional AMPAR inhibition and the onset of CNS-related effects, currently beyond the scope of this work, could also be elucidated45,46.
No alternative mechanism for the RGLS4326-related CNS toxicity is apparent. Both RGLS4326 and RGLS8429 have similarly low proinflammatory properties20. A complement-mediated mechanism is unlikely, as RGLS4326-related CNS effects were also evident in mice. A hybridization-dependent off-target mechanism was considered unlikely, especially given the transient nature of the CNS toxicity. Although a steric blocking-mediated mechanism cannot be definitively ruled out, once the aptamer-like mechanism was identified, no further investigation was conducted.
The CNS toxicity observed for RGLS4326 in nonclinical chronic toxicity studies was unexpected. Nevertheless, we deciphered the underlying molecular mechanism responsible for the CNS toxicity, starting with utilizing a comprehensive target binding panel to screen for off-target molecular hits, and eventually identifying AMPAR inhibition as the likely culprit. By replacing the 3’G of RGLS4326 (which directly interacts with AMPAR) with A, off-target CNS toxicity was eliminated while on-target potency was preserved. This has led to the discovery of the next-generation anti-miR-17 RGLS8429, now referred to as farabursen. In addition, the process used here demonstrates the value of a secondary pharmacology panel, common for small molecule drug discovery, as a tool for investigating unexpected off-target aptamer-like interactions for a specific ON, where further investigation is warranted. Nevertheless, the generalizability of these aptamer-like mechanisms to other more conventional ON designs has not been explored. Finally, these data supported the clinical development of farabursen for the treatment of ADPKD. Phase 1 SAD study in HV47 and Phase 1b MAD study in ADPKD patients have been completed48, and farabursen was well tolerated with no serious adverse events reported.
Method
Chemically modified oligonucleotides (ONs)
For RGLS4326 toxicity studies, ONs were synthesized at Nitto Denko Avecia (Milford, MA) or BioSpring Gmbh (Frankfort, Germany). For toxicity studies of RGLS8429 (also known as farabursen), ONs were synthesized at Changzhou SynTheAll Pharmaceutical Co (Jiangsu, China). For all other studies, ONs were synthesized at Regulus or Nitto Denko Avecia (Milford, MA), similar to previously described49. For indicated studies, full phosphorothioate (PS)-backboned anti-miR-33 ON, with nucleobase sequence 5’-ACAAUGCAC-3’ containing same pattern of 2’ modification as RGLS4326, was used as control ON. For specific miR-33b luciferase assay (Fig. S5b), a full PS-backboned anti-miR-33 ON, with nucleobase sequence 5’-TGCAACAGCAATGCA-3’ containing DNA, 2’-O-methoxyethyl, and (s)-constrained ethyl was used as positive control. The sequence and chemical modifications of all other ONs are shown in Supplementary Table 4.
Toxicology, pharmacokinetic, and pharmacodynamic studies
For toxicity studies, CD-1 mice and cynomolgus monkeys were selected as the rodent and non-rodent species for the safety evaluation of RGLS4326 and RGLS8429. The mature miRNAs of the miR-17 family in humans, mice, and monkeys are identical, and both mice and monkeys are pharmacologically responsive to RGLS4326 and RGLS8429. Animals were dosed subcutaneously with vehicle control, RGLS4326, or RGLS8429 at specified dose levels and frequencies. Criteria for evaluation included viability (morbidity/mortality), clinical observations, body weight, and clinical pathology (hematology and serum chemistry). With the exceptions for studies of <1 week duration, gross evaluation, organ weight, and histopathological evaluation were also performed. CNS effects were assessed through daily clinical observations in each study. For studies in monkeys, food consumption, ophthalmic examinations, coagulation, complement, and urinalysis were included. In certain indicated studies in mice, the Irwin functional observational battery (FOB) tests were conducted as indicated. Neurological examinations were also included at 2-4 h and 24 h after the 1st and last dose of the GLP chronic toxicity study in monkey. No observed adverse effect levels (NOAEL) were determined by the independent study directors from the contract research laboratories where the studies were conducted. Kidney, liver and brain samples were harvested at indicated time point for quantification of ON concentrations by high performance liquid chromatography (HPLC) with fluorescence detection (HPLC-FL), HPLC time-of-flight mass spectrometry (HPLC-TOF), or HPLC tandem mass spectrometry (HPLC-MS/MS). For pharmacokinetic and pharmacodynamic studies, C57BL6 mice were assigned randomly to receive a single SC injection of phosphate-buffered saline (PBS), RGLS4326, or RGLS8429 at a nominal dose of 30 mg/kg. Mice were sacrificed at 1, 4, 8, 24, 48, 168, 336, 672, or 1344 h post dose. Plasma, kidney, and liver samples were harvested for quantification of ON concentrations or target engagement by miRNA Polysome Shift Assay. For dose-response pharmacodynamic studies, C57BL6 mice were assigned randomly to receive a single SC injection of PBS, RGLS4326, or RGLS8429 at 0.003, 0.03, 03, 3, 30, or 300 mg/kg. Mice were sacrificed at 7 days post dose. Kidney samples were harvested for quantification of ON concentrations and target engagement.
Efficacy studies
For the efficacy study, Ksp/Cre; Pkd1F/RC mice were assigned randomly to receive vehicle PBS (n = 8) or 20 mg/kg of control ON (n = 8), RGLS8429 (n = 8), or RGLS4326 (n = 8) via SC injections. Mice were dosed on postnatal days (P)8, 10, P12 and P15 and sacrificed on P18. Aged-match WT mice (n = 14) were sacrificed on P18. The right kidney was weighed to obtain the kidney weight-to-body weight (KW/BW) ratio. The left kidney was perfused with PBS and then cold 4% (w/v) paraformaldehyde (PFA) prior to harvesting. Left kidney samples were further fixed in 4% PFA for 24 h at 4 °C, switched to 1X PBS, paraffin-embedded, cut, and stained with hematoxylin and eosin (H&E) and imaged for cyst index quantification. Cyst index was calculated using H&E-stained sagittal kidney sections. The index was calculated by the following formula: CI (%) = Cystic area/ total kidney section surface area ×100. Quantification was performed using the entire H&E section. ImageJ software (National Institutes of Health, Bethesda, MD) was used to measure total kidney section surface area and cystic area. A ratio of cystic area to total kidney section area was obtained and expressed as a percentage. For proliferation index, kidney sections were stained with anti-phosphohistone H3 antibodies (1:400, Sigma-Aldrich H0412) followed by quantifying the percentage of positively stained cyst epithelial cells in ten randomly selected high powered (20×) fields from each section. All immuno-histological quantifications were assessed in a blinded manner by researchers at the University of Texas Southwestern (UTSW). Blood urea nitrogen (BUN) was measured by Vitros250 Analyzer by the UT Southwestern Metabolic Phenotyping Core.
Mouse CNS tolerance studies and ICV injection
Studies evaluating CNS tolerance of ONs in mice were conducted at Melior Discovery (Exton, PA). In brief, C57BL/6 J male mice, aged 6-7 weeks, were purchased from Jackson Laboratories (Bar Harbor, ME), housed in a ventilated cage rack system, and supplied a diet of standard rodent chow and water ad libitum. Mice were assigned randomly to treatment groups and studies were blinded. For ICV administration, mice (n = 2–4) were anesthetized and positioned for injections. RGLS4326 was tested at 2.5, 5, 10, 25, 50, 100, 300, and 600 µg/injection. RG8431 was tested at 50, 100, 300, and 600 µg/injection. The skin over the skull was incised, and a small hole was made in the skull above the target using a microdrill. The stereotactic coordinates were anteroposterior (AP), −0.4 mm; mediolateral (ML), +/- 1.0–1.5 mm; dorsoventral (DV), −3.0 mm from the bregma for injection into both the right and left lateral cerebral ventricles50. Animals were dosed unilaterally with 4 μL into the right lateral cerebral ventricle. Compounds were injected over 1-2 min, and the needle was left in place for 0.5-1 min prior to withdrawal. The incision was closed with sutures, wound clips, or VetBond. Following ICV treatment, mice were monitored daily for 7 days, during which health checks, body weight, and mortality were recorded.
Quantification of RGLS4326 and RGLS8429 in plasma and tissues
Kidney, liver, and whole brain concentrations of RGLS4326 in chronic toxicity studies in mice were measured using HPLC-FL, and the lower limit of quantitation (LLOQ) was 0.1, 0.1, and 0.024 μg/g, respectively. Brain concentrations of RGLS4326 in chronic toxicity studies in monkeys were based on averages for cerebral cortex and cerebellum concentration (as their concentrations differed by less than two-fold for most animals) and measured using HPLC-FL (LLOQ = 0.012 μg/g), and liver and kidney concentrations of RGLS4326 were measured using HPLC-TOF, and the LLOQ was 0.4 μg/g. Kidney, liver, and/or plasma concentrations of RGLS4326 or RGLS8429 in the C57BL6 mouse PK/PD studies were measured using HPLC-MS/MS, and the LLOQ was 0.1, 0.01 μg/g and 0.005 μg/mL, respectively. For HPLC-FL, non-perfused tissue was homogenized and subjected to proteinase digestion followed by precipitation and hybridization of the supernatant to fluorescent probe complementary to RGLS4326, prior to injection into a fluorescence detector-equipped HPLC. The fluorescent probe was purchased from PNA Bio (Thousand Oaks, CA) and the sequence was CAAAGTGCT (5’ to 3’). For HPLC-TOF or HPLC-MS/MS, RGLS4326 or RGLS8429 was isolated from plasma or non-perfused tissue by liquid-liquid extraction followed by solid-phase extraction, prior to injection into a mass spectrometer-detector equipped HPLC. Calibration curve samples were prepared by spiking blank plasma or tissue homogenates with known concentrations of RGLS4326 or RGLS8429 and co-extracting calibration samples alongside samples.
Detection of RGLS4326 by immunohistochemistry
Formalin-fixed paraffin-embedded (FFPE) brain samples were sectioned at 4 μm, deparaffinized, and stained on a Leica RX or RXm staining instrument. The samples were treated with antigen retrieval using an EDTA-based pH 9.0 solution for 25 min at 94°C and blocked with 1% Casein for 10 min. Slides were incubated with anti-ON antibody at 1:25,000 dilution (Ab29858; Regulus Therapeutics) for 30 min followed by incubation with MACH 2 Rabbit HRP-Polymer (BioCare Medical, RHRP520L) for 30 min at room temperature (RT). DAB substrate kit (Signal Stain DAB Substrate Kit, Cell Signaling, 8059) was used for detection and samples were incubated for 5 min at RT. Hematoxylin was used for nuclear counterstain. Images were acquired by AmScope 40X Binocular Biological Compound Microscope.
miRNA polysome shift assay
The ability of anti-miR-17 ONs to engage, inhibit, and displace miR-17 from the translationally active high molecular weight (HMW) polysome in the kidney or liver following SC administration in mice was evaluated using the miRNA polysome shift assay as described previously20. Briefly, collected kidney and liver samples were homogenized, layered on top of a 5-60% sucrose gradient, and ultracentrifuged for 1.5 h at 274,400 g in an XL-90 ultracentrifuge using a SW41 rotor (Beckman Coulter, Carlsbad, CA). Relative levels of miR-17 in the HMW polysome-containing fractions were quantified using the miRNA TaqMan assays (ThermoFisher Scientific, hsa-miR17-5p: 002308 and hsa-Let-7d-5p: 002283). Displacement (D) of miR-17 normalized to let-7d following anti-miR-17 treatment was calculated using the DDCT method and reported on a log2 scale such that positive values reflect loss of miR-17 from the HMW polysomes. Calculated percent inhibition (CPI) was assessed based on the formula: CPI = (1-1/(2^D))*100. EC75 values were estimated using GraphPad Prism version 10.2.2 and curves were constrained between 0 to 100%.
Radiolabeled ligand binding and functional assays
Potential off-target interactions of RGLS4326, RGLS8429, RG8430, and RG8431 against a panel of 174 molecular targets, including various GPCR and nuclear receptors, ion channels, transporters, and enzymes, were evaluated using the corresponding panel of radioligand binding assays accordingly to the vendor’s protocol (SpectrumScreen® Panel; Eurofins Panlabs Discovery Services). Potential functional interactions of RGLS4326 with CCR5 and OX1 receptors were evaluated in the corresponding cell-based calcium-flux assay according to the vendor’s protocol (Assay ID G323 and G092; Eurofins Cerep). Potential off-target interactions of anti-miR-17 ONs with AMPA receptors were evaluated in a [3H]-radiolabeled AMPA ligand binding assay accordingly to the vendor’s protocol (Assay 232600; Eurofins PanLab). Briefly, inhibition of ligand binding (5.0 nM [3H]-AMPA) to Wistar rat cerebral cortex extract was determined following incubation with various concentrations of ONs at 4 °C for 90 min.
Manual whole-cell patch-clamp studies and Schild analysis
Studies were performed at Metrion Biosciences. HEK293 cells transiently transfected with the unedited splice variants of human GRIA1 and GRIA4 genes (which encode for the GluA1 and GluA4 subunits, respectively) were used (GluA1/GluA4 EZ cells from Charles River Laboratories). Cells were defrosted, plated on glass coverslips, and cultured in DMEM/F12 containing 10% fetal bovine serum (FBS) at either 37 °C or 30 °C for 24 to 48 h before studies were initiated. Whole-cell voltage-clamp experiments were performed at RT using an EPC10 patch clamp amplifier and Patchmaster software (HEKA Elektronik). Glass patch pipettes were fabricated from borosilicate glass capillaries (Harvard Apparatus) and had resistances between 1.4 and 2.5 MΩ. Voltage command errors were minimized by using the 80% series resistance (Rs) compensation. Membrane currents were recorded using the whole-cell patch-clamp technique, and data were acquired with a sample rate of 10 kHz.
For investigating ON-mediated inhibition (Fig. 1a and S2a), solution exchange during agonist application was performed using a VC3-8 fast perfusion system (ALA Scientific Instruments, USA). The system is capable of achieving rapid on rate of exchange with a time constant of 15-20 ms, as demonstrated by the sharp rising phase of currents at high agonist concentrations where solution exchange, rather than receptor kinetics, was rate-limiting. In practice, the off rate of exchange was much slower (typically on the order of several seconds) and varied across individual recordings. This property explains the slow variable wash-off kinetics observed in Fig. S2. Agonist application periods are indicated in the figure by the striped bars, which were aligned to begin just prior to the observed current onset (within 15–20 ms). The external solution contained (in mM) 140 NaCl, 5 KCl, 1 CaCl2, 1.2 MgCl2, 10 HEPES pH 7.4, and 11.1 glucose. The internal solution contained (in mM) was composed of 4 NaCl, 131 CsF, 1 MgCl2, 10 EGTA, and 10 HEPES pH 7.2. Initially, currents were elicited three to five times with 10 μM (S)-AMPA with 40 sec intervening wash-off periods. Following this control period, which allowed the current to reach a steady state, cells were preincubated with the ON of interest at a specified concentration for 30 s before 10 μM (S)-AMPA was reapplied in the maintained presence of ON. The minimal current amplitude value was measured relative to the baseline current at –80 mV with each application of (S)-AMPA. The percentage of inhibition produced by each concentration of ON was calculated relative to the control current.
For determining the mode of inhibition (Fig. 1f-g and S2b-e), the internal solution contained (in mM) 130 KCl, 5 EGTA, 5 MgATP, and 10 HEPES pH 7.2. Following a single 500 ms application of 1 mM (S)-AMPA and a 40 s wash-off period, five concentrations of (S)-AMPA (ranging from 1 µM to 1 mM) were applied (for 500 ms each) in the presence of a specified concentration of RGLS4326. The amplitudes of currents recorded in the presence of (S)-AMPA and RGLS4326 were plotted as a current amplitude divided by the maximal amplitude of current elicited by 1 mM (S)-AMPA alone (I/Imax). The I/Imax data were fitted in Graphpad Prism with a concentration-response logistic equation to estimate the EC50 and Hill slopes values using the least squares algorithm. Curves were constrained between 0 and 1. The experiments were repeated in separate control cells (Fig. S2f), where five concentrations of (S)-AMPA (ranging from 1 µM to 1 mM) were applied for 500 ms each (without the initial application of 1 mM (S)-AMPA) in the absence of RGLS4326. Schild analysis was performed by creating a double logarithmic plot of Log(DR-1) as the ordinate and Log(RGLS4326 concentration) as the abscissa, where DR (the dose ratio) was calculated as the ratio of the (S)-AMPA EC50 values recorded in the presence of RGLS4326 relative to the EC50 value determined for the time-matched control. Data were fitted with a linear regression using Origin 2023 (OriginLab) to obtain the slope value. The slope value of ~1.0 was indicative of competitive antagonism.
Cell lines
HeLa (ATCC) cells were maintained in Eagle’s Minimum Essential Medium (ATCC 30-2003) supplemented with 10% FBS and no antibiotics. HEK 293S GnTI– cells (ATCC, CRL-3022) were cultured in the Freestyle 293 expression medium (GIBCO, 12338018) at 30 °C and 6% CO2. Sf9 cells (GIBCO, 12659017) were cultured in the Sf-900 III SFM media (GIBCO, 12658027) at 27 °C. HEK 293 cells for patch-clamp experiments were maintained at 37 °C and 5% CO2 in Dulbecco’s Modified Eagle’s Medium (Merck, D6429), supplemented with 10% fetal bovine serum (Gibco, 16140071). HEK293 GluA1/GluA4 EZ (Charles River Laboratories) cells were maintained in DMEM/F12 with 10% FBS. Pkd1RC/- mouse ADPKD cells were maintained as described previously22. Human primary ADPKD cells obtained from PKD Research Biomarker and Biomaterial Core at the University of Kansas Medical Center (KUMC) were maintained in DMEM:F-12 medium (10565-018; Gibco) supplemented with 5% FBS, 5 μg/mL insulin, 5 μg/mL transferrin, and 5 ng/mL sodium selenite (ITS)(17-838Z; Lonza). All cells unless otherwise stated were incubated in an atmosphere of 95% air and 5% CO2 at 37 °C. Three-dimensional cystogenesis assay was performed as described previously22.
Luciferase assays
Luciferase assays were performed as described previously20. Briefly, HeLa cells were seeded overnight prior to co-transfecting (i) the LightSwitch 3´UTR Reporter GoClone constructs containing two fully complementary miR-17-, miR-20a-, miR-93-, miR-106a-, or miR-33b- binding sequences at the 3’UTR of a luciferase gene (S880135, S880171, S880427, S880015, or S880234; Active Motif) with (ii) the corresponding pre-miRNA expression construct (HmiR0199-MR04, HmiR0202-MR04, HmiR0110-MR04, HmiR0392-MR04; GeneCopoeia, or PMIRH33bPA-1; Systems Biosciences) using Lipofectamine LTX-PLUS Reagent (15338100; Thermo). Luciferase reporter constructs containing full-length 3’UTR of human PKD1 or PKD2 genes were also used (S807443 and S810972; Active Motif). Cells were re-seeded overnight prior to anti-miR transfection for 24 h using Lipofectamine RNAiMAX (13778150; Thermo). Luciferase assays were performed according to the manufacturer’s instructions (32031; Active Motif). EC50 values were estimated by GraphPad Prism version 10.2.2 and no curve constraint was applied.
Anti-miR treatment in vitro and gene expression analysis
For studies in mouse ADPKD Pkd1RC/- cells, total RNA was collected using a standard protocol 24 h post anti-miR transfection with Lipofectamine RNAiMAX. For studies in primary human ADPKD cells, total RNA was collected 48 h post anti-miR transfection with Lipfectamine3000. Total RNA was extracted using the RNeasy mini kit (Qiagen). Reverse transcription and pre-amplification were performed using Bio-Rad T100 thermocycler (Bio-Rad) according to Fluidigm’s protocol. Quantitative real-time PCR was performed using the BioMark Real-Time PCR System Dynamic Array 192.24 IFC (Fluidigm). Data were analyzed using the BioMark Real-Time PCR analysis software version 2 (Fluidigm). Relative gene expression values were determined using the ΔΔCT method. Mouse miR-17 PD-Sig was calculated as described previously20.
Western blot analysis
PC1, PC2, and actin were detected in cell lysates of primary ADPKD cell lines 72 h after transfection with RGLS8429 as described previously22. Briefly, Western blot was carried out on 3–8% Tris-Acetate gels and proteins were transferred to a nitrocellulose membrane using the Bio-Rad Trans-Blot Semi-Dry Transfer system. The membranes were probed overnight at 4 °C with PC1 (7E12 Santa Cruz, sc-130554, at 1:500), PC2 (D3 Santa Cruz, sc-28331, at 1:1000 for Fig. 4b; or gift from the Baltimore PKD Core, at 1:1000), or Actin-B (Invitrogen, BA3R at 1:5000) and detected with chemiluminescence using standard protocols.
Constructs for large-scale protein expression
The fusion construct GluA2-γ2 was prepared by introducing a GT linker between a modified rat GluA2flip subunit (Uniprot ID: P19491) with Q at the Q/R-site (Q586), 36 residues removed from the carboxyl-terminus, 6 residues (L378, T379, L381, P382, S383 and G384; numbering according to the mature polypeptide sequence) deleted from the ATD-LBD polypeptide linker and three of four predicted N-linked glycosylation sites knocked-out (N235E, N385D and N392Q), which was previously called GluA2*51 and mouse γ2 C-terminally truncated after L20752. GluA2-γ2 was introduced into BacMam vector for baculovirus-based protein expression in mammalian cells53, with the C-terminal thrombin cleavage site (LVPRG), followed by eGFP and octa-His affinity tag (8xHis).
GluA1 and GluA2 whole-cell patch-clamp experiments
DNA encoding GluA1flip or GluA2flip(Q) AMPA receptor subunits were introduced into a pIRES plasmid for expression in eukaryotic cells that were engineered to produce green fluorescent protein via a downstream internal ribosome entry site51. HEK293 cells grown on glass coverslips in 35 mm dishes were transiently transfected with 1-5 μg of plasmid DNA using Lipofectamine 2000 Reagent (Invitrogen). Recordings were made 24 to 96 h after transfection at RT. Currents from whole cells held at a –60 mV potential were recorded using Axopatch 200B amplifier (Molecular Devices, LLC), filtered at 5 kHz, and digitized at 10 kHz using low-noise data acquisition system Digidata 1440 A and pCLAMP software (Molecular Devices, LLC). The external solution contained (in mM): 140 NaCl, 2.4 KCl, 4 CaCl2, 4 MgCl2, 10 HEPES pH 7.3, and 10 glucose; 7 mM NaCl was added to the extracellular activating solution containing 3 mM Glu to improve visualization of the border between two solutions coming out of a two-barrel theta glass pipette, which allowed its more precise positional adjustment for faster solution exchange. ON solutions were prepared by diluting the ON stock solutions (5 mM in 140 mM NaCl and 10 mM HEPES pH 7.3) with the Glu-containing external solution. The internal solution contained (in mM): 150 CsF, 10 NaCl, 10 EGTA, and 20 HEPES pH 7.3. Rapid solution exchange was achieved with a two-barrel theta glass pipette controlled by a piezoelectric translator. Typical 10-90% rise times were 200-300 µs, as measured from junction potentials at the open tip of the patch pipette after recordings. Data analysis was performed using Origin 9.1.0 software (OriginLab Corp.). Concentration dependence of inhibition was fitted with the logistic equation: IBlocked / IControl = (1 – 1 / (1 + ([Inhibitor]/IC50)^nHill), where [Inhibitor] is the inhibitor concentration, IC50 is the half-maximal inhibitory concentration, and nHill is the Hill coefficient. No curve constraint was applied.
Protein expression and purification
The GluA2-γ2 bacmids and baculoviruses were made using standard methods. The P1 and P2 virus were produced in Sf9 cells (GIBCO, 12659017) and added to HEK293 GnTI– cells at 37 °C and 5% CO2. At 12h post-transduction, protein expression was induced by the addition of 10 mM sodium butyrate and the temperature was changed to 30 °C. At 72 h post-transduction, cells were collected by low-speed centrifugation (4000 rpm, 15 min). Cells were then washed with PBS pH 8.0 and pelleted by low-speed centrifugation (4000 rpm, 15 min). The cell pellet was resuspended in ice-cold lysis buffer, containing 150 mM NaCl, 20 mM Tris pH 8.0, 1 mM β-mercaptoethanol (βME), 0.8 µM aprotinin, 2 µg/mL leupeptin, 2 µM pepstatin A, and 1 mM phenylmethylsulfonyl fluoride (PMSF). Resuspended cells were lysed using the Misonix sonicator (6 ×15 sec bursts, with 15 sec rest in between, at an amplitude of 8; this process was repeated 3 times to ensure optimal cell lysis). Following cell lysis, the lysate was clarified after centrifugation (8000 rpm, 15 min), and the membranes were collected by ultracentrifugation (40,000 rpm, 40 min). The membranes were collected and homogenized, then solubilized for 2 h in 150 mM NaCl, 20 mM Tris-HCl pH 8.0, and 1% digitonin (Cayman Chemical Company, 14952). Insoluble material was removed by ultracentrifugation (40,000 rpm, 40 min). Cobalt-charged metal ion affinity resin (TALON) was added to the soluble material (1 mL resin per 1 L cells) and left to bind for 10–14 h. The resin was washed with 10 column volumes of 150 mM NaCl, 20 mM Tris-HCl pH 8.0, 50 mM imidazole, and 0.05% digitonin. The elution was done with the same buffer containing 250 mM imidazole. The sample was then concentrated and digested with thrombin (1:100 mass ratio of thrombin to eluted protein) for 1 h at 22 °C. The sample was then loaded onto a size-exclusion chromatography column (Superose 6 10/30 GL, GE Healthcare) equilibrated with 150 mM NaCl, 20 mM Tris-HCl pH 8.0, and 0.05% digitonin. The peak fractions containing GluA2-γ2 were pooled, concentrated to ~4 mg/mL, and used for cryo-EM specimen preparation. All steps, unless otherwise noted, were performed at 4 °C.
Cryo-EM sample preparation and data collection
For preparing GluA2-γ2RGLS4326 samples, either 300-mesh R 0.6/1.0 or R 1.2/1.3 commercial UltraAuFoil was used (EMS, Morrisville, NC, Q350AR1A or Q350AR1.3 A), or in-house Au/Au grids were prepared as described previously54. The grids were glow discharged with PELCO easy Glow cleaning system (Ted Pella, 25 sec, 15 mA) immediately before sample application to make their surfaces hydrophilic. Purified protein was supplemented with 200 µM RGLS4326. The mixed sample was incubated on ice for 30 min and then centrifuged at 40,000 rpm to remove any aggregated material. An FEI Vitrobot Mark IV (Thermo Fisher Scientific) was used to plunge-freeze the grids after application of 3 µL protein solution at 4 °C, 100% humidity, with blot time of 3 sec, wait time of 30 sec, and blot force of 3. The grids were imaged on a 300-kV Titan Krios transmission electron microscope (Thermo Fisher Scientific) equipped with a post-column GIF Quantum energy filter with the slit width set to 20 eV and a Gatan K3 Summit direct electron detection camera (Gatan) using automated data collection software Leginon v3.555. A total of 9755 micrographs were collected. Specifically, data was collected in counting mode, with a pixel size of 0.83 Å (105,000x nominal magnification) across the defocus range of –1.0 to –2.0 µm. The total dose of 58 e−Å−2 was attained by using the dose rate of ~16.0 e–pixel–1s–1 across 50 frames of the 2.5 sec total exposure time.
Image processing
The initial processing steps were carried out using Relion 3.156. Frame alignment was performed on 9,793 combined movies for apo and activated state, using MotionCor257. Contrast transfer function (CTF) estimation was performed using Gctf58 on non-dose-weighted micrographs, and subsequent data processing was done on dose-weighted micrographs. Approximately 10,000 particles were picked using reference-free Gaussian autopicking to generate 2D classes that were then used as templates to autopick 1,248,404 particles. The particles were extracted with a 480-pixel box size, binned to 240-pixel box size and imported into cryoSPARC v3.3.259. Particles were cleaned by multiple rounds of 2D classification, yielding 240,788 particles, which were then used to generate an initial model. Subsequent rounds and heterogeneous refinement, using one reference class created using ab initio reconstruction and three automatically generated ‘garbage’ classes, yielded 192,053 particles. At this moment, we observed a distinct density within each LBD clamshell, likely representing the RGLS4326 ON. These 192,053 particles were imported back to Relion, and re-extracted without binning, for CTF refinement and Bayesian polishing60. Afterwards, particles were re-imported back to cryoSPARC for further rounds of classification. To minimize heterogeneity created by the flexible ATD layer relative to the rest of the protein, and the micelle around the TMD, particle subtraction was performed with a mask whereby these regions were omitted. A final particle stack of 192,331 particles were used in the full-length map, and 131,798 particles for the LBD-TMD map, resolved to 3.24 and 3.13 Å resolution, respectively. The data processing and processing workflow is summarized in Fig. S9.
Model building and refinement
The GluA2-γ2RGLS4326 model was built in Coot61 using cryo-EM density and the open-state structure of GluA2-γ2 (PDB ID: 5WEO) as a guide. The model was tested for overfitting by shifting their coordinates by 0.5 Å (using shake) in Phenix, refining each shaken model against a corresponding unfiltered half map, and generating densities from the resulting models in Chimera. The resulting model was real space refined in Phenix62 and visualized in Chimera63 or Pymol64.
Statistical analysis
Unless otherwise specified, data are shown as the mean ± standard deviations (SD). Statistical analysis was performed using Student’s t-test for pairwise comparisons or Analysis of variance (ANOVA), followed by Dunnett’s or Tukey’s post hoc test for multiple comparisons. P values of <0.05 were considered statistically significant.
Ethics statement
All animal studies were conducted in accordance with the institutional AAALAC Guidelines and approved by the Institutional Animal Care and Use Committees at WuXi AppTec, Charles River, SNBL-USA, Calvert, Crown Bio, Explora, Melior, UT Southwestern, and Regulus where the studies were performed. C57BL6J (WuXi AppTec, Jackson and Charles River), CD-1 (WuXi AppTec, Charles River, SNBL-USA and Calvert), and Pkd1F/RC (Ksp/Cre;Pkd1F/RC maintained in C57BL6 background22) mice and cynomolgus monkeys (Macaca fascicularis; WuXi AppTec, Charles River, and SNBL-USA) were used in this study.
Reporting summary
Further information on research design is available in the Nature Portfolio Reporting Summary linked to this article.
Data availablity
The cryo-EM density maps for the full-length GluA2-γ2RGLS4326 and its LBD-TMD were deposited to the Electron Microscopy Data Bank (EMDB) under the accession codes EMD-47792 and EMD-47793, respectively. The atomic coordinates for the full-length GluA2-γ2RGLS4326 and its LBD-TMD were deposited to the Protein Data Bank (PDB) under the accession codes 9E9D and 9E9E, respectively.
References
-
Crooke, S. T., Baker, B. F., Crooke, R. M. & Liang, X. H. Antisense technology: an overview and prospectus. Nat. Rev. Drug Discov. 20, 427–453 (2021).
-
Kulkarni, J. A. et al. The current landscape of nucleic acid therapeutics. Nat. Nanotechnol. 16, 630–643 (2021).
-
Egli, M. & Manoharan, M. Chemistry, structure and function of approved oligonucleotide therapeutics. Nucleic Acids Res. 51, 2529–2573 (2023).
-
Mullard, A. 2023 FDA approvals. Nat. Rev. Drug Discov. 23, 88–95 (2024).
-
Jones, C. H. et al. Breaking the mold with RNA-a “RNAissance” of life science. NPJ Genom. Med. 9, 2 (2024).
-
Chi, X., Gatti, P. & Papoian, T. Safety of antisense oligonucleotide and siRNA-based therapeutics. Drug Discov. Today 22, 823–833 (2017).
-
Neben S. Translational insights of oligonucleotide ADME and toxicology: from bench to bedside with a GalNAc-conjugated anti-miR. Presented at the TIDES – Oligonucleotides and Peptides Conference, from May 2018, Boston, MA, USA.
-
Goyenvalle, A. et al. Considerations in the preclinical assessment of the safety of antisense oligonucleotides. Nucleic Acid Ther. 33, 1–16 (2023).
-
Frazier, K. S. Antisense oligonucleotide therapies: the promise and the challenges from a toxicologic pathologist’s perspective. Toxicol. Pathol. 43, 78–89 (2015).
-
Crooke, S. T., Liang, X. H., Baker, B. F. & Crooke, R. M. Antisense technology: A review. J. Biol. Chem. 296, 100416 (2021).
-
Crooke, S. T., Vickers, T. A. & Liang, X. H. Phosphorothioate modified oligonucleotide-protein interactions. Nucleic Acids Res 48, 5235–5253 (2020).
-
Henry, S. P. et al. Activation of the alternative pathway of complement by a phosphorothioate oligonucleotide: potential mechanism of action. J. Pharm. Exp. Ther. 281, 810–816 (1997).
-
Sheehan, J. P. & Lan, H. C. Phosphorothioate oligonucleotides inhibit the intrinsic tenase complex. Blood 92, 1617–1625 (1998).
-
Janas, M. M. et al. Impact of oligonucleotide structure, chemistry, and delivery method on in vitro cytotoxicity. Nucleic Acid Ther. 27, 11–22 (2017).
-
Lindow, M. et al. Assessing unintended hybridization-induced biological effects of oligonucleotides. Nat. Biotechnol. 30, 920–923 (2012).
-
Berman, C. L. et al. Recommendations for safety pharmacology evaluations of oligonucleotide-based therapeutics. Nucleic Acid Ther. 24, 291–301 (2014).
-
Andersson, P. Preclinical safety assessment of therapeutic oligonucleotides. Methods Mol. Biol. 2434, 355–370 (2022).
-
Winkle, M., El-Daly, S. M., Fabbri, M. & Calin, G. A. Noncoding RNA therapeutics – challenges and potential solutions. Nat. Rev. Drug Discov. 20, 629–651 (2021).
-
Jadhav, V., Vaishnaw, A., Fitzgerald, K. & Maier, M. A. RNA interference in the era of nucleic acid therapeutics. Nat. Biotechnol. 42, 394–405 (2024).
-
Lee, E. C. et al. Discovery and preclinical evaluation of anti-miR-17 oligonucleotide RGLS4326 for the treatment of polycystic kidney disease. Nat. Commun. 10, 4148 (2019).
-
Hajarnis, S. et al. microRNA-17 family promotes polycystic kidney disease progression through modulation of mitochondrial metabolism. Nat. Commun. 8, 14395 (2017).
-
Lakhia, R. et al. PKD1 and PKD2 mRNA cis-inhibition drives polycystic kidney disease progression. Nat. Commun. 13, 4765 (2022).
-
NCT04536688: A Study of RGLS4326 in Patients with Autosomal Dominant Polycystic Kidney Disease.
-
Keinänen, K. et al. A family of AMPA-selective glutamate receptors. Science 249, 556–560 (1990).
-
Geary, R. S., Norris, D., Yu, R. & Bennett, C. F. Pharmacokinetics, biodistribution and cell uptake of antisense oligonucleotides. Adv. Drug Deliv. Rev. 87, 46–51 (2015).
-
Geary, R. S., Yu, R. Z., Siwkowski, A. & Levin, A. A. Pharmacokinetic/Pharmacodynamic Properties of Phosphorothioate 2’-O-(2-Methoxyethyl)-Modified Antisense Oligonucleotides in Animals and Man Antisense Drug Technology: Principles, Strategies and Applications. S. T. Crooke. Barlsbad, CA CRC Press: 305–336.
-
Levin, A. A., Yu, R. Z. & Geary, R. S. Basic Principles of the Pharmacokinetics of Antisense Oligonucleotide Drugs. Antisense Drug Technology – Principles, Strategies, and Applications. S. T. Crooke. Boca Raton, FL, USA, CRC Press, Taylor and Francis Group: 183–215.
-
Hung, G. et al. Characterization of target mRNA reduction through in situ RNA hybridization in multiple organ systems following systemic antisense treatment in animals. Nucleic Acid Ther. 23, 369–378 (2013).
-
Bian, S. et al. MicroRNA cluster miR-17-92 regulates neural stem cell expansion and transition to intermediate progenitors in the developing mouse neocortex. Cell Rep. 3, 1398–1406 (2013).
-
Mao, S. et al. miR-17 regulates the proliferation and differentiation of the neural precursor cells during mouse corticogenesis. FEBS J. 281, 1144–1158 (2014).
-
Brinkmann, K. et al. miR17~92 restrains pro-apoptotic BIM to ensure survival of haematopoietic stem and progenitor cells. Cell Death Differ. 27, 1475–1488 (2020).
-
Yelshanskaya, M. V. et al. Structural bases of noncompetitive inhibition of AMPA-subtype ionotropic glutamate receptors by antiepileptic drugs. Neuron 91, 1305–1315 (2016).
-
Drug Approval Package: Fycompa (perampanel) Tablets, Eisai, Inc. NDA 202834. accessdata.fda.gov.
-
Bartel, D. P. MicroRNAs: target recognition and regulatory functions. Cell 136, 215–233 (2009).
-
Schirle, N. T., Sheu-Gruttadauria, J. & MacRae, I. J. Structural basis for microRNA targeting. Science 346, 608–613 (2014).
-
Schirle, N. T., Sheu-Gruttadauria, J., Chandradoss, S. D., Joo, C. & MacRae, I. J. Water-mediated recognition of t1-adenosine anchors Argonaute2 to microRNA targets. Elife 4, e07646 (2015).
-
Twomey, E. C., Yelshanskaya, M. V., Grassucci, R. A., Frank, J. & Sobolevsky, A. I. Channel opening and gating mechanism in AMPA-subtype glutamate receptors. Nature 549, 60–65 (2017).
-
Yelshanskaya, M. V., Patel, D. S., Kottke, C. M., Kurnikova, M. G. & Sobolevsky, A. I. Opening of glutamate receptor channel to subconductance levels. Nature 605, 172–178 (2022).
-
Sobolevsky, A. I., Rosconi, M. P. & Gouaux, E. X-ray structure, symmetry and mechanism of an AMPA-subtype glutamate receptor. Nature 462, 745–756 (2009).
-
Armstrong, N. & Gouaux, E. Mechanisms for activation and antagonism of an AMPA-sensitive glutamate receptor: crystal structures of the GluR2 ligand binding core. Neuron 28, 165–181 (2000).
-
Twomey, E. C. & Sobolevsky, A. I. Structural Mechanisms of Gating in Ionotropic Glutamate Receptors. Biochemistry 57, 267–276 (2018).
-
Shen, W. et al. Chemical modification of PS-ASO therapeutics reduces cellular protein-binding and improves the therapeutic index. Nat. Biotechnol. 37, 640–650 (2019).
-
Hagedorn, P. H. et al. Acute neurotoxicity of antisense oligonucleotides after intracerebroventricular injection into mouse brain can be predicted from sequence features. Nucleic Acid Ther. 32, 151–162 (2022).
-
Vukolova, M. N., Yen, L. Y., Khmyz, M. I., Sobolevsky, A. I. & Yelshanskaya, M. V. Parkinson’s disease, epilepsy, and amyotrophic lateral sclerosis-emerging role of AMPA and kainate subtypes of ionotropic glutamate receptors. Front Cell Dev. Biol. 11, 1252953 (2023).
-
Shepherd, J. D. & Huganir, R. L. The cell biology of synaptic plasticity: AMPA receptor trafficking. Annu Rev. Cell Dev. Biol. 23, 613–643 (2007).
-
Schwarz, L. A., Hall, B. J. & Patrick, G. N. Activity-dependent ubiquitination of GluA1 mediates a distinct AMPA receptor endocytosis and sorting pathway. J. Neurosci. 30, 16718–16729 (2010).
-
NCT05429073: A Study of RGLS8429 in Healthy Volunteers.
-
NCT05521191: A Study of RGLS8429 in Patients with Autosomal Dominant Polycystic Kidney Disease.
-
Kamel, A., Owen, T., Cole, I., Valencia, T. & Lee, E. C. Pharmacokinetics and Absorption, Distribution, Metabolism and Excretion of RGLS4326 in Mouse and Monkey, an Anti-miR-17 Oligonucleotide for the Treatment of Polycystic Kidney Disease. Drug Metab. Dispos. 51, 1536–1546 (2023).
-
Hironaka, K. et al. Enzyme replacement in the CSF to treat metachromatic leukodystrophy in mouse model using single intracerebroventricular injection of self-complementary AAV1 vector. Sci. Rep. 5, 13104 (2015).
-
Yelshanskaya, M. V., Li, M. & Sobolevsky, A. I. Structure of an agonist-bound ionotropic glutamate receptor. Science 345, 1070–1074 (2014).
-
Twomey, E. C., Yelshanskaya, M. V., Grassucci, R. A., Frank, J. & Sobolevsky, A. I. Elucidation of AMPA receptor-stargazin complexes by cryo-electron microscopy. Science 353, 83–86 (2016).
-
Goehring, A. et al. Screening and large-scale expression of membrane proteins in mammalian cells for structural studies. Nat. Protoc. 9, 2574–2585 (2014).
-
Russo, C. J. & Passmore, L. A. Electron microscopy: Ultrastable gold substrates for electron cryomicroscopy. Science 346, 1377–1380 (2022).(2014).
-
Suloway, C. et al. Automated molecular microscopy: the new Leginon system. J. Struct. Biol. 151, 41–60 (2005).
-
Zivanov, J. et al. New tools for automated high-resolution cryo-EM structure determination in RELION-3. Elife 7, e42166 (2018).
-
Zheng, S. Q. et al. MotionCor2: anisotropic correction of beam-induced motion for improved cryo-electron microscopy. Nat. Methods 14, 331–332 (2017).
-
Zhang, K. Gctf: Real-time CTF determination and correction. J. Struct. Biol. 193, 1–12 (2016).
-
Punjani, A., Rubinstein, J. L., Fleet, D. J. & Brubaker, M. A. cryoSPARC: algorithms for rapid unsupervised cryo-EM structure determination. Nat. Methods 14, 290–296 (2017).
-
Zivanov, J., Nakane, T. & Scheres, S. H. W. A Bayesian approach to beam-induced motion correction in cryo-EM single-particle analysis. IUCrJ 6, 5–17 (2019).
-
Emsley, P. & Cowtan, K. Coot: model-building tools for molecular graphics. Acta Crystallogr D. Biol. Crystallogr 60, 2126–2132 (2004).
-
Afonine, P. V. et al. Towards automated crystallographic structure refinement with phenix.refine. Acta Crystallogr D. Biol. Crystallogr 68, 352–367 (2012).
-
Pettersen, E. F. et al. UCSF Chimera-a visualization system for exploratory research and analysis. J. Comput Chem. 25, 1605–1612 (2004).
-
DeLano, W. L. The PyMOL Molecular Graphics System. DeLano Scientific. 2002. San Carlos, CA, USA.
Acknowledgements
The authors thank Graham Jang, Kathleen Gogas, Steven Neben, and Timothy Wright for their scientific input, and Rekha Garg, and Preston Klassen for their editorial input. We thank Eurofins PanLabs Discovery Services, ClearCut Research, and Monoceros Biosciences for critical services. We thank Darren Wallace and the PKD Biomarkers and Biomaterials Core of the University of Kansas Medical Center for providing human ADPKD cells. We thank the University of Texas Southwestern O’Brien Kidney Research Core Center for providing critical reagents and services. Some of this work was performed at the Columbia University Cryo-Electron Microscopy Center. Some of this work was performed at the Pacific Northwest Center for Cryo-EM (PNCC) at Oregon Health and Science University (OHSU), supported by the National Institutes of Health (NIH) grant U24GM129547 and accessed through Environmental Molecular Sciences Laboratory (EMSL) (grid.436923.9), a DOE Office of Science User Facility sponsored by the Office of Biological and Environmental Research. Some of this work was performed at the National Center for CryoEM Access and Training (NCCAT) and the Simons Electron Microscopy Center located at the New York Structural Biology Center, supported by the NIH Common Fund Transformative High Resolution Cryo-Electron Microscopy program (U24 GM129539) and by grants from the Simons Foundation (SF349247) and NY State Assembly Majority. Some of this work was performed at the Stanford-SLAC Cryo-EM Center (S2C2), supported by the National Institutes of Health Common Fund Transformative High Resolution Cryo-Electron Microscopy program (U24 GM129541). L.Y.Y. was supported by the NIH grant (NS132554). S.P.G. was supported by the NIH grant (NS139087). A.I.S. was supported by the Human Frontier Science Program (HFSP) Award and the NIH grants (NS083660, NS107253, AR078814, CA206573). This work was funded by Regulus Therapeutics.
Ethics declarations
Competing interests
T.V., T.V., S.D., F.V., J.H., J.M., M.C., T.O., A.K., D.D., G.A.K. and E.C.L. are current or former employees of Regulus Therapeutics. C.B. is a consultant for Regulus Therapeutics. J.R. and R.K. are current or former employees of Metrion Biosciences. Both the V.P. and A.I.S. lab have sponsored research agreements with Regulus Therapeutics. V.P. serves as scientific consultant for Otsuka Pharmaceuticals, Maze Therapeutics, Travere Therapeutics, and Regulus Therapeutics. V.P. serves as the chair of the Scientific Advisory Panel for the PKD Foundation. A patent application related to the treatment of ADPKD was filed by The Board of Regents of The University of Texas System and Regulus Therapeutics, listing V.P. as an inventor. A patent application based on results disclosed herein was submitted by Regulus Therapeutics, listing D.D., G.A.K., and E.C.L. as inventors. The remaining authors declare no competing interests.
Peer review
Peer review information
Nature Communications thanks Patrik Andersson, Katharina Dürr, Rei Matsuoka, Daniel van Leeuwen and the other anonymous reviewer(s) for their contribution to the peer review of this work. A peer review file is available.
Additional information
Publisher’s note Springer Nature remains neutral with regard to jurisdictional claims in published maps and institutional affiliations.
Supplementary information
Rights and permissions
Open Access This article is licensed under a Creative Commons Attribution-NonCommercial-NoDerivatives 4.0 International License, which permits any non-commercial use, sharing, distribution and reproduction in any medium or format, as long as you give appropriate credit to the original author(s) and the source, provide a link to the Creative Commons licence, and indicate if you modified the licensed material. You do not have permission under this licence to share adapted material derived from this article or parts of it. The images or other third party material in this article are included in the article’s Creative Commons licence, unless indicated otherwise in a credit line to the material. If material is not included in the article’s Creative Commons licence and your intended use is not permitted by statutory regulation or exceeds the permitted use, you will need to obtain permission directly from the copyright holder. To view a copy of this licence, visit http://creativecommons.org/licenses/by-nc-nd/4.0/.
About this article

Cite this article
Valencia, T., Yen, L.Y., Berman, C. et al. The nucleobase guanine at the 3’-terminus of oligonucleotide RGLS4326 drives off-target AMPAR inhibition and CNS toxicity. Nat Commun 16, 10762 (2025). https://doi.org/10.1038/s41467-025-65799-5
-
Received:
-
Accepted:
-
Published:
-
Version of record:
-
DOI: https://doi.org/10.1038/s41467-025-65799-5