Main
Biomolecular condensates1,2 in living cells are often internally structured, containing multiple immiscible phases with distinct composition and function3. The nucleolus, for example, contains three such phases involved in successive steps of ribosome biogenesis4,5. Similarly, processing bodies (PBs) exhibit core–shell architectures that support their role in translational control6. These internal structures influence condensate formation, dissolution and stress response7. Some multiphase condensates contain vacuole-like regions that resemble the dilute phase, as seen in vivo in germ granules8 and nucleoli9,10. Yet, despite their prevalence and importance, the mechanisms by which cells form and maintain these complex architectures remain poorly understood.
Synthetic or in vitro models of biomolecular condensates11,12,13,14 provide mechanistic insights into their assembly and function, including the origins of a multiphase structure15,16. At thermodynamic equilibrium, immiscible phases adopt configurations that minimize the interfacial energy, as determined by intermolecular interactions among their components. In the multiphase nucleolus, for instance, surface tensions among the different interfaces explain the nested organization of its subcompartments4. The formation of droplets with internal vacuoles, however, requires additional factors such as surface-active species that stabilize internal interfaces. For example, RNA–protein condensates formed at off-stoichiometric ratios form hollow regions or vacuoles, stabilized by the preferential localization of one charged component at the interface17,18.
Multiphase condensate architectures can also form by non-equilibrium processes due to the chemically fueled turnover of condensate components or transient changes in external conditions. Within active droplets, the chemical activation of phase-separating components competes with their spontaneous deactivation, resulting in drop dissolution19. Under transient or steady-state conditions, vacuoles can form in the drop interior where the rate of deactivation and dissolution exceeds the diffusive delivery rate of activated components20,21,22. Alternatively, metastable droplets with multiphase architectures can be achieved by rapid changes in external conditions, resulting in non-equilibrium states that promote the formation of new phases via nucleation and growth or spinodal decomposition. For example, by quickly lowering the temperature, vacuoles form in synthetic condensates as their macromolecular components redistribute in the pursuit of new equilibrium compositions with higher macromolecule concentrations23,24. The resulting metastable structures can be long-lived and are further influenced by structural reordering at the interface25,26, osmotic pressure differences27 or additional phase-separating components28.
Temporal changes in the local pH provide a biologically relevant way to tune the molecular interactions within condensates. Cells control the strength of macromolecular interactions through post-translational modifications29, such as phosphorylation30,31, which selectively alter charge or binding properties to regulate condensate assembly and organization. In in vitro systems, pH changes offer a simple and versatile proxy for this biological regulation: by shifting the ionization state of amino acids or polymers, pH changes directly modulate electrostatic interactions in space and time32,33,34. Unlike temperature perturbations, which affect all molecular interactions uniformly, pH changes selectively modify electrostatic forces and, thus, provide a useful handle for triggering structural transitions within condensates.
Here we demonstrate vacuole formation in complex coacervate droplets in response to transient changes in the pH. Using an in vitro model35, we show how rapid pH changes create non-equilibrium conditions in the drop interior, resulting in phase separation and the coarsening of low-density vacuoles. To quantify these processes, we develop experimental methods to systematically vary and measure transient pH changes around each droplet as well as the resulting change in droplet size and internal structure. By analyzing hundreds of droplets, we show how vacuole formation depends on the rate of pH change and on drop size. These observations are reproduced and explained by a kinetic model of associative phase separation mediated by pH-responsive electrostatic interactions. Due to the slow mobility of the phase-separating components, a comparatively fast decrease in pH causes the drop composition to enter the spinodal region, thereby triggering internal phase separation and vacuole formation. We discuss how competition between the rates of external changes in the solution pH and internal relaxation of the condensate composition can provide a mechanistic understanding of vacuole formation in associative condensates. Given the presence of substantial pH gradients in and around biological condensates32,34, the proposed mechanisms for the pH-induced restructuring of complex coacervates may be relevant to their formation and function in vivo. Looking forward, the present system offers further opportunities for controlling droplet structure using internal pH changes generated by the catalytic activity of their enzyme components35.
Results
Complex coacervates form vacuoles on rapid pH change
Associative phase separation of oppositely charged polyions, or complex coacervation, is known to depend on a range of parameters that influence the electrostatic interactions between the polyions36,37. Perhaps, the most important is the net balance of charges on the polyions, which is a function of both composition and pH for weak polyelectrolytes. Although it is intuitive that complex coacervates should be sensitive to the solution pH, it is not clear what happens to a coacervate when pushed out of equilibrium by a change in the pH. Our model system of glucose oxidase and DEAE-dextran has previously been shown to respond to changes in solution pH35. Here we probe the equilibrium and out-of-equilibrium phase behavior of this system to answer the question: what happens to a coacervate when the pH is changed?
To investigate how complex coacervates respond to changes in pH, we first established the equilibrium phase behavior as a function of pH. We focused efforts on basic pH values (8–10), as this range includes the pKa of the cationic polymer (pKa ≈ 8.8)35. We then examined the dynamics of these coacervates when driven out of equilibrium by the addition of acid. The resulting pH decrease increases the positive charge on the polymer and decreases the negative charge on the enzyme, setting up an imbalance in the macromolecular charge ratio.
Initial turbidity experiments show a dependence of coacervate formation on pH and mixing ratio of the polyions (Supplementary Note 1). At pH 10, mixing the anionic enzyme (estimated charge ≈ −90e) with the cationic polymer (estimated charge ≈ +400e) results in phase separation, with a turbidity maximum occurring at an enzyme–polymer mass ratio of approximately 3:1 (0.76 mass fraction of the enzyme; Supplementary Fig. 1a). At pH 8, the enzyme carries a lower negative charge (approximately −60e), whereas the polymer has a higher positive charge (approximately +700e) compared with their respective charges at pH 10. Consequently, the turbidity maximum at pH 8 occurs at a higher 5:1 enzyme–polymer mass ratio (0.84 mass fraction of the enzyme; Supplementary Fig. 1b). Although droplet formation is observed at each pH value, droplets are not initially observed at pH 8 at the off-peak 3:1 enzyme–polymer mass ratio. Over longer times, however, micrometer-sized droplets gradually emerge, indicating the formation of condensed phases away from the optimal mixing ratio (Supplementary Figs. 2 and 3). Optical microscopy shows coacervate droplets with uniform interiors at both pH 10 and 8 for a common composition of enzyme and polymer (0.76 mass fraction of enzyme).
Driving preassembled coacervates at pH 10 out of equilibrium by adding acid can lead to the emergence of vacuoles (Fig. 1). Although equilibrium phase behavior was characterized at a constant pH and varying macromolecule ratios, we investigate the out-of-equilibrium behaviors by subjecting preformed coacervates to a rapid pH decrease at fixed concentrations of enzyme and polymer. In these experiments, we start with droplets at pH 10 with a 3:1 enzyme–polymer mass ratio, corresponding to the turbidity maximum at pH 10. On the addition of acid, we observe that many of these initially homogeneous droplets exhibit internal structures including spherical vacuoles (Fig. 1a) with a composition similar to that of the dilute phase (Fig. 1b and Supplementary Fig. 4b).

a, Anionic enzyme glucose oxidase phase separates with the cationic polymer DEAE-dextran to form uniform condensates at pH 10. Depending on the rate of pH decrease, initially uniform condensates at pH 10 may or may not form vacuoles at pH 8. b, Confocal microscopy images of coacervates formed using glucose oxidase labeled with Alexa Fluor 594 and unlabeled DEAE-dextran. Vacuole formation occurs when acid addition causes the pH to drop quickly from 10 to 8. Scale bars, 10 μm.
However, to program vacuole formation in coacervates, it is essential to understand how droplet properties and external perturbations influence the onset and dynamics of vacuole formation. To achieve this, we designed an experimental setup that allows us to vary the rate of pH change and simultaneously study how droplet properties evolve as a function of the surrounding pH.
Capillary experiments generate spatiotemporal pH profiles
To investigate the conditions under which vacuoles form, we first designed an experimental setup that subjects coacervate droplets to pH changes that vary in time and space in a controllable and reproducible manner. The setup allows us to observe morphological changes in the droplets and quantify pH changes in situ.
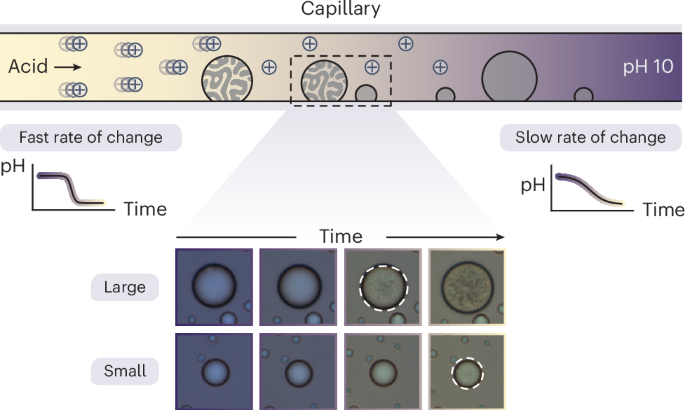
Our experimental setup consists of a coacervate solution contained in a glass capillary with a source of acid at one end (Fig. 2a). The source is a small agarose gel loaded with acid. As acid diffuses from the gel, the pH of the coacervate solution decreases with varying rates of pH decrease at different distances from the gel interface38. As the acid front travels across the capillary length, droplets closer to the gel boundary experience a faster and larger pH decrease, whereas droplets further away are exposed to slower and smaller decreases.

a, Representative images of a capillary experiment. The capillary contains an agarose gel with HCl at one end, whereas the rest of the capillary is filled with a coacervate solution in water at pH 10. Both acid and coacervate solutions contain 0.2 mg ml−1 of Xylenol Blue, a pH indicator enabling the visualization and quantification of pH. The total macromolecule concentration of the enzyme and polymer is 1 mg ml−1; the mass fraction of the enzyme is 0.76. b, Microscopy images of vacuole formation in a representative droplet over time as the pH decreases. Scale bars, 10 μm. c, Instantaneous pH of a single droplet is monitored over time by analyzing the pixel color. The rate of pH change experienced by a single droplet is estimated by the slope at pH 8.5 (solid line). The shaded region corresponds to a one-standard-deviation confidence interval. d, Imaging at different distances from the gel front enables a distribution of rates of pH change to be visualized. e, Instantaneous radius of a single droplet is quantified over time. For comparison, the drop radius is defined as the radius at pH 8.5. f, Droplets of varying sizes were imaged. Only coacervate drops with a radius greater than 3.4 μm (dashed line) were further analyzed for vacuole formation. g, Angular asymmetry of a coacervate drop was also quantified from images and used to automatically detect vacuole formation. The time at which the angular asymmetry first crosses a threshold value of 1.2 is used to determine the pH of vacuole formation, pHv. h, pHv varied among the more than 200 coacervate drops analyzed. The four different curves in d, f and h represent data from four different capillary experiments in the absence of a buffer (Supplementary Table 1 and Supplementary Note 3). Each curve corresponds to a kernel density estimate of the underlying distribution of the data scaled by the number of droplets in each experiment. The gray-shaded region gives the total distribution as well as the total number of drops from all the experiments.
To visualize these pH changes, we use the colorimetric pH indicator Xylenol Blue to quantify the pH of the solution in the capillary. With a pKa of 8.9, Xylenol Blue is sensitive to pH changes in the desired range (pH 8–10)39. As the pH decreases from 10, Xylenol Blue undergoes a color change from blue to yellow (Fig. 2a,b). The color of the indicator, captured in the microscopy images as RGB values, can be converted to pH using the relationship between the fraction of deprotonated indicator and the color coordinates in the CIE XYZ color space (Supplementary Note 2). Although the pH in the capillary may drop below 7, the accuracy of the pH measurements diminishes rapidly as the pH deviates further from the pKa of the indicator. We, therefore, limit our analysis to the pH range of 7–10, where the indicator provides reliable measurements.
By observing an individual droplet within the capillary, we can track its morphological changes, supporting insights into the droplet’s response to a pH change (Fig. 2b). A typical droplet begins as a homogeneous sphere at pH 10. As the pH decreases, indicated by a color transition from blue to yellow, the droplet changes in size. Under certain conditions of pH decrease, vacuoles form within the droplet.
For each coacervate drop, we measure changes in the surrounding pH, radius and internal structure using microscopy and image analysis (Fig. 2c–h and Supplementary Note 3). We use the radial variance transform40 and Trackpy41 packages in Python to identify and track the droplet centers. The colorimetric pH indicator is used to monitor the pH changes experienced by each droplet, with no spatial variations in pH observed at the droplet scale. For each droplet, the rate of pH decrease is estimated by fitting a parabola to the transient pH and evaluating the slope at a reference value of pH 8.5 (Fig. 2c). This common reference is chosen to balance the measurement accuracy, which is the highest near the indicator pKa of 8.9, and the relevance to vacuole formation, which typically occurs near pH 8. As the pH changes, the droplet radii also change due to the transport of components into and out of the droplet (Fig. 2e). Coacervate drops initially decrease in size followed by substantial swelling, which coincides with the onset of vacuole formation. To detect vacuoles, we use the radial variance transform to quantify angular variations in the image intensity within each droplet (Fig. 2g). The onset of vacuole formation is characterized by an increase in the angular variance beyond a threshold value. The corresponding pH at the onset of vacuole formation is denoted as pHv.
Analysis of data from four independent capillary experiments (Supplementary Table 1) includes the rates of pH decrease spanning an order of magnitude (0.01–0.24 min−1; Fig. 2d) and the measurements of droplet sizes ranging from 3.4 to 14 μm (Fig. 2f). We focus our analysis on droplets with radii greater than 3.4 μm because the number of pixels in smaller droplets is insufficient to reliably detect vacuole formation (or angular asymmetry). Importantly, the results show that vacuoles form at different pH values depending on both droplet size and the rate of pH change (Fig. 2h).
Droplet size and rate of pH change govern vacuole onset
Our results show that the onset of vacuole formation (characterized by pHv) is a function of droplet size and the rate of pH change (Fig. 3). The data show that both larger droplets and faster pH changes lead to vacuole formation at higher pH values. These monotonic relationships are further supported by the regression analysis (Supplementary Note 4). Variation in experimental conditions across individual capillary experiments enables the observation of coacervate droplets across a range of droplet sizes and exposed to varying rates of pH change (Supplementary Table 1).

a, Representative microscopy images of a large (11 μm; top) and small (7 μm; bottom) droplet over time as the pH decreases at the same rate. The larger droplet forms vacuoles at a higher pH. b, Representative microscopy images of droplets of similar size over time as the pH decreases at a fast (0.17 min−1; top) or slow (0.05 min−1; bottom) rate. Vacuoles form depending on the rate of pH change, where a faster change leads to vacuole formation at a higher pH. Scale bars, 5 µm (a,b). c, pH of vacuole formation depends on both droplet radius and rate of pH change. d, pH of vacuole formation increases with the droplet radius within a given range of rates. e, pH of vacuole formation increases with the rate of pH change across a range of droplet radii. Data points represent droplets from a single capillary experiment in c–e. Trend lines were created by linear regression to a parabolic surface.
Using the capillary setup, imaging within a single field of view allows the simultaneous monitoring of tens of droplets of varying sizes, all experiencing similar rates of pH change (Fig. 3d). Among coacervate drops subject to identical pH changes, larger drops form vacuoles at higher pH values than smaller droplets. For example, Fig. 3a compares the change in morphology of two droplets of different sizes subjected to the same rate of pH decrease, from pH 9.4 to 8.3, over approximately 15 min. Although the larger droplet forms vacuoles at pH 8.5, the smaller droplet does not form vacuoles until pH 8.3 (Supplementary Video 1).
The emergence of vacuoles also depends on the rate of pH change (Fig. 3b). Imaging at different distances from the gel front allows droplets exposed to different rates of pH change to be imaged in a single experiment (Fig. 3e). When controlling for droplet size, faster rates of pH decrease result in vacuole formation at a higher pH. Comparing two droplets of the same size (9.4 μm at pH 9.0), we see that the droplet subjected to a faster rate of pH decrease (rate, 0.17 min−1) exhibits the first signs of vacuole formation at pH 8.2 (Fig. 3b). By contrast, a droplet subject to a slower pH decrease (rate, 0.05 min−1) does not form vacuoles until the surrounding pH reaches 7.6 (Supplementary Video 2).
Imaging droplets of varying sizes at increasing distances from the acid source can capture both these dependencies in a single capillary experiment, demonstrating that pHv depends on both droplet size and the rate of pH change (Fig. 3c). In addition to vacuole formation, we observed that droplet shrinking before vacuole formation is also size and rate dependent (Supplementary Fig. 11). We hypothesize that this shrinking may be due to the efflux of water and biomolecules as the droplet composition changes in response to the external pH change. We compare the decrease in droplet size among droplets of varying sizes exposed to similar rates of pH decrease. We observe that larger droplets shrink to a lesser extent than smaller droplets when subjected to the same change in pH at the same rate. Similarly, the shrinking of coacervate drops of similar sizes depends on the rate of pH decrease. For a given pH change, coacervate drops exposed to slower rates of pH change shrink more than coacervate drops of similar sizes exposed to faster rates of pH decrease. These observations imply that vacuole formation and the preceding reduction in drop size are non-equilibrium processes. At slower rates of pH decrease or within smaller droplets, the droplet composition and size relax to their equilibrium values via polyion diffusion and exchange with the surrounding medium. By contrast, for faster perturbations or larger droplets, the comparatively slow relaxation of the droplet composition and size leads to non-equilibrium conditions, which can trigger instabilities resulting in vacuole formation.
Vacuoles form when pH changes faster than polyion relaxation
Our results indicate that the emergence of vacuoles in coacervate drops exposed to a pH decrease occurs when the exchange of components between the two phases becomes diffusion limited. At a constant enzyme–polymer ratio within the capillary (3:1 enzyme–polymer ratio), the equilibrium composition of each phase depends on the pH. Initially homogeneous at pH 10, the droplets respond to a transient pH decrease by transferring polyions into or out of the droplet phase in an attempt to equilibrate with the changing conditions. Our experimental results suggest that the timescale for the diffusion of polyions between the two phases is often slow compared with the rate of pH decrease under these conditions. To validate this hypothesis, we performed fluorescence recovery after photobleaching (FRAP) measurements to evaluate the mobility of the cationic polymer within the condensate.
FRAP experiments show that the timescale of polymer diffusion on the droplet scale (~10 μm) is similar to that of pH changes triggering vacuole formation (Fig. 4a). By bleaching a portion of a droplet containing a fluorescein-isothiocyanate-labeled polycation, we subsequently observe the transport of the polycation into the bleached region. The fluorescence recovery is fit to a biexponential function with two time constants corresponding to polycation diffusion and/or its dissociation from the network42,43. The measured recovery time (12 min) is similar to the timescales of pH changes leading to vacuole formation (4–90 min). We note that the measured relaxation time probably underestimates the true value, as the fluorescently labeled polymer monitored in these experiments had a lower molecular weight (70 kDa) than the polymer used to form coacervates (500 kDa).

a, FRAP experiments on coacervate drops show the recovery of the bleached polymer over 30 min. Confocal images of the bleached coacervate drop containing unlabeled enzyme and fluorescein-isothiocyanate-labeled DEAE-dextran at 0.76 mass fraction of glucose oxidase in 10-mM Tris buffer at pH 9 supplemented with 20-mM NaCl (total macromolecular concentration, 1 mg ml−1). Scale bars, 10 μm. Biexponential fit (solid line) to the normalized recovery curves of five bleached droplets (n = 5 technical replicates). The shaded region represents ±1 standard deviation from the mean intensity. The longer timescale for recovery (τ) of the bleached component was determined using a biexponential fit. Error bars indicate ±1 standard deviation. The diameter of the bleached region is 1 μm. b, Experimental data for 276 droplets showing vacuole formation (open markers) or uniform interiors (solid markers) as a function of droplet size and the rate of pH change. Vacuoles do not form in droplets if the rate of pH change is sufficiently slow and the droplets are sufficiently small. c, Simulation data for droplets of various sizes subject to different rates of pH change. The horizontal line (dashed) represents the constant spinodal decomposition rate, whereas the inclined line (solid) denotes the slow relaxation rate, with a 1/(reduced radius)2 dependence. Their intersection (vertical dotted line) defines the critical radius, below which the slowest relaxation rate surpasses the spinodal decomposition rate, preventing vacuole formation. Non-equilibrium compositions occur only when the rate of pH change surpasses the slowest relaxation rate. The green-shaded region indicates the predicted vacuole formation region based on scaling analysis, whereas markers represent the actual simulation data. The solid black line in b corresponds to the same theoretical boundary as in c, distinguishing droplets that form vacuoles from those that remain homogeneous. d, Ternary phase diagrams at pH 10 and pH 8 as predicted by the model with trajectories for quasistatic (left) and instantaneous (right) pH changes, showing that fast rates of pH change result in trajectories that enter the spinodal region. Images from two-dimensional simulations following an instantaneous pH change from pH 10 (top) to pH 8 (bottom) show the change in droplet composition and the formation of vacuoles.
The above results suggest that vacuoles should not form if the rate of pH change is sufficiently slow and/or the droplet is sufficiently small, as comparatively fast polymer mobility will allow for near-equilibrium compositions at all times (Fig. 4b). Further support for this conclusion comes from the analysis of coacervate drops from all capillary experiments (without any added buffer; Supplementary Table 1), in which some drops did not form vacuoles during a pH decrease from 10 to 7. These results indicate that coacervate drops can remain at or near equilibrium under relatively slow changes, thereby preventing vacuole formation.
pH changes trigger spinodal decomposition and vacuole formation
We propose that rapid changes in system conditions shift the phase boundary, driving the droplet composition into the unstable (spinodal) region and initiating vacuole formation via spinodal decomposition. This non-equilibrium mechanism explains the formation of thermodynamically unfavorable interfaces within the coacervate drop, which are energetically costly and, therefore, unexpected under equilibrium conditions.
We developed a minimal theoretical model that captures how a phase-separating system responds to changes in system conditions, particularly pH (Supplementary Note 5). The minimal model uses Flory–Huggins theory to describe a ternary mixture of polymer, enzyme and water, incorporating pH-dependent pairwise interaction parameters χij. Experimental measurements inform the estimation of these parameters, revealing a binodal region that expands with decreasing pH (Fig. 4d).
Tie lines at pH 10 and pH 8 (shown as straight blue and green lines, respectively), intersect at a common point (marked in red) that indicates the overall volume fraction of polymer and enzyme (Fig. 4d). A mixture prepared at this overall composition separates into macromolecule-rich and macromolecule-lean phases, situated on opposite sides of the tie line at equilibrium. With a “quasistatic” pH change from 10 to 8, the system remains on the binodal curve, leading to homogeneous droplets without vacuoles.
To describe how fast pH changes induce vacuole formation, we use the Cahn–Hilliard model to describe the spatiotemporal evolution of the polymer–enzyme–water system (Supplementary Note 6). Changes in the pH shift the phase diagram and drive the system to reorganize its composition and relax to the new equilibrium state. The model shows two modes of relaxation with diffusivity Dslow and Dfast (Supplementary Note 6). The fast mode pulls the local composition toward the tie line at a characteristic rate Dfast(π/R)2, whereas the slow mode moves the system along the tie line toward the binodal at rate Dslow(π/R)2. Here R is the radius of the droplet subject to the pH change. A pH change faster than the slow relaxation rate will drive the system into a non-equilibrium state. Under an “instantaneous” pH change, separation in timescales between these two modes causes the dense-phase composition to relax along a two-part trajectory with a characteristic “elbow” (Fig. 4d).
This two-step relaxation trajectory can bring the system into the spinodal region, where the spinodal instability grows at a rate λ*. If λ* is greater than the slow rate Dslow(π/R)2, then vacuoles form before the system moves out of the spinodal region. Since the slow rate scales with 1/R2 and λ* is not a function of R, larger droplets are more prone to vacuole formation because they remain in the unstable region longer than the smaller droplets. These scaling arguments suggest that droplets with larger radii subject to fast pH changes should form vacuoles, in qualitative agreement with our experiments (Fig. 4b,c).
We solve the model numerically for a range of droplet sizes and rates of pH change to map out the dependence of vacuole formation on these two parameters. We simulate a droplet of radius R subject to a logistic pH profile that transitions from an initial pH 10 to a final pH 8 with a characteristic rate r. Snapshots of the initial and final conditions for one such simulation show the formation of vacuoles within an originally homogeneous drop (Fig. 4d and Supplementary Video 3). To facilitate a comparison with experiments, we introduce two dimensionless quantities: the reduced rate, defined as (r/[{D}_{{rm{slow}}}{(uppi /ell )}^{2}]), and the reduced radius, defined as R/ℓ, where ℓ represents the thickness of the droplet interface. The model predicts a clear boundary in parameter space separating the droplets that form vacuoles from those that remain homogeneous with a slope that reflects the 1/R2 dependence of the slow diffusive mode (Fig. 4c).
Simulation results show that, beyond a critical droplet radius, an increase in the rate of pH change promotes vacuole formation, whereas slower pH changes result in uniform droplets (Fig. 4c). To connect the simulation results with the experiments, we approximate the interfacial thickness by the size of the enzyme (ℓ ≈ 10 nm) and scale the droplet radius by this value (Supplementary Note 7). Similarly, we estimate Dslow from the FRAP timescale (τ) and the size of the bleached spot. These order-of-magnitude estimates align the simulation results with the experimental data (Fig. 4b), thereby demonstrating the model’s ability to reproduce both qualitative and quantitative features of vacuole formation across a range of droplet sizes and rates of pH change. In particular, the solid black lines in Fig. 4b,c represent the same theoretical boundary, with the experimental data in Fig. 4b presented on a linear scale and the simulation results in Fig. 4c, on a logarithmic scale.
pH-induced vacuole formation occurs in other complex coacervates
To test the generality of vacuole formation in response to pH changes, we evaluated three complementary complex coacervate systems (Supplementary Note 8). First, we tested enzyme–polymer coacervates using DEAE-dextran of lower molecular weights (70 and 150 kDa). Consistent with predictions from our thermodynamic model, the 70-kDa polymer did not form coacervates (Supplementary Figs. 20 and 21), whereas the 150-kDa polymer formed coacervates and produced vacuoles on rapid pH decrease from 10 to 7. Compared with the 500-kDa system above, the lower-molecular-weight coacervate required faster pH changes to form vacuoles, probably due to enhanced polymer mobility (Extended Data Fig. 2). Second, we replaced glucose oxidase with a similarly charged but lower-molecular-weight protein, an anionic GFP variant (GFP(–)), and again observed the size- and rate-dependent vacuole formation44. Finally, we used a biologically inspired system of RNA and a cationic protein (GFP(+))37. Starting from coacervates at pH 8, we rapidly increased the pH to 10 and again observed the size- and rate-dependent vacuole formation. Together, these results show that complex coacervates containing at least one weak polyelectrolyte can form vacuoles in response to rapid pH changes.
Rapid changes are necessary to achieve non-equilibrium compositions within condensates; however, such compositions alone are insufficient to guarantee vacuole formation (Supplementary Note 9). The composition of the dense phase must enter the spinodal (or binodal) region of the phase diagram at the new pH value to allow spinodal decomposition (or nucleation and growth). In our model, this condition is satisfied for a rapid pH decrease from 10 to 8 but not for a corresponding pH increase from 8 to 10 (Extended Data Fig. 3). More generally, the model suggests that vacuole formation by spinodal decomposition (or nucleation and growth) is most favorable when the charge density ratio—as approximated by the polymer charge per mass divided by the enzyme charge per mass (α = ρp/ρe ≈ QpMe/QeMp)—changes from near one at the initial condition (αinitial ≈ 1) to larger or smaller values at the final condition (αfinal ≪ 1 or αfinal ≫ 1). Along the tie line, which is well approximated by the charge neutrality condition ϕe/ϕp = α, the macromolecule concentration of the dense phase increases as α deviates from unity, thereby increasing the size of the spinodal/binodal regions and promoting vacuole formation. This prediction of the model is supported by experiments on enzyme–polymer condensates subject to a pH increase from 8 to 10 (αinitial ≈ 3.1 to αfinal ≈ 1.1), which do not form vacuoles even in large droplets (~7.06 μm) and at fast rates (~0.25 min−1; Extended Data Fig. 3d).
Discussion
Our results indicate that vacuole formation in complex coacervate droplets is a non-equilibrium process caused by the diffusion-limited exchange of polyions between the phases during rapid pH changes. A qualitative model supports these experimental findings, suggesting that the mechanism of vacuole formation is spinodal decomposition. Vacuoles form when the coacervate system enters the unstable region and the instability growth is faster than the rate of diffusive relaxation to the new equilibrium composition.
We show how a droplet subject to a pH change relaxes to the new equilibrium via a two-step process comprising fast and slow modes of relaxation. The fast mode pulls the local composition toward the tie line at which the enzyme–polymer ratio remains approximately constant, indicating complexation between the enzyme and polymer. The slow mode moves the system along the tie line toward the binodal, capturing the collective diffusion of the enzyme–polymer complex and ensuring that the dense phase attains the equilibrium density. The thermodynamic force driving complexation is stronger than that driving drop densification. Both rates scale with 1/R2, so the larger droplets relax more slowly. Another prediction of the model is that sufficiently small droplets ((Rll uppi sqrt{{D}_{{rm{slow}}}/{lambda }^{* }})) never form vacuoles, regardless of the rate of pH change because the slow mode of relaxation is still faster than the rate of instability λ*. Although we could not validate this result experimentally, a similar finding was recently reported with a droplet size threshold for vacuole formation in aging condensates formed between Dhh1-mCherry and polyU RNA45.
Our model provides a framework for understanding vacuole formation in out-of-equilibrium associative phase-separated systems. Although the minimal model recapitulates vacuole formation seen in experiments, some experimental observations are not fully explained. In particular, our experiments suggest that vacuole formation is followed by rapid and often extreme droplet swelling, which we attribute to solvent flows driven by osmotic pressure differences. Such behavior is not predicted by the model, which considers only diffusive transport in an incompressible mixture. Future models will need additional balance equations that capture fluid mechanics and drop viscoelasticity. These factors influence solute transport through convective flow and also respond to osmotic and capillary pressure gradients. Despite its limitations, the simple model we present here provides a useful guide for understanding the onset of vacuole formation in associative condensates.
Our capillary experimental setup, incorporating a colorimetric pH analysis method and detailed droplet characterization, offers a robust approach for studying vacuole dynamics in similar coacervate or condensate systems. Using this setup, we demonstrate that vacuole formation regularly occurs in response to a rapid pH change that results in greater differences in the charge densities of the polymers. Our finding on the importance of the ratio of charge densities is further supported by a recent experimental demonstration that charge density mismatch drives multiphase behavior in complex coacervates46.
In vitro control of condensate structure under non-equilibrium conditions provides insights into how cells may actively regulate the structure of multiphase endogenous condensates. In particular, the incorporation of an active enzyme offers the additional benefit of investigating vacuole formation within condensates driven by active processes, mimicking mechanisms observed in vivo9. Beyond potential insights into biology, designer condensates with tunable internal structures have broader applications in synthetic biology24,28,47.
Methods
Passivation of imaging surfaces
Capillary surfaces were passivated with PEG to prevent interactions with the coacervate drops48. Capillaries were immersed in a 2-M NaOH solution for 30 min. They were then placed in 2% (by volume) Hellmanex (Sigma-Aldrich, product number Z805939) solution in water and sonicated in a water bath for 10 min. The capillaries were rinsed with MilliQ water before submerging in ethanol and sonication in a water bath for 10 min. A fresh 5 mg ml−1 solution of mPEG-silane (Mw, 5,000; Laysan Bio) in ethanol with 1% acetic acid was prepared by sonication in a water bath. Each capillary was filled with the mPEG-silane solution and placed on a hotplate at 70 °C for 1 h. During this time, the capillaries were refilled with the mPEG-silane solution approximately every 15 min. PEGylation of CultureWell chambers (Grace Bio-Labs, product number 112359) was carried out in a similar way with 200 μl of mPEG-silane solution being added to each well at an interval of 30 min.
Capillary experiments
A glucose oxidase solution (1 mg ml−1) in water with 20-mM NaCl was prepared by dissolving the enzyme in MilliQ water and adjusting to pH > 8 with the addition of NaOH. The required amount of 5-M NaCl solution in water was added to the enzyme solution to bring the final salt concentration to 20 mM, followed by filtration with 0.2-μm surfactant-free cellulose acetate or polyethersulfone syringe filters. A solution of 500-kDa DEAE-dextran (1 mg ml−1) in water containing 20-mM NaCl was prepared in a similar way. Then, 20 mg ml−1 of Xylenol Blue (Millipore Sigma 205486) solution in dimethyl sulfoxide was prepared by adding a weighed amount of Xylenol Blue to dimethyl sulfoxide and filtering the solution with a nylon filter. To each of the enzyme and polymer solutions, the required volume of 20 mg ml−1 of Xylenol Blue solution was added such that the final concentration of Xylenol Blue in each solution was 0.2 mg ml−1. The pH of each solution was adjusted to 10 with 1-M NaOH and 1-M HCl using an InLab Pure Pro-ISM pH electrode. A 1- ml coacervate solution at 0.76 mass fraction of glucose oxidase was prepared by adding 0.76 ml of the glucose oxidase solution and 0.24 ml of the DEAE-dextran solution to a 1.7-ml tube and mixed by pipetting.
To prepare the gel loaded with acid, a 1% agarose solution in water (200 mg of agarose to 19.8 ml of MilliQ water) was heated in a microwave for 30 s. To the hot solution, 200 μl of 20 mg ml−1 of Xylenol Blue in dimethyl sulfoxide and 20 μl of 1-M HCl were added and mixed. A fixed amount of the hot liquid was pipetted onto a hydrophobic surface (plastic Petri dish) and added to one end of the capillary tube by capillary action.
After waiting for a few minutes for the gel to solidify, the coacervate solution prepared as described above was added to the capillary tube using a syringe. The capillary was then secured to a microscopy slide on both ends using double-sided tape or a combination of hot glue and 5-min epoxy. Time-lapse images at different distances from the gel interface were taken using a complementary metal–oxide–semiconductor camera on the bright-field channel in an EVOS FL Auto 2 inverted fluorescent microscope. For experiments with the buffer, glucose oxidase and DEAE-dextran solutions were prepared in a 10-mM sodium carbonate–bicarbonate buffer at pH 10. The gel length was varied between 4 and 6 mm to achieve different rates of pH change.
Additional methods
Supplementary Note 10 provides additional details on confocal imaging, FRAP experiments and composition analysis.
Modeling the dynamics of vacuole formation
We model the phase diagram using the Flory–Huggins theory for a ternary mixture of polymer (p), enzyme (e) and water (w), incorporating pH-dependent interaction parameters χij. The free energy density (scaled by the thermal energy kBT) is
$$begin{array}{rcl}tilde{f}({phi }_{{rm{p}}},{phi }_{{rm{e}}})&=&frac{{phi }_{{rm{p}}}}{{N}_{{rm{p}}}}ln [{phi }_{{rm{p}}}]+frac{{phi }_{{rm{e}}}}{{N}_{{rm{e}}}}ln [{phi }_{{rm{e}}}]+(1-{phi }_{{rm{p}}}-{phi }_{{rm{e}}})ln left[1-{phi }_{{rm{p}}}-{phi }_{{rm{e}}}right]\ &&+{chi }_{{rm{p}}{rm{e}}}{phi }_{{rm{p}}}{phi }_{{rm{e}}}+{chi }_{{rm{p}}{rm{w}}}{phi }_{{rm{p}}}(1-{phi }_{{rm{p}}}-{phi }_{{rm{e}}})+{chi }_{{rm{e}}{rm{w}}}{phi }_{{rm{e}}}(1-{phi }_{{rm{p}}}-{phi }_{{rm{e}}})end{array},$$
(1)
where ϕi is the volume fraction of species i = p, e, w such that ∑iϕi = 1, Ni is the number of monomers in each species i, ν is the volume per lattice site and χij are the binary interaction parameters. The interaction parameters χij are related to the pairwise interaction energies uij between components i and j as χij = z(2uij − uii − ujj)/(2kBT), where z is the coordination number of the lattice.
Experiments suggest that the charge ratio between polymer and enzyme increases monotonically with decreasing pH. To describe electrostatic interactions among the species, the binary interaction parameters χij are modeled as second-order functions of the charge densities ρi and ρj (Supplementary Note 5).
To incorporate the kinetics of phase separation, we use the Cahn–Hilliard approach49 to describe the total free energy as
$$F=frac{{k}_{{rm{B}}}T}{nu }{int}_{V}left[tilde{f}-mathop{sum }limits_{ine j}{kappa }_{ij}(nabla {phi }_{i}cdot nabla {phi }_{j})right]{rm{d}}V,$$
(2)
where (tilde{f}) is given by equation (1), and the indices i, j take the values p, e and w corresponding to polymer, enzyme and water, respectively. The parameters κij control the energy and width of the interface between the dense and dilute phases.
The local conservation of species i implies that its concentration, ci = ϕi/ν, evolves as
$$frac{partial {c}_{i}}{partial t}+nabla cdot {{bf{J}}}_{i}=0,$$
(3)
where Ji are diffusive fluxes given by Ji = −∑jMij∇μj and μi = δF/δci are chemical potentials. The mobility coefficients Mij depend on the local composition as approximated by a scaling ansatz50 that ensures the expected asymptotic behavior under dilute conditions.
Within the bulk phase, the dynamic equations can be linearized about the homogeneous compositions (({phi }_{{rm{p}}}^{{rm{o}}},{phi }_{{rm{e}}}^{{rm{o}}})). The linearized dynamics of the conserved field (ϕp, ϕe) is governed by
$$frac{partial }{partial t}left(begin{array}{r}{phi }_{{rm{p}}}\ {phi }_{{rm{e}}}end{array}right)=left(begin{array}{rc}{D}_{{rm{p}}{rm{p}}}^{{rm{o}}}&{D}_{{rm{p}}{rm{e}}}^{{rm{o}}}\ {D}_{{rm{e}}{rm{p}}}^{{rm{o}}}&{D}_{{rm{e}}{rm{e}}}^{{rm{o}}}end{array}right)left(begin{array}{r}{nabla }^{2}{phi }_{{rm{p}}}\ {nabla }^{2}{phi }_{{rm{e}}}end{array}right)-left(begin{array}{rc}{K}_{{rm{p}}{rm{p}}}^{;{rm{o}}}&{K}_{{rm{p}}{rm{e}}}^{;{rm{o}}}\ {K}_{{rm{e}}{rm{p}}}^{;{rm{o}}}&{K}_{{rm{e}}{rm{e}}}^{;{rm{o}}}end{array}right)left(begin{array}{r}{nabla }^{4}{phi }_{{rm{p}}}\ {nabla }^{4}{phi }_{{rm{e}}}end{array}right),$$
(4)
where the components of the diffusivity matrix D are given by the matrix product
$${bf{D}}({phi }_{{rm{p}}}^{{rm{o}}},{phi }_{{rm{e}}}^{{rm{o}}})=left(begin{array}{rc}{D}_{{rm{p}}{rm{p}}}^{{rm{o}}}&{D}_{{rm{p}}{rm{e}}}^{{rm{o}}}\ {D}_{{rm{e}}{rm{p}}}^{{rm{o}}}&{D}_{{rm{e}}{rm{e}}}^{{rm{o}}}end{array}right)={bf{M}}({phi }_{{rm{p}}}^{{rm{o}}},{phi }_{{rm{e}}}^{{rm{o}}})cdot {{bf{f}}}^{;(2)}({phi }_{{rm{p}}}^{{rm{o}}},{phi }_{{rm{e}}}^{{rm{o}}}),$$
(5)
where ({bf{M}}({phi }_{{rm{p}}}^{{rm{o}}},{phi }_{{rm{e}}}^{{rm{o}}})) is the mobility matrix and ({{bf{f}}}^{(2)}({phi }_{{rm{p}}}^{{rm{o}}},{phi }_{{rm{e}}}^{{rm{o}}})) is the matrix of the second derivatives of free energy. Similarly, the coefficients of the K matrix are given by the matrix product
$${bf{K}}({phi }_{{rm{p}}}^{{rm{o}}},{phi }_{{rm{e}}}^{{rm{o}}})=left(begin{array}{rc}{K}_{{rm{p}}{rm{p}}}^{;{rm{o}}}&{K}_{{rm{p}}{rm{e}}}^{;{rm{o}}}\ {K}_{{rm{e}}{rm{p}}}^{;{rm{o}}}&{K}_{{rm{e}}{rm{e}}}^{;{rm{o}}}end{array}right)={bf{M}}({phi }_{{rm{p}}}^{{rm{o}}},{phi }_{{rm{e}}}^{{rm{o}}})cdot left(begin{array}{cc}2{kappa }_{{rm{p}}{rm{w}}}&{kappa }_{{rm{p}}{rm{w}}}+{kappa }_{{rm{e}}{rm{w}}}-{kappa }_{{rm{p}}{rm{e}}}\ {kappa }_{{rm{p}}{rm{w}}}+{kappa }_{{rm{e}}{rm{w}}}-{kappa }_{{rm{p}}{rm{e}}}&2{kappa }_{{rm{e}}{rm{w}}}end{array}right).$$
(6)
In particular, the diffusion matrix D has two approximately orthogonal eigenvectors (e1, e2) with one vector parallel to the tie lines. The first eigenvector e1, which is along the tie lines, corresponds to “slow” transport with diffusivity Dslow. The second eigenvector e2, which is approximately orthogonal to the tie lines, corresponds to “fast” transport with diffusivity Dfast.
The model is solved numerically in one dimension and two dimensions using a semi-implicit time-integration scheme51,52,53. The simulations start with a well-equilibrated uniform droplet at pH 10 in a periodic domain that is then subject to a logistic pH profile between pH 10 and pH 8. The imposed pH change is characterized by a single rate parameter r.
Data availability
Data generated as part of this study are available within the article and its Supplementary Information. The raw microscopy images are available via figshare at https://doi.org/10.6084/m9.figshare.28752170 (ref. 54). Source data are provided with this paper.
Code availability
The simulation and data analysis codes used in this study are available via GitHub at https://github.com/bishopgroup/Vacuoles.
References
-
Banani, S. F., Lee, H. O., Hyman, A. A. & Rosen, M. K. Biomolecular condensates: organizers of cellular biochemistry. Nat. Rev. Mol. Cell Biol. 18, 285–298 (2017).
-
Lyon, A. S., Peeples, W. B. & Rosen, M. K. A framework for understanding the functions of biomolecular condensates across scales. Nat. Rev. Mol. Cell Biol. 22, 215–235 (2021).
-
Fare, C. M., Villani, A., Drake, L. E. & Shorter, J. Higher-order organization of biomolecular condensates. Open Biol. 11, 210137 (2021).
-
Feric, M. et al. Coexisting liquid phases underlie nucleolar subcompartments. Cell 165, 1686–1697 (2016).
-
Lafontaine, D. L. J., Riback, J. A., Bascetin, R. & Brangwynne, C. P. The nucleolus as a multiphase liquid condensate. Nat. Rev. Mol. Cell Biol. 22, 165–182 (2021).
-
Pitchiaya, S. et al. Dynamic recruitment of single RNAs to processing bodies depends on RNA functionality. Mol. Cell 74, 521–533.e6 (2019).
-
Wheeler, J. R. et al. Distinct stages in stress granule assembly and disassembly. eLife 5, e18413 (2016).
-
Kistler, K. E. et al. Phase transitioned nuclear oskar promotes cell division of Drosophila primordial germ cells. eLife 7, e37949 (2018).
-
Xu, D. et al. rRNA intermediates coordinate the formation of nucleolar vacuoles in C. elegans. Cell Rep. 42, 112915 (2023).
-
Schmidt, H. B. & Rohatgi, R. In vivo formation of vacuolated multi-phase compartments lacking membranes. Cell Rep. 16, 1228–1236 (2016).
-
Nakashima, K. K., Vibhute, M. A. & Spruijt, E. Biomolecular chemistry in liquid phase separated compartments. Front. Mol. Biosci. 6, 21 (2019).
-
Zwicker, D., Decker, M., Jaensch, S., Hyman, A. A. & Jülicher, F. Centrosomes are autocatalytic droplets of pericentriolar material organized by centrioles. Proc. Natl Acad. Sci. USA 111, E2636–E2645 (2014).
-
Yewdall, N. A., André, A. A., Lu, T. & Spruijt, E. Coacervates as models of membraneless organelles. Curr. Opin. Colloid Interface Sci. 52, 101416 (2021).
-
Modi, N. et al. Designing negative feedback loops in enzymatic coacervate droplets. Chem. Sci. 14, 4735–4744 (2023).
-
Lu, T. & Spruijt, E. Multiphase complex coacervate droplets. J. Am. Chem. Soc. 142, 2905–2914 (2020).
-
Mountain, G. A. & Keating, C. D. Formation of multiphase complex coacervates and partitioning of biomolecules within them. Biomacromolecules 21, 630–640 (2020).
-
Alshareedah, I., Moosa, M. M., Raju, M., Potoyan, D. A. & Banerjee, P. R. Phase transition of RNA–protein complexes into ordered hollow condensates. Proc. Natl Acad. Sci. USA 117, 15650–15658 (2020).
-
Banerjee, P. R., Milin, A. N., Moosa, M. M., Onuchic, P. L. & Deniz, A. A. Reentrant phase transition drives dynamic substructure formation in ribonucleoprotein droplets. Angew. Chem. Int. Ed. 56, 11354–11359 (2017).
-
Weber, C. A., Zwicker, D., Jülicher, F. & Lee, C. F. Physics of active emulsions. Rep. Prog. Phys. 82, 064601 (2019).
-
Bergmann, A. M. et al. Liquid spherical shells are a non-equilibrium steady state of active droplets. Nat. Commun. 14, 6552 (2023).
-
Donau, C. et al. Active coacervate droplets as a model for membraneless organelles and protocells. Nat. Commun. 11, 5167 (2020).
-
Bauermann, J., Bartolucci, G., Boekhoven, J., Weber, C. A. & Jülicher, F. Formation of liquid shells in active droplet systems. Phys. Rev. Res. 5, 043246 (2023).
-
Erkamp, N. A. et al. Spatially non-uniform condensates emerge from dynamically arrested phase separation. Nat. Commun. 14, 684 (2023).
-
Erkamp, N. A. et al. Biomolecular condensates with complex architectures via controlled nucleation. Nat. Chem. Eng 1, 430–439 (2024).
-
Chen, N., Zhao, Z., Wang, Y. & Dimova, R. Resolving the mechanisms of soy glycinin self-coacervation and hollow-condensate formation. ACS Macro Lett. 9, 1844–1852 (2020).
-
Feric, M. et al. Mesoscale structure–function relationships in mitochondrial transcriptional condensates. Proc. Natl Acad. Sci. USA 119, e2207303119 (2022).
-
Saleh, O. A., Wilken, S., Squires, T. M. & Liedl, T. Vacuole dynamics and popping-based motility in liquid droplets of DNA. Nat. Commun. 14, 3574 (2023).
-
Moreau, N. G., Martin, N., Gobbo, P., Tang, T.-Y. D. & Mann, S. Spontaneous membrane-less multi-compartmentalization via aqueous two-phase separation in complex coacervate micro-droplets. Chem. Commun. 56, 12717–12720 (2020).
-
Hofweber, M. & Dormann, D. Friend or foe—post-translational modifications as regulators of phase separation and RNP granule dynamics. J. Biol. Chem. 294, 7137–7150 (2019).
-
Monahan, Z. et al. Phosphorylation of the FUS low-complexity domain disrupts phase separation, aggregation, and toxicity. EMBO J. 36, 2951–2967 (2017).
-
Tsang, B. et al. Phosphoregulated FMRP phase separation models activity-dependent translation through bidirectional control of mRNA granule formation. Proc. Natl Acad. Sci. USA 116, 4218–4227 (2019).
-
King, M. R. et al. Macromolecular condensation organizes nucleolar sub-phases to set up a pH gradient. Cell 187, 1889–1906.e24 (2024).
-
Choi, S., Knoerdel, A. R., Sing, C. E. & Keating, C. D. Effect of polypeptide complex coacervate microenvironment on protonation of a guest molecule. J. Phys. Chem. B 127, 5978–5991 (2023).
-
Ausserwöger, H. et al. Biomolecular condensates sustain pH gradients at equilibrium driven by charge neutralisation. Preprint at bioRxiv https://doi.org/10.1101/2024.05.23.595321 (2024).
-
Karoui, H., Seck, M. J. & Martin, N. Self-programmed enzyme phase separation and multiphase coacervate droplet organization. Chem. Sci. 12, 2794–2802 (2021).
-
McTigue, W. C. B. & Perry, S. L. Design rules for encapsulating proteins into complex coacervates. Soft Matter 15, 3089–3103 (2019).
-
Cummings, C. S. & Obermeyer, A. C. Phase separation behavior of supercharged proteins and polyelectrolytes. Biochemistry 57, 314–323 (2018).
-
Gálfi, L. & Rácz, Z. Properties of the reaction front in an a + b → c type reaction-diffusion process. Phys. Rev. A 38, 3151–3154 (1988).
-
Vytřas, K. et al. Sulfonephthalein dyes. I. Spectrophotometric study of xylenol blue and bromoxylenol blue using colorimetric systems. Chem. Pap. 28, 252–261 (2013).
-
Kashkanova, A. D. et al. Precision single-particle localization using radial variance transform. Opt. Express 29, 11070–11083 (2021).
-
Allan, D. B., Caswell, T., Keim, N. C., van der Wel, C. M. & Verweij, R. W. soft-matter/trackpy: v0.6.4 (v0.6.4). Zenodo https://doi.org/10.5281/zenodo.12708864 (2024).
-
Sprague, B. L., Pego, R. L., Stavreva, D. A. & McNally, J. G. Analysis of binding reactions by fluorescence recovery after photobleaching. Biophys. J. 86, 3473–3495 (2004).
-
Sprague, B. L. & McNally, J. G. FRAP analysis of binding: proper and fitting. Trends Cell Biol. 15, 84–91 (2005).
-
Kapelner, R. A. & Obermeyer, A. C. Ionic polypeptide tags for protein phase separation. Chem. Sci. 10, 2700–2707 (2019).
-
Makasewicz, K. et al. Formation of multicompartment structures through aging of protein-RNA condensates. Biophys. J. 124, 115–124 (2025).
-
Agrawal, A. et al. Charge density mismatch drives demixing in multicomponent polyelectrolyte complexes. Macromolecules 58, 7776–7787 (2025).
-
Homchan, A. et al. Recombinase-controlled multiphase condensates accelerate nucleic acid amplification and CRISPR-based diagnostics. J. Am. Chem. Soc. 147, 10088–10103 (2025).
-
Lau, A. W. C., Prasad, A. & Dogic, Z. Condensation of isolated semi-flexible filaments driven by depletion interactions. Europhys. Lett. 87, 48006 (2009).
-
Cahn, J. W. & Hilliard, J. E. Free energy of a nonuniform system. I. Interfacial free energy. J. Chem. Phys. 28, 258–267 (1958).
-
Hubatsch, L. et al. Quantitative theory for the diffusive dynamics of liquid condensates. eLife 10, e68620 (2021).
-
Zhu, J., Chen, L.-Q., Shen, J. & Tikare, V. Coarsening kinetics from a variable-mobility Cahn-Hilliard equation: application of a semi-implicit Fourier spectral method. Phys. Rev. E 60, 3564 (1999).
-
Sabrina, S., Spellings, M., Glotzer, S. C. & Bishop, K. J. Coarsening dynamics of binary liquids with active rotation. Soft Matter 11, 8409–8416 (2015).
-
Mao, S., Kuldinow, D., Haataja, M. P. & Košmrlj, A. Phase behavior and morphology of multicomponent liquid mixtures. Soft Matter 15, 1297–1311 (2019).
-
Modi, N. et al. Transient pH changes drive vacuole formation in enzyme-polymer condensates. figshare https://doi.org/10.6084/m9.figshare.28752170 (2025).
Acknowledgements
This work was supported by grants from the National Science Foundation (NSF), National Institutes of Health (NIH) and Columbia Engineering. N.M. received support from the NIH National Institute of General Medical Sciences under award number R35GM138378. A.C.O. and K.J.M.B. received support from the NSF Division of Materials Research (DMR) under award number 2425337. J.L. received support from the NSF under award number 1848388. R.N. received support from a SEAS Interdisciplinary Research Seed (SIRS) grant from Columbia Engineering.
Ethics declarations
Competing interests
The authors declare no competing interests.
Peer review
Peer review information
Nature Chemical Engineering thanks Job Boekhoven and the other, anonymous, reviewer(s) for their contribution to the peer review of this work.
Additional information
Publisher’s note Springer Nature remains neutral with regard to jurisdictional claims in published maps and institutional affiliations.
Extended data
Extended Data Fig. 1 Comparison between theory and experimental data.
(a) Image showing the size of the bleached spot used to estimate the slow diffusivity in the experimental system. (b) Experimental data in real units. (c) Phase diagram in reduced rate and reduced radius space, displaying results from numerical simulations (circular markers) and experimental data (triangular markers). The shaded region represents the theoretical phase space where droplets undergo vacuole formation, as determined from scaling analysis. The solid black line indicates the slowest diffusive relaxation rate, the dashed line marks the spinodal growth rate, and the dotted vertical line denotes their intersection, corresponding to the critical radius.
Extended Data Fig. 2 Changes in pH induce vacuole formation in other complex coacervates.
(a) pH trajectories for three complex coacervate systems. The selected trajectories include the largest and smallest droplet in the system, along with the fastest and slowest pH change. For DEAE150 and GOx system the trajectory with the fastest rate of pH change is the same as the largest droplet. (b) Vacuole formation in the three systems depend on the rate of pH change and the radius as shown in the phase diagrams that differentiate droplets that remain uniform from those that form vacuoles. Data points marked with an asterisk are shown in c. (c) Images of representative vacuole-forming droplets over time. Scale bar is 10 μm. Coacervates of DEAE150 and GOx were mixed at a mass fraction of 0.76 GOx at pH 10 in 10 mM sodium carbonate-bicarbonate, coacervates of GFP(-) and DEAE500 were mixed at a mass fraction of 0.5 GFP(-) at pH 10 in 10 mM sodium carbonate-bicarbonate, and coacervates of GFP(+) and RNA were mixed at a mass fraction of 0.7 GFP(+) at pH 8 and 130 mM NaCl in 10 mM Tris. An agarose gel containing 0.02 M of HCl or NaOH was prepared as described in the Methods section.
Extended Data Fig. 3 Simulation and experiment show the reverse pH change does not result in vacuole formation.
(a) Equilibrium phase diagrams at pH 8 and 10 for the model presented in Figure 4 of the main text. The red curve shows the two-step relaxation of the dense phase composition for a pH decrease from 10 to 8; the blue curve shows the two-step relaxation for a pH increase from 8 to 10. (b) 1D simulations of an instantaneous pH increase showing no vacuole formation; the results of an instantaneous pH decrease are shown in Figs. S19a and S19b. The box size is L=8192; the volume fraction of the dense phase is γ= 0.0544 at pH 8 and 0.0957 at pH 10. (c) pH trajectories for a fast rate of pH increase from 8 to 10. The shaded region corresponds to 1 standard deviation confidence interval. Coacervates of glucose oxidase and DEAE-dextran were prepared with 0.76 mg/mL of enzyme and 0.24 mg/mL polymer in water with 20 mM NaCl at pH 8. A 10 mM NaOH agarose gel was used. (d) Experimental data for the 104 droplets analyzed as a function of droplet size and the rate of pH change, with uniform droplets indicated by solid markers. Vacuoles do not form in droplets even if the rate of pH change is sufficiently fast and the droplets are sufficiently large.
Supplementary information
Supplementary Information
Supplementary Notes 1–11.
Supplementary Video 1
Vacuole formation in droplets with different radii experiencing similar rates of pH change. Evolution of two droplets from the capillary experiments with decreasing pH for the DEAE500-GOx system (without buffer), both subjected to similar rates of pH change but with different radii. The droplet videos are captured at 0.1 fps and the video is sped up by 50 times. Scale bar, 6 μm. The smaller droplet forms vacuoles at a later time and a lower pH.
Supplementary Video 2
Vacuole formation in droplets with similar radii experiencing different rates of pH change. Evolution of two droplets from the capillary experiments with decreasing pH for the DEAE500-GOx system (without buffer), with similar radii subjected to different rates of pH change. The droplet videos are captured at 0.1 fps and the video is sped up by 50 times. Scale bar, 6 μm. The droplet exposed to a slower pH change forms vacuoles at a lower pH.
Supplementary Video 3
Two-dimensional numerical simulation of a droplet subjected to a logistic pH decrease from 10 to 8, with a reduced rate of 288 and a reduced radius of 72.
Source data
Rights and permissions
Open Access This article is licensed under a Creative Commons Attribution-NonCommercial-NoDerivatives 4.0 International License, which permits any non-commercial use, sharing, distribution and reproduction in any medium or format, as long as you give appropriate credit to the original author(s) and the source, provide a link to the Creative Commons licence, and indicate if you modified the licensed material. You do not have permission under this licence to share adapted material derived from this article or parts of it. The images or other third party material in this article are included in the article’s Creative Commons licence, unless indicated otherwise in a credit line to the material. If material is not included in the article’s Creative Commons licence and your intended use is not permitted by statutory regulation or exceeds the permitted use, you will need to obtain permission directly from the copyright holder. To view a copy of this licence, visit http://creativecommons.org/licenses/by-nc-nd/4.0/.
About this article

Cite this article
Modi, N., Nimiwal, R., Liao, J. et al. Transient pH changes drive vacuole formation in enzyme–polymer condensates. Nat Chem Eng (2026). https://doi.org/10.1038/s44286-025-00322-7
-
Received:
-
Accepted:
-
Published:
-
Version of record:
-
DOI: https://doi.org/10.1038/s44286-025-00322-7