Introduction
Liver fibrosis is an aberrant wound-healing response to chronic liver injury, afflicting millions of people worldwide, which ultimately progresses to cirrhosis and leads to lethal clinical complications. Activated hepatic stellate cells (aHSCs) are the primary effector cells of liver fibrogenesis, driving the excessive production of extracellular matrix (ECM) in response to chronic liver damage1,2. Chimeric antigen receptor (CAR) directs immunocytes to specifically track and eradicate target cells, which has shown notable efficacy in anti-tumor and anti-fibrosis therapy. However, elimination of aHSCs and other activated fibroblasts based on CAR cell therapies has only demonstrated modest efficacy at best, as CAR immunocytes fail to resolve chronic local inflammation that drives the continuous activation of HSCs. Furthermore, existing anti-fibrotic CAR cell therapies face a severe caveat about off-target side effects due to systemic circulation of CAR cells and the non-specificity of target antigens3,4,5. Specifically eliminating pathological aHSCs synergistic with reversing inflammatory milieu is a fruitful novel therapy against liver fibrosis, yet effective strategies are unexplored.
Macrophages are considered as a central hub for maintaining liver homeostasis and act as a “double-edged sword” in liver fibrosis progression. Upon liver injury, Kupffer cells release numerous inflammatory chemokines to recruit the Ly6C high expression (Ly6Chi) bone marrow-derived macrophages (BMDMs) to the injured area6,7, where recruited BMDMs trigger the activation of quiescent hepatic stellate cells (HSCs) via secreting transforming growth factor-β (TGF-β), platelet-derived growth factor (PDGF) and other profibrotic mediators, further exacerbating fibrosis. However, during fibrosis regression, the inflammatory Ly6Chi macrophages switch to anti-inflammatory Ly6C low expression (Ly6Clo) macrophages that attenuate the secretion of inflammatory cytokines to halt fibrosis progression and increase matrix metalloproteinases (MMPs) to degrade the deposited ECM8,9,10,11. Given the pervasive infiltration of macrophages in fibrotic liver and their phenotypic plasticity, we hypothesized that in situ transforming fibrosis-benefiting macrophages to anti-inflammatory aHSCs-specific CAR-macrophages (CAR-Ms) would achieve specific elimination of aHSCs and reverse inflammatory fibrosis niche.
cGAS-STING signaling axis detects pathogenic DNA and triggers innate immune responses, and the activation of this pathway drives the polarization of macrophages toward a profibrotic phenotype in the setting of tissue damage12. In fibrotic liver tissue, STING is largely upregulated and activated by massive mitochondrial DNA (mtDNA) released from injured hepatocytes, thereby driving the release of inflammatory cytokines and the activation of HSCs13,14,15. The homeostasis of STING is tuned by TRIM13 (an E3 ubiquitin ligase) that catalyzes Lys6-linked polyubiquitination and subsequent degradation of STING, and upregulating TRIM13 pushed mtDNA-induced profibrotic macrophages to turn into the anti-inflammatory phenotype accompanied by reduced production of proinflammatory and profibrotic mediators16. Hence, we proposed that downregulating STING in macrophages by TRIM13 overexpression could ameliorate the local inflammatory milieu and present an adjuvant therapeutic strategy for CAR-Ms therapy of liver fibrosis.
Fibroblast activation protein (FAP), a type II transmembrane glycoprotein, is a classical marker of activated fibroblasts and exhibits specific expression in aHSCs throughout the progression of liver fibrosis17,18. However, FAP-positive fibroblasts/aHSCs are also the key effector cells of a normal wound-healing process. The prolonged persistence and extralesional expression of anti-FAP CAR poses a risk of tissue injury or other unintended consequences. To address this substantial problem, we leveraged the power of messenger RNA (mRNA) to develop a transient anti-fibrotic CAR-Ms locoregional engineering strategy. Externalized phosphatidylserine (PS) on the outer leaflet of apoptotic cell membrane is arguably the most emblematic “eat-me” signal for macrophages during efferocytosis and has demonstrated high potency in enhancing targeted uptake of nanomedicines by macrophages19,20. However, prior research indicated that nanoformulations containing PS showed a natural spleen enrichment property due to the negative potential generated from ionization of phosphate and carboxyl groups21,22. Here, we constructed an efferocytosis-sparked lipid nanoparticle (ESLNP) with reactive oxygen species (ROS)-responsive PS exposure property, for locoregionally in situ generation of anti-inflammatory CAR-Ms in fibrotic areas. ESLNP-engineered anti-fibrotic CAR-Ms redirected phagocytic function toward FAP-positive aHSCs and sustained an anti-inflammatory phenotype, which ultimately thwarted fibrosis progression and promoted liver reestablishment. Arguably, our work presents a potential therapeutic approach for liver fibrosis and other inflammation-based fibrosis diseases, which warrants further assessment in clinical trials.
Results
Design and characterization of efferocytosis-sparked LNP
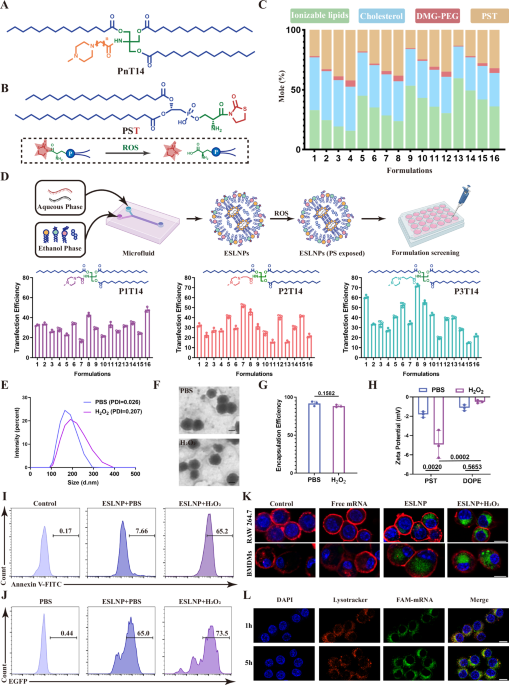
To achieve efficient delivery of mRNA drugs for exerting therapeutic activity, we first designed a class of novel ionizable lipid, termed as PnT14, which was created by reacting amine head and alkyl tails with Tris(hydroxymethyl) aminomethane (TRIS) by simple ammonolysis and esterification reactions (Fig. 1A and Supplementary Fig. S1). Their chemical structures were confirmed with 1H and 13C nuclear magnetic resonance (NMR) (Supplementary Fig. S2). We then synthesized PST (a helper lipid) by conjugating thiazolidine-2-one to PS, a key “eat me” signal displayed on the surface of apoptotic cells (Fig.1B and Supplementary Figs. S3, 4). This strategic modification endowed PS with the capability of responsive exposure in ROS-enriched fibrotic regions, thus assuring targeted delivery of mRNA drugs to fibrosis-associated macrophages and avoiding spleen enrichment caused by negative charges23. To maximize LNP potency, a series of LNPs were prepared by mixing the ethanol phase containing PnT14, PST, cholesterol, and DMG-PEG with the aqueous phase containing enhanced green fluorescent protein (EGFP) mRNA via a microfluidic device following an orthogonal experimental method (Fig. 1C and Supplementary Table S1)24. The mRNA delivery efficiency of these LNPs in macrophages was evaluated via cytometry analysis, with the optimal formulation at a molar ratio of P3T14: cholesterol: DMG-PEG: PST = 25: 35: 5: 40 (Fig. 1D).

A Chemical structure of PnT14. B Chemical structure of PST and the ROS-responsive exposure of PS. C Molar ratios of the ESLNP formulations. D ESLNP synthesis and transfection efficacy evaluation in macrophages (n = 3). Data are presented as mean ± SD. Created in BioRender. Jinxin, G. (2025) https://BioRender.com/7achsnz. E Hydrodynamic diameter of optimal ESLNPs with or without 0.1 mM H2O2 treatment. F Representative TEM images of optimal ESLNPs with or without 0.1 mM H2O2 treatment. Scale bar, 100 nm. G Encapsulation efficiency of optimal ESLNPs with or without 0.1 mM H2O2 treatment (n = 3). Data are presented as mean ± SD. Statistical significance among groups was assessed using two-tailed Student’s t test. H Zeta potential of ESLNPs and DOPE-LNPs with or without 0.1 mM H2O2 treatment (n = 3). Data are presented as mean ± SD. Statistical significance among groups was assessed using two-way ANOVA. I Flow cytometry analysis of ROS-responsive PS exposure of ESLNP with FITC-Annexin V. J Transfection efficiency of LNPs with or without 0.1 mM H2O2 treatment. K Representative CLSM images showing RAW 264.7 cells and BMDMs co-incubated with free mRNA or ESLNPs. mRNA was labeled with FAM (green), while the cell membrane and nuclei were counterstained with DiD (red) and DAPI (blue), respectively. Representative pictures from n = 3 independent replicates. Scale bar, 10 μm. L CLSM images depicting RAW 264.7 cells treated with ESLNPs for 1 h and 5 h. The cellular nuclei, endosomes, and mRNA were stained with DAPI (blue), LysoTracker Red (red), and FAM (green), respectively. Representative pictures from n = 3 independent replicates. Scale bar, 10 μm.
We further characterized the size, morphology, surface charges and mRNA delivery efficiency of the optimal LNPs in PBS and ROS-simulated environment with 0.1 mM H2O2. The H₂O₂-treated LNPs exhibited an increased average size of 207.5 nm, compared to 163.9 nm for the PBS group, with both maintaining a polydispersity index (PDI) below 0.3 and displaying a uniform spherical morphology under transmission electron microscopy (TEM) (Fig. 1E, F). The mRNA encapsulation efficiency in the H2O2 group was 88.19 ± 1.62%, which was not statistically different from that in the PBS group. (91.69 ± 3.10%) (Fig. 1G). In contrast, the zeta potential of LNPs dropped to −4.93 ± 1.45 mV in the H2O2 group compared with −1.81 ± 0.30 mV in the PBS group, while no similar trend was observed in LNPs with DOPE as a helper lipid (Fig. 1H). Further results substantiated the excellent stability in particle size, zeta potential and encapsulation efficiency of optimal LNPs (Supplementary Fig. S5). Subsequently, we quantified the PS exposure rate of ESLNPs via fluorescein isothiocyanate (FITC) conjugated-Annexin V that is specifically bound to PS. As depicted in Fig. 1I and Supplementary Fig. S6A, a remarkably increased FITC-positive proportion (60.33 ± 4.85%) was detected in the H2O2 group compared with merely 6.28 ± 1.23% in the PBS group, confirming the ROS-responsive deshielding and PS presentation of ESLNP. To explain the influence of PS exposure on mRNA delivery efficiency, we detected EGFP expression in macrophages incubated with ESLNPs in PBS or H2O2. The EGFP-positive cells percentage was 71.37 ± 2.06% in the H2O2 group, and for PBS group, the ratio was 64.80 ± 0.92% (Fig. 1J and Supplementary Fig. S6B). These data provided direct evidence that our ESLNPs specifically exposed PS under ROS stimulation, thus facilitating endocytosis by macrophages and in turn leading to increased transfection efficiency in the ROS environment.
We next utilized confocal laser scanning microscopy (CLSM) to visualize the cellular uptake and intracellular trafficking of mRNA in BMDMs and RAW 264.7 cells (Supplementary Fig. S7). As shown in Fig. 1K and Supplementary Fig. S8A, abundant carboxyfluorescein (FAM) -labeled mRNA signal was detected in the ESLNPs groups and substantial enhancement in mRNA signal intensity was achieved with the addition of H2O2, indicating the pro-internalization function of the exposed PS motif. With increased incubation time, the reduced colocalization of mRNA and lysosomes, along with wider mRNA distribution in the cytoplasm indicated the successful escape of ESLNPs from lysosomes (Fig. 1L and Supplementary Fig. S8B). Additionally, no discernible cytotoxic effect was observed on macrophages incubated with escalating doses of ESLNPs (Supplementary Fig. S9). Hence, ESLNPs demonstrated strong potential for broad application in mRNA therapeutics, offering excellent delivery efficiency and safety.
In vitro generation of anti-inflammatory aHSCs-specific CAR-Ms
We designed the sequences of TRIM13 mRNA and anti-FAP CAR mRNA that comprised the CD8α leader, hinge and transmembrane domains, the CD3ζ endodomain, the anti-FAP scFv (single-chain fragment variable) domain and a Myc-tag (Fig. 2A, Supplementary Fig. S10 and Supplementary Table S2)25. The CAR and TRIM13 expression in RAW 264.7 cells and BMDMs were assessed 12 h post-incubation with distinct formulations. As depicted in Fig. 2B and Supplementary Fig. S11 approximately 38.27 ± 1.19% of RAW 264.7 and 31.10 ± 2.51% of BMDMs were engineered with anti-FAP CAR in the CAR mRNA-laden ESLNP (C@ESLNP) group, which was further confirmed by the colocalization of Myc-labeled CAR and cell membrane in confocal images of RAW 264.7 cells treated with C@ESLNP (Fig. 2C). Western blot analysis demonstrated that TRIM13 protein was markedly upregulated in the T@ESLNP group (ESLNPs encapsulating TRIM13 mRNA), while STING protein levels and the phosphorylation of TBK1 and IRF3 were substantially reduced. In contrast, no discernible changes were observed following treatment with free TRIM13 mRNA or s@ESLNPs (ESLNP encapsulating scramble mRNA) (Fig. 2D). Moreover, TBK1 phosphorylation is reported to promote NF-κB activation, leading us to infer that TRIM13 might likewise suppress NF-κB pathway26,27. We then utilized flow cytometry to assess the expression level of IκBɑ, an essential regulator of NF-κB signaling, and found that the upregulation of TRIM13 partially rescued the downregulated IкBɑ level resulted by mtDNA, further supporting TRIM13’s inhibitory role in NF-κB pathway activation (Supplementary Fig. S12). These data provided direct evidence for the successful construction of anti-inflammatory CAR-Ms mediated by mRNA-laden LNPs.

A Schematic diagram of anti-FAP CAR protein and mRNA. B Representative flow cytometric plots depicting CAR expression in RAW 264.7 cells and BMDMs. C Representative CLSM images of RAW 264.7 cells treated with C@ESLNP. CAR, cell membrane and nuclei were labeled with anti-Myc (green), DiD (red) and DAPI (blue), respectively. Representative pictures from n = 3 independent replicates. Scale bar, 20 μm. D Representative western blot analysis of TRIM13 and STING pathway in mtDNA-pretreated BMDMs from various treatment groups. Representative pictures from n = 3 independent replicates. E, F Representative flow cytometric plots and quantitative analysis of HSCs/aHSCs phagocytosed by macrophages transfected with various formulations. Macrophages were labeled with anti-CD11b (FITC), while HSCs/aHSCs were labeled with Cell-Tracker Red CMTPX dye (n = 3). Data are presented as mean ± SD. Statistical significance among groups was assessed using two-way ANOVA. G Representative CLSM images of HSCs or aHSCs phagocytosed by macrophages or CAR-Ms. The HSCs/aHSCs were stained with pHrodo Red. Representative pictures from n = 3 independent replicates. Scale bar, 50 μm. H Representative flow cytometric plots depicting the expression of Ly6C in BMDMs treated with PBS, T@ESLNP, C@ESLNP and CT@ESLNP. I Quantitative analysis of Ly6Chi and Ly6Clo subtypes in different groups (n = 3). Data are presented as mean ± SD. Statistical significance among groups was assessed using two-way ANOVA. J Levels of TNF-α, IFN-γ, IL-6, IL-1β and TGF-β in the medium from various treatment groups detected by ELISA (n = 3). Data are presented as mean ± SD. Statistical significance among groups was assessed using one-way ANOVA.
Subsequently, we evaluated the anti-fibrotic activity of the engineered macrophages with anti-FAP CAR and TRIM13 in vitro. Beads anchored with FAP were first employed for phagocytic performance determination, and macrophages with CAR modification demonstrated enhanced phagocytosis toward FAP beads (Supplementary Fig. S13). Subsequently, we extracted the primary HSCs and established FAP-positive aHSC cell model by incubating mouse HSCs with TGF-β (10 ng/mL) for the following phagocytosis evaluation. The disparity in FAP expression between aHSCs and quiescent HSCs was verified by confocal images (Supplementary Fig. S14)17. Following a 12 h coculture of differently treated macrophages with quiescent HSCs or aHSCs, the percentages of macrophages that engulfed aHSCs in C@ESLNP and CT@ESLNP groups showed a notable elevation compared with the control group, indicating the phagocytic capacity of CAR-Ms (Fig. 2E, F). The targeting phagocytic property of CAR-Ms was also confirmed by the markedly increased fluorescence signal detected in CAR-Ms that was coincubated with aHSCs, whereas negligible fluorescence was observed in all experimental groups coculturing macrophages with quiescent HSCs (Fig. 2G). Meanwhile, we coincubated macrophages with apoptotic cells to investigate whether the PS exposure of ESLNP would affect macrophages’ normal ability to clean up apoptotic cells. Confocal imaging revealed that ESLNP had no discernable effect on macrophage phagocytosis of apoptotic cells (Supplementary Fig. S15). Accordingly, CAR modification in macrophages initiated and redirected phagocytotic activity against FAP+ aHSCs, with exhibited excellent efficacy and safety, providing support for further application of this approach for macrophage programming to eliminate fibrotic pathological cells in situ.
We next assess the phenotypic switch of macrophages after reprogramming with CAR and TRIM13. We detected Ly6C expression on BMDMs by flow cytometry and identified a change in the proportion of Ly6Chi and Ly6Clo macrophages following various treatments (Fig. 2H, I). Specifically, the percentage of Ly6Chi macrophages dropped sharply to 45.97 ± 4.13% in the T@ESLNP group compared to 81.40 ± 5.00% in the PBS group, corresponding with the Ly6Clo macrophages proportion increasing remarkably to 54.03 ± 4.13%, 3-fold higher than that in the PBS group. A similar trend was also observed in macrophages with synergistic treatment of CT@ESLNP. The cell culture medium was then collected for ELISA analysis. As shown in Fig. 2J, the levels of inflammatory factors, including TNFα, IL-1β, IFN-γ, and IL-6, revealed a noteworthy reduction after T@ESLNP and combination treatment. The secretion of TGF-β, a crucial cytokine promoting the activation of HSCs, was considerably downregulated in the T@ESLNP and combination treatment groups. We subsequently established a macrophage-fibroblast co-culture model to assess the regulatory impact of TRIM13 on macrophage inflammatory responses in the fibrotic milieu. The results showed that co-culturing led to a significant increase in the proportion of pro-inflammatory macrophages, whereas co-expression of TRIM13 downregulated this proportion, further demonstrating that TRIM13 restrains the fibrotic microenvironment-driven polarization of macrophages toward pro-inflammatory phenotype (Supplementary Fig. S16). These findings sufficiently certified that TRIM13 overexpression drove the anti-inflammatory phenotype transformation of macrophages for reprogramming the fibrosis microenvironment. Together, the ESLNP-mediated combination of TRIM13 overexpression and CAR engineering in macrophages synergistically facilitated the precise elimination of aHSCs and enhanced anti-inflammatory function, thereby arousing a more robust anti-fibrotic effect.
In vivo macrophage reprogramming mediated by systemically injected ESLNP
In fibrotic livers, injured hepatocytes release ROS and ROS-responsive drug delivery has been reported as a feasible approach to target fibrotic liver28,29. As illustrated in Fig. 3A, ESLNPs expose phosphatidylserine (PS) upon passage through ROS-enriched fibrotic regions, enabling selective binding to PS receptors on macrophages and facilitating the in situ engineering of fibrosis-associated macrophages. To evaluate the specificity and efficiency of ESLNPs for in vivo delivery, a hepatic fibrosis model was established through intraperitoneal administration of CCl4. Subsequently, three lipid nanoparticles (LNPs) were formulated with DOPE, PST, and PS as helper lipids, respectively. The systemic safety of these LNPs was assessed via a hemolytic assay. All three LNP formulations demonstrated excellent biocompatibility, showing no hemolytic risk even at concentrations far exceeding the therapeutic dose, thereby confirming the feasibility of LNP-based investigations in vivo (Supplementary Fig. S17). These LNPs encapsulating luciferase (Luci) mRNA were intravenously administrated to both CCl4-induced fibrosis mice and olive oil-treated mice that were a non-fibrotic mouse model30. Mice from different treatment groups were imaged 24 h post-dosing using the in vivo imaging system (IVIS) spectrum. As expected, both the fibrotic mice and the control mice exhibited pronounced bioluminescent signal intensity (BLI) in the liver following the injection of ESLNP and DOPE-LNP. In contrast, administration of PS-LNP resulted in a marked enrichment in the spleen, which was consistent with the prior investigations (Fig. 3B–D)22. Moreover, compared with the control mice, BLI intensity was elevated in the fibrotic mice treated with ESLNP, yet no discernable difference between two mice models following DOPE-LNP injection. Next, we administered DOPE-LNPs and ESLNPs encapsulating Myc-tagged CAR mRNA to evaluate their cellular tropisms. Flow cytometry analysis revealed that ESLNP predominantly transduced liver macrophages, accounting for 81.66 ± 2.28% of Myc-positive cells, and that the proportion presented remarkable elevations in the fibrotic mice treated with ESLNP compared to both the ESLNP-treated control mice and DOPE-LNP treatment groups (Fig. 3E, F). These data highlighted that ESLNP with the property of exposing the original structure of PS in the ROS-abundant fibrotic milieu, exhibited excellent macrophage-targeted reprogramming capacity and biocompatibility in vivo, supporting the potential for translating this platform into fibrosis treatment.

A Schematic diagram of ESLNP’s liver macrophages-targeting delivery. ESLNPs circulating to the fibrosis areas exfoliate thiazolidine-2-one upon ROS stimulation, and then PS is exposed and induces macrophage internalization via binding to phosphatidylserine receptor. Created in BioRender. Jinxin, G. (2025) https://BioRender.com/7achsnz. B IVIS images of mice 12 h post-treatment of DOPE-LNP, ESLNP and PS-LNP encapsulating Luci mRNA. C Representative images of bioluminescence signal biodistribution in isolated organs. D BLI quantitative analysis of isolated organs from olive oil mice model and CCl4 mice model (n = 3). Data are presented as mean ± SE. Statistical significance among groups was assessed using two-way ANOVA. E Representative flow cytometric plots depicting the percentage of macrophage in Myc-positive cells. F Quantitative analysis of Myc positive macrophage (n = 3). Data are presented as mean ± SE. G IVIS images of mice treated with ESLNP encapsulating Luci-mRNA at different time points. The Luci substrate was injected at 0 h, 24 h, 48 h, 72 h, 96 h and 120 h intraperitoneally after ESLNPs treatment. H Expression kinetics of Luci mRNA after a single systematic administration of Luci ESLNPs (n = 3).
Furthermore, we explored the expression kinetics of mRNA drug via detecting BLI at multiple time points post a single administration of ESLNP. As depicted in Fig. 3G, H, the BLI disappeared on day 5, which indicated a longstanding protein expression after ESLNP treatment and provided instruction for the design of therapeutic schedules and pharmacodynamic assessment experiments.
Therapeutic efficacy of ESLNP in liver fibrosis mice
The therapeutic efficacy of ESLNP encapsulating different mRNA drugs was comprehensively investigated in a CCl4-induced liver fibrosis mouse model. As shown in Fig. 4A, after four weeks of CCl4 administration, the mice were randomly divided into four groups and treated with various therapeutic modalities. The group without CCl4 administration was treated with PBS as the sham control. We first utilized immunofluorescence to test ESLNP-enabled in vivo expression of therapeutic proteins and their direct effect. Following administration of C@ESLNPs, the colocalization of Myc and F4/80 in the immunofluorescence images of liver sections indicated the successful expression of Myc-labeled CAR in macrophages (Fig. 4B). The immunofluorescence images also revealed the colocalization of anti-FAP CAR and FAP, indicating the phagocytosis of aHSCs by engineered CAR-Ms, which was further confirmed by the notable reduction of FAP signals after C@ESLNP treatments (Fig. 4C and Supplementary Fig. S18). As to T@ESLNPs, the immunofluorescence imaging further substantiated a reduction in the colocalization of STING and F4/80, indicating a diminished expression of STING in macrophages (Fig. 4D, E). These results collectively confirmed the therapeutic potential of ESLNPs in targeting and reprogramming macrophages for antifibrotic treatment.

A Schematic illustration of the experimental design in CCl4-induced liver fibrosis model. Created in BioRender. Jinxin, G. (2025) https://BioRender.com/7achsnz. B Immunofluorescence images illustrating the expression of anti-FAP CAR with ESLNP treatment. Green, anti-FAP CAR; red, F4/80; blue, cell nuclei. Scale bar, 50 μm. C Immunofluorescence images showing the colocalization of CAR and FAP. Green, anti-FAP CAR; red, FAP; blue, cell nuclei. Scale bar, 50 μm. D Immunofluorescence images of STING expression. Green, F4/80; red, STING; blue, cell nuclei. Scale bar, 200 μm. E Quantification of STING expression in macrophages (n = 6). Data are presented as mean ± SE. F Serum level of ALT and AST (n = 6). Data are presented as mean ± SE. Quantitative analysis of Masson staining (G), SiriusRed staining (H) and α-SMA staining (I) in liver tissues at the end of the treatment (n = 9). Data are presented as mean ± SE. J Representative images of H&E, Masson staining, SiriusRed staining, and α-SMA staining in the liver tissues. Scale bar, 100 μm. K qPCRs for Col1a1, Col2a1 and TIMP-1 (n = 6). Data are presented as mean ± SE. L HYP content in liver tissues of various treatment groups (n = 6). Data are presented as mean ± SE. M Representative SEM images of liver decellularized ECM obtained from mice with different treatments. Scale bars, 2 μm. N Ki67 staining images of liver tissues. Scale bar, 100 μm. O Quantitative analysis of Ki67 positive area in liver tissues at the end of the treatment (n = 9). Data are presented as mean ± SE. P Schematic illustration of the experimental design in HFMCD-induced liver fibrosis model. Created in BioRender. Jinxin, G. (2025) https://BioRender.com/7achsnz. Q Representative images of H&E, Masson staining, SiriusRed staining, and α-SMA staining in the liver tissues. Scale bar, 100 μm. Quantitative analysis of Masson staining (R), SiriusRed staining (S) and α-SMA staining (T) in liver tissues at the end of the treatment (n = 9). Data are presented as mean ± SE. U HYP content in liver tissues of various treatment groups (n = 6). Data are presented as mean ± SE. Statistical significance among groups in (E–I, K, L, O and R–U) was assessed using one-way ANOVA.
To assess the anti-fibrotic efficacy, the mice were sacrificed two weeks post-treatment, and liver tissue and blood samples were collected for subsequent analyses. Alanine aminotransferase (ALT) and aspartate aminotransferase (AST) are well-established markers of hepatic injury, and the observed decline in their serum levels signifies restoration of liver function (Fig. 4F). Subsequently, hematoxylin and eosin (H&E), Masson, SiriusRed, and α‑smooth muscle actin (α‑SMA) staining were applied to liver slices to further evaluate antifibrotic efficacy. H&E staining results revealed that hepatocytes in the combinatory treatment group were well-aligned and structurally intact. Furthermore, mice in the combinatory treatment group exhibited a significant decrease in collagen deposition and α-SMA expression. The average percentages of positive area in Masson, SiriusRed, and α-SMA staining decreased about 8.52-fold, 4.99-fold, and 6.05-fold respectively in the combinatory treatment group than that in the PBS group (Fig. 4G–J). Quantitative PCR (qPCR) was also performed to assess the mRNA levels of Col1a1, Col2a1 and TIMP-1 in liver tissues from each group (Supplementary Table S3). Notably, the CT@ESLNP treatment elicited a pronounced downregulation of these fibrosis-related genes (Fig. 4K). The reduction of hydroxyproline (HYP) in harvested liver tissue further confirmed the potent collagen-degrading efficacy of CT@ESLNP treatment (Fig. 4L) Scanning electron microscopy (SEM) images revealed an increased proportion of thick fibril bundles in the decellularized liver ECM following CCl4 treatment. However, after CT@ESLNP treatment, the ECM exhibited a relatively finer and more uniform structure, resembling the fibrillar architecture found in healthy liver ECM. (Fig. 4M). Accordingly, anti-inflammatory aHSCs-specific CAR-Ms demonstrated exceptional efficacy in eliminating pathogenic aHSCs, accelerating the degradation of deposited collagen, halting fibrosis progression and thereby promoting fibrosis resolution.
Subsequently, we sought to assess the effect of macrophage reprogramming on liver function restoration. In Ki67 immunostaining sections, enhanced proliferation was detected in the livers of all treated mice, and the combinatory treatment promoted the most robust cell proliferation and liver regeneration (Fig. 4N, O). Furthermore, all treatment groups reversed the body weight loss that appeared in the PBS group, demonstrating the normalization of liver function in treated mice (Supplementary Fig. S19). Moreover, we constructed a high-fat, methionine-choline-deficient (HFMCD)-induced model to comprehensively test the therapeutic efficacy of ESLNP, which mimicked metabolism-associated liver fibrosis characterized by hepatocellular injury, lipid accumulation, inflammation, and progressive fibrosis. After 2 weeks of treatment, liver tissues were harvested for histological examination and HYP quantification (Fig. 4P). CT@ESLNPs treatment reduced both microvesicular and macrovesicular steatosis in H&E-stained sections, significantly decreased Masson staining, and lowered the positive areas of Sirius Red and α-SMA staining (Fig. 4Q–T). Meanwhile, hepatic HYP levels were markedly decreased in CT@ESLNPs-treated mice (Fig. 4U). These data collectively indicated the powerful therapeutic efficacy of ESLNP-edited anti-inflammatory CAR-Ms, which could promote fibrosis resolution and liver regeneration.
We further evaluated the biosafety of diverse treatment strategies in vivo. No conspicuous histopathological abnormality was detected in major organ sections of mice subjected to various treatments (Supplementary Fig. S20). Furthermore, there was no significant difference in serum kinase levels between the PBS group and ESLNPs-treated groups (Supplementary Fig. S21). These findings underscore the biocompatibility of ESLNPs and the biosafety of anti-fibrosis therapies. Taken together, the in situ macrophage engineering strategy with CT@ESLNP exhibited a commendable safety profile and proved marked efficacy in reversing hepatic fibrosis while improving liver function.
Anti-fibrotic immunity elicited by ESLNP in vivo
We next investigated the immunomodulatory potency of ESLNP-reprogrammed macrophages in liver fibrosis mice and sought to elucidate the specific mechanism of anti-fibrotic immune responses. Mice were euthanized after different treatments, and the liver tissues and peripheral blood were collected for flow cytometry analysis, immunohistochemical staining and ELISA, respectively. As depicted in Fig. 5A–C, mice in three treatment groups showed a notable switch of macrophages from profibrotic phenotype to anti-fibrotic phenotype, as evidenced by a decreased proportion of Ly6Chi/CD86+ macrophages and an increased proportion of Ly6Clow/CD206+ macrophages compared with that of the PBS-treated mice, signifying that both TRIM13 overexpression and CAR-mediated phagocytosis against aHSCs could induce macrophage polarization. Furthermore, the CT@ESLNP group exhibited an even more pronounced shift to anti-inflammatory phenotype, underscoring that synergizing TRIM13 overexpression and CAR modification could further reverse the inflammatory milieu. Furthermore, reduced serum levels of inflammatory factors, including TNF-α, IFN-γ, IL-6, and IL-1β, were detected in the CT@ESLNP-treated mice compared to that of PBS-treated mice (Fig. 5D). Therefore, CT@ESLNP treatment could effectively induce macrophage polarization towards an anti-inflammatory phenotype in the fibrotic liver of mice and thereby mitigate hepatic inflammation.

Representative flow cytometric plots and quantitative analysis of macrophages Ly6C (A), CD206 (B) and CD86 (C) expression in hepatic macrophages from mice subjected to various treatments (n = 6). Data are presented as mean ± SE. Statistical significance among groups was assessed using one-way ANOVA. D Serum levels (pg/mL) of TNF-α, IFNγ, IL-6, and IL-1β from various treatment groups detected by ELISA (n = 6). E Immunofluorescence images illustrating immunocytes infiltration in the liver tissue. Scale bar, 100 μm. Quantification of immunofluorescence staining in terms of Ly6G+ (F), CD11c+ (G), CD4+ (H) and CD8+ (I) area (n = 9). Data are presented as mean ± SE. Statistical significance among groups was assessed using one-way ANOVA.
The immune cell composition in the liver following different treatments was further investigated through flow cytometry and histopathological immunostaining (Fig. 5E and Supplementary Figs. S22–25). As shown in Fig. 5E, F and Supplementary Fig. S22A, both C@ESLNP and CT@ESLNP treatments resulted in a substantial increase of neutrophils, with flow cytometry results showing 1.80-fold and 1.77-fold higher than that in the PBS group, respectively. Immunofluorescence images revealed a significant increase of hepatic dendritic cells (DCs) in the C@ESLNP and CT@ESLNP treatment groups (Fig. 5E, G), and flow cytometry results further demonstrated that C@ESLNP and CT@ESLNP effectively induced DCs maturation (Supplementary Fig. S22B). Considering the established role of macrophages as antigen-presenting cells, we next assessed the ability of CAR-Ms to recruit T cells. Elevation in the T cell infiltration was observed in mice treated with C@ESLNP and CT@ESLNP, with CD3+ cells increasing to 37.13 ± 1.56% and 33.50 ± 1.59% in the C@ESLNP and CT@ESLNP groups (Supplementary Fig. S22C), and the quantitative analysis of immunofluorescence images also revealed a significant increase in CD4+ and CD8+ T-cell infiltration (Fig. 5E, H, I). These results collectively suggested that the phagocytosis of aHSCs by CAR-Ms triggered the adaptive immune responses, promoted immunocytes infiltration and subsequent activation in the fibrosis foci for eliciting a robust anti-fibrotic immunity. Overall, the combinatory therapeutic approach, integrating anti-inflammatory phenotype-modulating strategy with CAR-Ms therapy, effectively reversed the inflammatory fibrotic niche and activated an adaptive anti-fibrotic cascade, terminating fibrosis progression and accelerating fibrosis resolution, ultimately promoting hepatic restoration.
ScRNAseq analyses of CT@ESLNP therapy
To further elucidate the anti-fibrotic mechanism of CT@ESLNP, we performed single-cell sequencing of liver tissues from mice treated with PBS and CT@ESLNP (Fig. 6A). After quality control, 21,580 cells were collected for further analysis. According to the classic markers of various cell types, 10 clusters, namely B cells, conventional dendritic cells (cDCs), endothelial cells, macrophages, monocytes, neutrophil cells, NK cells, plasmacytoid dendritic cells (pDCs), plasma cells and T cells, were identified (Fig. 6B and Supplementary Fig. S26A). Subsequently, we focused on the distribution of relevant cell subtypes in the myeloid cell population (Fig. 6C and Supplementary Fig. S26B). Among these clusters, the proportion of Ly6Chi cluster cells decreased in CT@ESLNP groups while the Ly6Clo cluster cells increased (Fig. 6D). We further scored a macrophage gene signature and found that CT@ESLNP treatment markedly decreased expression of genes associated with a pro-inflammatory phenotype, including Ccl3, Cxcl2 and Mrc1 (Supplementary Fig. S26C). Additionally, we evaluated alterations in macrophage phagocytic capacity induced by in situ generated anti-inflammatory CAR-Ms. Analyses of the phagocytosis-related genes, including Axl, Mertk, Fcgr1, and Cd5l, demonstrated that macrophages in the CT@ESLNP group exhibited substantially augmented phagocytosis relative to PBS-treated group. The reinforced phagocytic capacity of macrophages facilitated the clearance of aHSCs and apoptotic cells, thereby promoting pronounced mitigation of liver fibrosis progression (Fig. 6E).

A Schematic diagram of the experimental procedure. Created in BioRender. Jinxin, G. (2025) https://BioRender.com/7achsnz. B UMAP integrating single cells from PBS and CT@ESLNP treatment groups. Ten clusters indicated by colors are marked with the presumed cell types. C Dot plots display the differentially genes of myeloid cells. D Percentages of major subpopulations of myeloid cells. E Violin plot showing the expression of Axl, Mertk, Fcgr1 and CD5l in macrophage clusters from each group. F Schematic illustration of in vivo generation of aHSCs-specific anti-inflammatory CAR-Ms mediated by ESLNPs for reversing liver fibrosis. In the ROS-enriched fibrotic liver, the exposure of PS triggers LNPs internalization by macrophages in an efferocytosis-like manner, which thus in situ engineering macrophages with anti-FAP CAR and TRIM13 for reversing liver fibrosis based on aHSCs-specific clearance and inflammatory resolution. Created in BioRender. Jinxin, G. (2025) https://BioRender.com/7achsnz and in Figdraw.com (Copyright Code: TPUYA2aa11).
In this study, we designed efferocytosis-sparked lipid nanoparticles (ESLNPs) by incorporating an ROS-responsive shielding group that concealed the negative charge of PS to avoid splenic sequestration yet exposed PS in the ROS-enriched fibrotic tissues, thereby enabling selective delivery of dual mRNAs encoding anti-FAP CAR and TRIM13 into fibrosis-associated macrophages and in situ generation of anti-inflammatory CAR-Ms. The engineered macrophages specifically eliminate aHSCs and resolve chronic hepatic inflammation, synergically arrests fibrosis progression and promotes liver recovery (Fig. 6F). These findings highlight the translational potential of this antifibrotic immunotherapy and underscore the need for its evaluation in other fibrotic diseases.
Discussion
Liver fibrosis represents a major global health concern, yet therapeutic interventions remain limited. Activation of HSCs is the major driver of liver fibrogenesis, and it is primed mainly by profibrogenic factors from resident and infiltrating inflammatory cells, of which macrophages are the predominant contributor. Recent preclinical and clinical studies have revealed that reprogramming profibrotic macrophages to an anti-inflammatory phenotype or infusing ex vivo-differentiated autologous macrophages could strikingly ameliorate liver fibrosis11,31,32, indicating that macrophage-centered therapeutic strategy is a promising avenue for liver fibrosis therapy. Furthermore, adoptive transfer of macrophages modified with CAR showed robust aHSCs and other fibroblasts elimination efficacy3,4,33. Our efferocytosis-sparked lipid nanoparticles enable the introduction of mRNAs into hepatic macrophages, yielding TRIM13-engineered CAR-Ms against liver fibrosis. We confirmed that reprogrammed CAR-Ms remodeled the fibrotic liver microenvironment to thwart HSCs activation by sustaining an anti-inflammatory Ly6Clo phenotype while eliminating existing aHSCs for a synergistic anti-fibrotic therapy, and elicited an adaptive anti-fibrotic immune response, ultimately reversing liver fibrosis.
The chronic inflammation in liver fibrosis is largely mediated by a dense network of macrophages that sense damage-associated molecular patterns (DAMPs) released from injured hepatocytes and initiate proinflammatory cascades. mtDNA, a mitochondria-derived DAMP, shows particular immunogenicity due to sharing similarities with bacterial DNA34. Intra-articular injection of mtDNA can induce arthritis in mice and massive trauma, and circulating mtDNA causes a sepsis-like systemic inflammatory response syndrome35,36. In chronic liver diseases and liver injuries, mtDNA is massively released due to extreme enrichment of mitochondria in hepatocytes37. Here, we identified mtDNA as an essential proinflammatory mediator to trigger macrophages shifting into and maintaining a proinflammatory phenotype through activating the classical cGAS-STING signaling pathway, similar to the induction of inflammatory responses in viral infection38. We further demonstrated that upregulating TRIM13, a STING-specific E3 ubiquitin ligase, could effectively degrade STING and thereby restrain inflammatory responses to mtDNA (Fig. 2D). Additionally, cell-based assays indicated that TRIM13 overexpression-mediated anti-inflammatory phenotype transformation had no significant effect on the phagocytic ability of CAR-Ms, demonstrating the feasibility of our synergistic anti-fibrotic therapy (Fig. 2F). In vivo assays further showed that synergistically engineered anti-inflammatory CAR-Ms effectively reduced collagen deposition, reversed the profibrotic and inflammatory milieu, and ultimately improved liver function (Figs. 4–6).
The in vivo engineering of CAR immune cells has emerged as a promising approach in immunotherapy39. Notable advances have been achieved in the treatment of myocardial fibrosis through the in situ editing of CAR-T cells3, and a comparable strategy has been employed in the treatment of hepatocellular carcinoma by editing macrophages in situ with LNPs40. Additionally, several products utilizing in vivo-edited CAR immune cells are currently in clinical development41,42. Despite effective mRNA delivery, the precise in situ editing remains a significant hurdle to broader clinical adoption of mRNA-LNP technology. Currently, the precise editing of LNPs to specific cells universally relies on targeting antibodies decoration43,44, which inevitably complicates the mRNA-LNP delivery system and reduces its stability. In this study, we synthesized a ROS-responsive helper lipid (PST) by conjugating thiazolidine-2-one to PS (a key “eat me” signal to macrophages)45 (Figs. 1B and Supplementary Figs. S3, 4). The shielding of PS reduces mononuclear phagocyte system-mediated nanoparticle clearance in the bloodstream. Moreover, the thiazolidine-2-one was specifically exfoliated upon ROS stimulation in the fibrotic foci, and PS was then exposed, promoting fibrosis-associated macrophages to engulf ESLNP in an efferocytosis-like manner and consequently yielding TRIM13-engineered CAR-Ms locoregionally (Fig. 3). Furthermore, our in situ transient CAR-Ms therapy shows excellent safety without visible damage (Supplementary Figs. S20, 21), coupled with remarkable anti-fibrotic efficacy (Fig. 4) and simple manufacturing procedure (Fig. 1), presenting great clinical translation potential.
There are several limitations in our current study. First, although no detectable toxicity of CT@ESLNPs was observed in our animal studies, long-term safety needs to be thoroughly evaluated before clinical translation. Second, we established a proof-of-concept for the efficacy and feasibility of CAR-Ms in liver fibrosis, yet the advantages of CAR-M therapy remain to be rigorously evaluated based on head-to-head comparison with CAR-T therapy. Third, we only testified the macrophage-targeted ability of ESLNPs in the hepatic fibrosis model, yet their applicability in other inflammation-related diseases has not been further investigated.
In summary, our research introduces an innovative immunotherapeutic strategy that synergizes macrophages’ phagocytic activity and immune modulation function for liver fibrosis treatment. By manipulating the shielding and exposure of PS in the ESLNPs, fibrosis-associated macrophages can be precisely edited to yield TRIM13-engineered CAR-Ms, thereby enabling them to eliminate aHSCs and repolarize to an anti-inflammatory phenotype, and ultimately reestablishing hepatic homeostasis. Therefore, our work provides a promising approach for hepatic fibrosis treatment and may be extended to other fibrotic diseases.
Methods
Materials
Fumaryl chloride, cholesterol, 1,2-distearoyl-sn-glycero-3-phosphoethanolamine (DOPE) and 1,2-dimyristoyl-rac-glycero-3-methoxypolyethyleneglycol-2000 (DMG-PEG) were bought from Shanghai Macklin Biochemical Co., Ltd. 2,4,6-triisopropylbenzenesulfonyl chloride (TPSCL), 2H-3,4-dihydropyran, tert-butyldimethylsilyl chloride, Glyoxaline, 4-Methyl-1-piperazineacetic acid, 4-Methyl-1-piperazinepropanoic acid, 4-Methyl-1-piperazinebutanoic acid, Pyridin-1-ium 4-methylbenzenesulfonate (PPTS), tetradecanoic acid, N-Boc L-Ser, thiazolidine-2-one, 2-(2-Iminoimidazolidin-1-yl) acetic acid, (4-methylpiperazin-1-yl) acetic acid, 4-methyl-1-piperazinebutanoic acid, olive oil and carbon tetrachloride were purchased from Meryer, Bidepharm Co., Ltd and Mreda Technology Inc. Sodium (R)-2,3-bis(stearoyloxy) propyl hydrogenphosphate (DSPA) were purchased from AVT (Shanghai) Pharmaceutical Tech Co., Ltd. Recombinant murine granulocyte-macrophage colony-stimulating factor (GM-CSF) and TGF-β was purchased from PeproTech Inc and Solarbio. Cell Counting Kit-8 (CCK8), bicinchoninic acid (BCA) assay kit, and cell plasma membrane staining kit with DiD were provided by Beyotime. LysoTracker Red was provided by Dalian Meilun Biotech Co., Ltd. EGFP plasmids, anti-FAP CAR plasmids, TRIM13 plasmids were purchased from Shanghai GeneBiogist Co., Ltd. The Quant-iT RiboGreen RNA Assay Kit was purchased from Thermo Fisher Scientific. The Hydroxyproline (HYP) content assay kit and Red Blood Cell Lysis Buffer were provided by Solarbio.
The antibodies used in this study were listed in Supplementary Table S4. Cell culture media and consumables were procured from Gibco BRL and CORNING. Cell-Tracker Red CMTPX and Cell-Tracker Green CMFPA were provided by Shanghai Maokangbio. The pHrodoTM Red was purchased from Thermo Fisher Scientific. Plasmid DNA was prepared using Plasmid Mini Kit Plus (Tsingke). In vitro transcription was performed with a T7 High Yield RNA Transcription Kit, and the resulting transcripts were capped using a Cap 1 Capping System (both from Novoprotein). The ELISA kits were purchased from Wuhan Servicebio Technology Co., Ltd.
Cells
The RAW 264.7 cells were purchased from the National Collection of Authenticated Cell Cultures, Chinese Academy of Science (SCSP-5036). RAW 264.7 cells were cultured in DMEM (Gibco) containing 10% fetal bovine serum (HyClone), 1% penicillin/streptomycin (Gibco) and a 5% CO2 atmosphere at 37 °C. Bone marrow-derived macrophages (BMDMs) were isolated from mice femurs and cultured in DMEM (Gibco) containing 10% fetal bovine serum (HyClone), 1% penicillin/streptomycin (Gibco) and 10 ng/ml GM-CSF (PeproTech) in a 5% CO2 atmosphere at 37 °C. AML12 cells were purchased from National Collection of Authenticated Cell Cultures, Chinese Academy of Science (SCSP-550). AML12 cells were cultured in DMEM-F12 containing 10% fetal bovine serum, 0.5% ITS-G (100×), 40 ng/mL Dexamethasone, and 1% Penicillin/Streptomycin. Primary HSCs were isolated by differential centrifugation. Briefly, the mouse was sterilized and the liver was exposed, then perfused via the portal vein with 30 mL of calcium- and magnesium-free Hank’s solution followed by 1 mg/mL type IV collagenase (3 mL/min). The liver was excised, minced, and digested in a 37 °C oscillating water bath for 30 min. The cell suspension was filtered through a 100-μm nylon mesh, washed, and centrifuged twice. HSCs were isolated by continuous 60% Percoll density gradient centrifugation (4 °C, 800 × g, 20 min). HSCs were cultured in DMEM-F12 (Gibco) containing 10% fetal bovine serum (HyClone) and 1% penicillin/streptomycin (Gibco) in a 5% CO2 atmosphere at 37 °C46.
Animals
Male C57BL/6 J mice (6–8 weeks) were obtained from an accredited vendor (Ji’nan Pengyue Laboratory Animal Breeding Co., Ltd.). All animal procedures were reviewed and approved by the Institutional Laboratory Animal Ethical and Welfare Committee (Cheeloo College of Medicine, Shandong University) and conducted in accordance with institutional guidelines. For the CCl4-induced liver fibrosis model, mice were treated with intraperitoneal injection of a CCl4/olive oil (1/4, v/v) mixture at a dose of 2 μL/g twice a week for 6 weeks, with treatment commencing after the first 4 weeks of CCl4 administration. Male C57BL/6J mice (6–8 weeks) were fed a HFMCD diet (A06071301B, Research Diets) to establish the HFMCD model, while control mice received a normal diet (D11112201, Research Diets) under identical housing conditions. After model establishment, treatment was administered following the same protocol as used in the original CCl4-induced fibrosis model. Therapeutic outcomes were evaluated by histological analysis of liver sections and quantification of HYP content.
Synthesis and characterization of PnT14 and PST
For the synthesis of PnT14, P1T14 serves as an illustrative example
To a mixture of tert-butyldimethylsilyl chloride (44.6 mmol), imidazole (92.9 mmol), and TRIS (12.4 mmol), 5 mL of anhydrous N, N-dimethylformamide was added, and the reaction proceeded at room temperature for 12 h. The reaction mixture was then diluted with water and extracted with dichloromethane (CH2Cl2). The organic phase was separated, dried over anhydrous sodium sulfate (Na₂SO₄), and concentrated under reduced pressure. The resulting crude product was purified by silica gel column chromatography (ether/ethyl acetate), yielding the TRIS-TBS (94.21% yield).
For the synthesis of P1TBS, a mixture of 4-methyl-1-piperazineacetic acid (6.32 mmol) and dichloromethane (10 mL) was treated dropwise with 7.200 mL of triethylamine under stirring in an ice bath for 10 min. Subsequently, 1-ethyl-(3-dimethylaminopropyl) carbodiimide hydrochloride (9.39 mmol) and 1-hydroxybenzotriazole (9.32 mmol) were added, and the reaction was carried out for 30 min. The TRIS-TBS (6.47 mmol) was dissolved in dichloromethane and added dropwise to the reaction mixture, which was then stirred for 24 h. The organic phase was diluted with saturated sodium bicarbonate (NaHCO3) and extracted with CH2Cl2. After drying with anhydrous Na2SO4, the solvent was removed under reduced pressure. The yellow oil was purified by silica gel column chromatography (dichloromethane/methanol), yielding the P1TBS (74.11% yield).
To a solution of 2.73 mmol of TBAF·3H2O dissolved in tetrahydrofuran (THF), the solution was added dropwise to a mixture of P1TBS (0.828 mmol) and 10 mL of THF under an ice bath. The reaction proceeded for 3 h and then removed the solvent under reduced pressure to obtain a light yellow oil. 9.39 mmol of 1-ethyl-(3-dimethylaminopropyl) carbodiimide hydrochloride, 9.32 mmol of 1-hydroxybenzotriazole, and 3 mmol of tetradecanoic acid were added to this system, and the reaction was carried out for 24 h. The organic phase was diluted with saturated NaHCO3 and extracted with CH2Cl2. After drying with anhydrous Na2SO4, the solvent was removed under reduced pressure, and the product was purified by silica gel column chromatography (dichloromethane/methanol), yielding a yellow oily material P1T14 (24.22% yield).
For the synthesis of PST
N-Boc L-Ser (146 mmol), PPTS (146 mmol), and 2H-3,4-dihydropyran (146 mmol) were dissolved in 100 ml of CH2Cl2 and reacted at room temperature for 24 h. The mixture was removed under reduced pressure, and the residue was dissolved in ethyl acetate and washed with water. The organic phase was subsequently dried over anhydrous Na2SO4 and concentrated under reduced pressure. The crude product was purified by silica gel column chromatography, yielding THP-Boc-Ser as a white solid in 31.42% yield.
TEA (1.110 mL) was added dropwise to THP-Boc-Ser (1.73 mmol) dissolved in CH2Cl2 at 0 °C, followed by the addition of 1-ethyl-(3-dimethylaminopropyl) carbodiimide hydrochloride (2.07 mmol), 1-hydroxybenzotriazole (2.07 mmol), and thiazolidine-2-one (1.73 mmol). The reaction was carried out for 24 h. The organic phase was diluted with saturated NaHCO3 and extracted with CH2Cl2. After drying with anhydrous Na2SO4, the solvent was removed under reduced pressure. The crude product was purified by silica gel column chromatography, yielding THP-Boc-Ser-T as a white solid in 40.58% yield.
THP-Boc-Ser-T (0.6 mmol) and PPTS (0.6 mmol) were dissolved in anhydrous ethanol and stirred at 55 °C for 12 h. After evaporation under reduced pressure, the reaction mixture was diluted with saturated NaHCO3 and extracted with CH2Cl2. The organic phase was dried with anhydrous Na2SO4 and concentrated under reduced pressure, yielding Boc-Ser-T 92.15%.
DSPA-Na (0.131 mmol) and TPSCL (0.394 mmol) were placed in a dry vessel, and Boc-Ser-T (0.262 mmol) dissolved in 5 mL of anhydrous pyridine was added under N2 protection. The reaction proceeded overnight at 40 °C. The solvent was removed under reduced pressure, and the residue was dissolved in CH2Cl2. The crude product was purified by silica gel column chromatography, yielding Boc-PST as a white solid in 35.88% yield.
Boc-PST (0.47 mmol) was dissolved in CH2Cl2, and 1 mL of trifluoroacetic acid was added dropwise to the system in an ice bath. The reaction was carried out for 2 h, and subsequently concentrated under reduced pressure. The residue was diluted with saturated NaHCO3 and extracted with CH2Cl2, the organic phase was dried over anhydrous Na2SO4 and concentrated to obtain a white solid product PST with a yield of 96.16%.
¹H and ¹³C NMR spectra for PnT14 and PST were acquired in CDCl₃ using Bruker DRX-400 (¹H) and Bruker AV-600 (¹³C) instruments.
mRNA construction
Anti-FAP CAR plasmids were linearized with Mlu I, purified, and used as templates for T7-driven in vitro transcription. The resulting RNA was subsequently Cap-1 capped and purified, and transcript integrity was assessed by agarose gel electrophoresis. TRIM13 mRNA was prepared identically to FAP-specific CAR mRNA.
Formulation, optimization and characterization of ESLNPs
LNPs containing EGFP mRNA were prepared based on different formulations shown in Supplementary Table S1 via a microfluidic device. RAW 264.7 cells were seeded in 48-well plates (1 × 10⁵ cells/ well) and cultured for 12 h, followed by incubation with LNPs for 16 h (300 ng mRNA/well). Flow cytometry (Gallios, Beckman, USA) was used to evaluate transfection efficiency. The formulations with the highest transfection efficiency were used for subsequent experiments. The ionizable lipid P3T14, PST, cholesterol, and DMG-PEG were dissolved in ethanol at a molar ratio of 25:30:30:1.5 and the mRNA was diluted in a citrate disodium hydrogen phosphate buffer (pH = 4). The LNPs were assembled by swiftly combining the ethanol phase and aqueous phase with a microfluidic device. Subsequently, it was dialyzed in a DEPC-PBS solution (MWCO 100 kDa) for 30 min to eliminate ethanol and free mRNA.
For the encapsulation efficiency of ESLNPs, the Quant-iT RiboGreen RNA kit was mixed with either LNPs or LNPs demulsified with 2% Triton X-100. Upon excitation by a 480 nm laser, the fluorescence intensity at 520 nm was measured by a multimode plate reader (EnSight, PerkinElmer, Singapore), and the mRNA content was determined based on the standard curve. The mRNA content in LNP and LNP demulsified with 2% Triton X-100 is denoted as M1 and M2, respectively. The encapsulation efficiency was calculated with the formula: (M2 − M1)/M2 ×100%. The morphology of ESLNPs was determined by transmission electron microscope (TEM). Particle size, polydispersity index (PDI), and zeta potential of ESLNP were measured by the Zetasizer Nano ZS90 (Malvern, UK). PtdSer presentation was validated by flow cytometry20. All the ROS treatment of LNPs was processed with 0.1 mM H2O2 for 12 h.
In vitro cytotoxicity assay
The cell toxicity of ESLNPs was detected by CCK-8 assay. The RAW 264.7 cells were seeded in 96-well plates (1 ×10⁴ cells/well) and incubated with LNPs containing mRNA at different concentrations (62.5, 100, 250, 500, 1000, 1250 ng/mL). After 6 h of incubation, the treated medium was replaced with 100 μL of fresh medium, and cultured for additional 18 h. Subsequently, 10 μL of CCK-8 agent were added to each well, followed by incubation at 37 °C for 2 h. The absorbance at 450 nm was then measured by a multimode plate reader (EnSight, PerkinElmer, Singapore).
Examination of cellular uptake
To visualize LNP-mediated mRNA cellular uptake, mRNA was labeled with carboxyfluorescein (FAM). RAW 264.7 cells (3.0 ×10⁵ cells/well) and BMDMs (3.0 ×10⁵ cells/well) were seeded on sterile glass bottom culture dishes and cultured overnight. PBS, FAM-labeled mRNA and LNPs were added to the dishes and incubated for 5 h. The cells were washed with PBS, and the cell membranes were stained with DiD. Then, extra DiD was removed by washing with PBS, and the nuclei were stained with DAPI. Images were acquired by High-Resolution Living Cell Imager (LSM 900 with Airyscan 2, Zeiss, Germany).
Examination of endosome escape
Raw 264.7 cells (3.0 ×10⁵ cells/well) were seeded on sterile glass bottom culture dishes and cultured overnight. The cells were treated with ESLNPs carrying FAM-labeled mRNA and subsequently incubated for 1 or 5 h. Cells were then washed with PBS and stained with LysoTracker Green (Invitrogen) to label acidic endo/lysosomal compartments, followed by DAPI staining for nuclear visualization. Images were acquired by High-Resolution Living Cell Imager (LSM 900 with Airyscan 2, Zeiss, Germany).
mtDNA isolation and quantification
Mitochondrial DNA (mtDNA) was isolated using a mtDNA isolation Kit (Abcam) according to the manufacturer’s instructions. For immunofluorescence staining, isolated mtDNA was labeled with Cy5-dCTP following the manufacturer’s instructions (Amersham Cy5-dCTP, Cytiva).
Expression of anti-FAP CAR and the macrophage phagocytosis analysis
ESLNPs encapsulating anti-FAP CAR mRNA were prepared for in vitro transfection tests. RAW 264.7 cells and BMDMs cells were seeded into 6-well plates at 3.0 ×10⁵ cells/ well and transfected with LNPs (1 μg of mRNAs/well) for 12 h. Transfection efficiency was tested by flow cytometry, and the expression of Myc-labeled CAR was confirmed by CLSM.
HSCs (1.0 ×10⁵ cells/well) were seeded on sterile glass bottom culture dishes, cultured overnight, and labeled with Cell-Tracker Red CMTPX dye (or pHrodoTM Red for CLSM). To activate quiescent HSCs, the cells were treated with 10 ng/mL TGF-β1 for 24 h. Subsequently, HSCs or aHSCs (1.0 ×10⁵ cells/well) were added to BMDMs (1.0 ×10⁵ cells/well) with different treatments as scheduled and incubated for 12 h. The cells were harvested and stained with anti-CD11b, and the percentage of BMDMs that phagocytosed HSCs and aHSCs was quantified by flow cytometry.
Phenotype changes of macrophages with different treatment
BMDMs were seeded in 6-well plates (3.0 ×10⁵ cells/well) and cultured for 12 h. To mimic profibrotic phenotype macrophage in the fibrotic foci, RAW 264.7 cells and BMDMs were stimulated with mtDNA (100 ng/mL) for 12 h. The macrophages were then incubated with ESLNP encapsulating mRNAs as scheduled. After incubation, the medium was collected, and the concentration of TNF-α, IL-6 et al. was measured by ELISA (Servicebio, China) following the manufacturer’s instruction. The expression of Ly6C and CD86 was detected by flow cytometry (Gallios, Beckman, USA).
Apoptotic cell clearance capacity
AML12 cells were washed once with PBS and incubated with prewarmed Cell-Tracker Red, protected from light, for 30 min in a 5% CO2 atmosphere at 37 °C; cells were then washed twice with PBS and treated with 1968 µL complete DMEM containing 32 µL of 50 mM palmitic acid stock (final palmitate 0.8 mM) for 24 h.
Macrophages treated with or without ESLNPs were labeled with Cell Tracker Green, and then co-incubated with Cell Tracker Red-labeled apoptotic AML12 cells at a 1:1 ratio for 4 h. The efferocytosis process was further visualized by CLSM.
The distribution of LNPs in vivo
To induce CCl4-related liver fibrosis, 6–8 weeks C57BL/6 mice were intraperitoneally (i.p.) injected with 2 μL/g CCl4 diluted in olive oil (1/4, v/v) twice a week. Olive oil injection served as the control group. Both healthy mice and fibrotic mice were injected with LNPs encapsulating Luci mRNA (0.3 mg/kg), and the bioluminescent signals were detected by the IVIS imaging system after luciferin injection (100 mg/kg).
To further determine CAR expression in the liver after systemic administration of C@ESLNPs (1 mg/kg), liver tissues were collected and the proportion of CAR+ cells was analyzed by flow cytometry. (Gallios, Beckman, USA). Macrophages were labeled with anti-F4/80-BV421, and CAR expression was detected with anti-Myc-FITC. CAR expression was further confirmed by immunofluorescence staining of liver tissue sections.
In vivo treatment of CCl4-induced fibrotic mice
Six to eight weeks C57BL/6 mice were intraperitoneally (i.p.) injected with 2 μL/g CCl4 diluted in olive oil (1/4, v/v) twice a week for 4 weeks. Then, the CCl4-treated mice were randomly divided into 4 groups and systemically injected with PBS, T@ESLNP, C@ESLNP and CT@ESLNP twice a week (1 mg/kg) for following two weeks with continued CCl4 stimulation. Body weight was monitored throughout the study. At the end of the treatment period, mice were euthanized and the liver tissues and blood samples were collected for subsequent analysis.
Liver tissue decellularization
To obtain decellularized whole-liver ECM from mice, we followed an in situ perfusion protocol. Briefly, mice subjected to various treatments were anesthetized, and the hepatic portal vein was cannulated with a polyethylene tube connected to a peristaltic pump. The flow rate was set at 3 ml/min, and the inferior vena cava was severed to allow for buffer perfusion. 1.9% EGTA solutions were perfused for 20 min to flush out blood. Then, sodium dodecyl sulfate (SDS) solutions at concentrations of 0.01%, 0.02%, and 0.05% were sequentially perfused over 12 h for each step. Deionized water was subsequently perfused for an additional 12 h to thoroughly rinse away any residual buffer. The decellularized tissues were collected and preserved in glutaraldehyde fixative (Biosharp, China) and further characterization was conducted by Shiyanjia, China.
HYP assays
The total collagen content of liver tissue was quantified by the HYP Content Assay kit (Solarbio, China) according to the manufacturer’s instructions.
In vivo flow cytometry
For the flow cytometry analysis, the tissues were collected and placed into a digestive enzyme cocktail, followed by shaking at 37 °C for 1 h. Then the tissues were homogenized and the suspension was filtered through 70 μm nylon cell strainer, followed by centrifugation at 800 × g for 7 min. The pellet was resuspended in RBC lysis buffer and vortexed for 2 min. Afterward, PBS was added and repeated centrifugation step47. Finally, the sediments were resuspended into PBS and treated with FcR blocking reagent for 15 min (Miltenyi Biotec, Germany). Then, the cell suspension was incubated with desired antibodies for 1 h at room temperature. All samples were analyzed by flow cytometry (Gallios, Beckman, USA).
Immunofluorescence and immunohistochemistry
The cells were seeded on sterile glass bottom culture dishes and cultured for 12 h. After that, these cells were fixed in 4% paraformaldehyde and permeabilized with 0.2% Triton X-100. Non-specific binding was blocked with 2% bovine serum albumin (BSA), after which the cells were incubated with primary antibodies at 37 °C for 1 h. Subsequently, fluorophore-labeled secondary antibodies were applied, and nuclei were counterstained with DAPI as needed.
For immunohistochemistry analysis, mice with various treatments were euthanized, and the liver tissues were harvested and fixed in 4% paraformaldehyde, embedded in paraffin, and sectioned for staining (conducted by Wuhan Servicebio Technology Co., Ltd). Subsequently, the stained sections were visualized and captured by the HD panoramic scan and image analysis system (VS120, Olympus, Japan).
Quantitative PCR
Total RNA from liver was extracted using RNA extraction solution (Wuhan Servicebio Technology Co., Ltd) following the manufacturer’s instructions. RNA samples (1 µg) were then reverse-transcribed into complementary DNA (cDNA) using SweScript All-in-One RT SuperMix for qPCR (Wuhan Servicebio Technology Co., Ltd). The data were normalized to housekeeping gene β-actin expression, and statistical analysis was calculated by the 2−ΔΔCt equation. The primers used in this study are shown in Supplementary Table S3.
Single-cell RNA sequencing
The samples were obtained from the liver from mice treated with PBS or CT@ESLNP. The harvested tissues were transferred to a Petri dish (kept on wet ice) prefilled with 1× PBS (RNase-free, Ca2+/Mg2+-free) and washed with 1× PBS to remove blood, grease, and other surface contaminants. Tissues were then diced into ~0.5 mm2 pieces and washed again with 1× PBS. The tissue pieces were incubated in dissociation solution (0.35% collagenase IV5, 2 mg/mL papain, 120 U/mL DNase I) for 20 min at 37 °C in a shaking water bath (100 rpm). Dissociation was terminated by adding PBS containing 10% fetal bovine serum. The samples were gently triturated 5-10 times with a pipette (carefully to avoid shear-induced cell death), filtered through a 70–30 µm cell sieve, and centrifuged at 300 × g for 5 min at 4 °C The cell pellet was resuspended in 100 µL 1× PBS (0.04% BSA). To remove erythrocytes, 1 mL of 1× erythrocyte lysis solution (MACS 130-094-183, stock 10×) was added and incubated at room temperature or on wet ice for 2–10 min. After lysis, cells were centrifuged at 300 × g for 5 min at 4 °C and the pellet collected. Dead Cell Removal MicroBeads (100 µL; MACS 130-090-101) were added, mixed, and incubated for 15 min at room temperature. Binding buffer was then added and the suspension applied to MS Columns (130-042-201) to remove reagents and dead cells. Cell pellets were collected by centrifugation at 300 × g for 5 min at 4 °C, resuspended in 1× PBS (0.04% BSA), and centrifuged again at 300 × g for 5 min at 4 °C (repeated twice). The resulting single-cell suspension was adjusted to 100 µL of 1× PBS (0.04% BSA). Cell viability was assessed by trypan blue staining and required to be >85%. Cell counts were obtained using a hemocytometer or a Countess II Automated Cell Counter, and the final cell concentration was 700–1200 cells/µL.
Single-cell suspensions were loaded onto a 10× Chromium chip following the manufacturer’s instructions for the 10× Genomics Chromium Single-Cell 3′ Kit (v3). cDNA amplification and library construction were performed according to standard protocols. Libraries were sequenced by LC-Bio Technology (Hangzhou, China) on an Illumina NovaSeq 6000 system (paired-end, 150 bp) to a minimum depth of 20,000 reads per cell. For bioinformatic analysis, raw Illumina base-call files were converted to FASTQ format using bcl2fastq (v5.0.1). scRNA-seq reads were aligned to the reference genome and cellular 3’-end transcripts were identified and counted using Cell Ranger (v7.0.0) (see 10× Genomics support). The Cell Ranger output expression matrix was imported into Seurat (v4.1.0) for quality filtering, scaling and clustering. Low-quality cells were removed using the following thresholds: >500 genes detected per cell and <25% mitochondrial gene content. Finally, cells were projected into two-dimensional space using t-SNE or UMAP.
Biosafety analysis
For the biosafety analysis, healthy mice were randomly divided into four groups and subjected to injections of PBS, C@ESLNP, T@ESLNP and CT@ESLNPs. The mice were euthanized, and the major organs (heart, liver, spleen, lungs, kidneys) were sectioned and stained with H&E. Whole blood was collected, and serum was isolated for the measuring of ALT, AST, CREA and BUN.
Statistical analysis
All statistical analyses of raw data were conducted by GraphPad Prism software. The statistical significance was analyzed by Student’s t test or ANOVA. Significant differences are indicated as ns P ≥ 0.05, *P < 0.05, **P < 0.01, ***P < 0.001, and ****P < 0.0001.
Reporting summary
Further information on research design is available in the Nature Portfolio Reporting Summary linked to this article.
Data availability
All data needed to evaluate the conclusions in the paper are present in the paper and/or the Supplementary Materials. The scRNA-seq data have been deposited in the Genome Sequence Archive (Genomics, Proteomics & Bioinformatics 2025) in National Genomics Data Center (Nucleic Acids Res 2025), China National Center for Bioinformation / Beijing Institute of Genomics, Chinese Academy of Sciences (GSA: CRA031089) that are publicly accessible at https://ngdc.cncb.ac.cn/gsa/browse/CRA031089. Source data are provided with this paper.
References
-
Higashi, T., Friedman, S. L. & Hoshida, Y. Hepatic stellate cells as key target in liver fibrosis. Adv. Drug Deliv. Rev. 121, 27–42 (2017).
-
Trautwein, C., Friedman, S. L., Schuppan, D. & Pinzani, M. Hepatic fibrosis: concept to treatment. J. Hepatol. 62, S15–S24 (2015).
-
Rurik, J. G. et al. CAR T cells produced in vivo to treat cardiac injury. Science 375, 91–96 (2022).
-
Aghajanian, H. et al. Targeting cardiac fibrosis with engineered T cells. Nature 573, 430–433 (2019).
-
Amor, C. et al. Senolytic CAR T cells reverse senescence-associated pathologies. Nature 583, 127–132 (2020).
-
Wen, Y., Lambrecht, J., Ju, C. & Tacke, F. Hepatic macrophages in liver homeostasis and diseases-diversity, plasticity and therapeutic opportunities. Cell. Mol. Immunol. 18, 45–56 (2020).
-
Kisseleva, T. & Brenner, D. Molecular and cellular mechanisms of liver fibrosis and its regression. Nat. Rev. Gastroenterol. Hepatol. 18, 151–166 (2020).
-
Li, S. et al. Macrophage-specific FGF12 promotes liver fibrosis progression in mice. Hepatology 77, 816–833 (2023).
-
Ramachandran, P. et al. Differential Ly-6C expression identifies the recruited macrophage phenotype, which orchestrates the regression of murine liver fibrosis. Proc. Natl. Acad. Sci. USA 109, E3186–E3195 (2012).
-
Hu, M. et al. Hepatic macrophages act as a central hub for relaxin-mediated alleviation of liver fibrosis. Nat. Nanotechnol. 16, 466–477 (2021).
-
Toita, R., Kitamura, M., Tsuchiya, A., Kang, J. H. & Kasahara, S. Releasable, immune-instructive, bioinspired multilayer coating resists implant-induced fibrosis while accelerating tissue repair. Adv. Healthc. Mater. 13, e2302611 (2023).
-
Garland, K. M., Sheehy, T. L. & Wilson, J. T. Chemical and biomolecular strategies for STING pathway activation in cancer immunotherapy. Chem. Rev. 122, 5977–6039 (2022).
-
Decout, A., Katz, J. D., Venkatraman, S. & Ablasser, A. The cGAS-STING pathway as a therapeutic target in inflammatory diseases. Nat. Rev. Immunol. 21, 548–569 (2021).
-
Luo, X. et al. Expression of STING is increased in liver tissues from patients with NAFLD and promotes macrophage-mediated hepatic inflammation and fibrosis in mice. Gastroenterology 155, 1971–1984 e1974 (2018).
-
Liu, Z. et al. XBP1 deficiency promotes hepatocyte pyroptosis by impairing mitophagy to activate mtDNA-cGAS-STING signaling in macrophages during acute liver injury. Redox Biol. 52, 102305 (2022).
-
Li, X. et al. The transmembrane endoplasmic reticulum-associated E3 ubiquitin ligase TRIM13 restrains the pathogenic-DNA-triggered inflammatory response. Sci. Adv. 8, eabh0496 (2022).
-
Lee, J., Byun, J., Shim, G. & Oh, Y. K. Fibroblast activation protein activated antifibrotic peptide delivery attenuates fibrosis in mouse models of liver fibrosis. Nat. Commun. 13, 1516 (2022).
-
Gao, J. et al. A FAPalpha-activated MRI nanoprobe for precise grading diagnosis of clinical liver fibrosis. Nat. Commun. 15, 8036 (2024).
-
Nagata, S., Hanayama, R. & Kawane, K. Autoimmunity and the clearance of dead cells. Cell 140, 619–630 (2010).
-
Zhang, S. et al. Remodeling articular immune homeostasis with an efferocytosis-informed nanoimitator mitigates rheumatoid arthritis in mice. Nat. Commun. 14, 817 (2023).
-
Cheng, Q. et al. Selective organ targeting (SORT) nanoparticles for tissue-specific mRNA delivery and CRISPR-Cas gene editing. Nat. Nanotechnol. 15, 313–320 (2020).
-
Luozhong, S. et al. Phosphatidylserine lipid nanoparticles promote systemic RNA delivery to secondary lymphoid organs. Nano Lett. 22, 8304–8311 (2022).
-
Perez, C., Monserrat, J. P., Chen, Y. & Cohen, S. M. Exploring hydrogen peroxide responsive thiazolidinone-based prodrugs. Chem. Commun. 51, 7116–7119 (2015).
-
Wang, X. et al. Preparation of selective organ-targeting (SORT) lipid nanoparticles (LNPs) using multiple technical methods for tissue-specific mRNA delivery. Nat. Protoc. 18, 265–291 (2023).
-
Wang, L.-C. S. et al. Targeting fibroblast activation protein in tumor stroma with chimeric antigen receptor T cells can inhibit tumor growth and augment host immunity without severe toxicity. Cancer Immunol. Res. 2, 154–166 (2014).
-
Yum, S., Li, M., Fang, Y. & Chen, Z. J. TBK1 recruitment to STING activates both IRF3 and NF-kappaB that mediate immune defense against tumors and viral infections. Proc. Natl Acad. Sci. USA 118, e2100225118 (2021).
-
Ma, R., Ortiz Serrano, T. P., Davis, J., Prigge, A. D. & Ridge, K. M. The cGAS-STING pathway: the role of self-DNA sensing in inflammatory lung disease. FASEB J. 34, 13156–13170 (2020).
-
Hao, Y. et al. Reactive oxygen species-responsive polypeptide drug delivery system targeted activated hepatic stellate cells to ameliorate liver fibrosis. ACS Nano 16, 20739–20757 (2022).
-
Huang, J. et al. Retinol-binding protein-hijacking nanopolyplex delivering siRNA to cytoplasm of hepatic stellate cell for liver fibrosis alleviation. Biomaterials 299, 122134 (2023).
-
Yang, T. et al. Therapeutic HNF4A mRNA attenuates liver fibrosis in a preclinical model. J. Hepatol. 75, 1420–1433 (2021).
-
Moroni, F. et al. Safety profile of autologous macrophage therapy for liver cirrhosis. Nat. Med. 25, 1560–1565 (2019).
-
Moreno-Lanceta, A. et al. RNF41 orchestrates macrophage-driven fibrosis resolution and hepatic regeneration. Sci. Transl. Med. 15, eabq6225 (2023).
-
Dai, H. et al. Chimeric antigen receptor-modified macrophages ameliorate liver fibrosis in preclinical models. J. Hepatol. 80, 913–927 (2024).
-
Gray, M. W., Burger, G. & Lang, B. F. Mitochondrial evolution. Science 283, 1476–1481 (1999).
-
Collins, L. V., Hajizadeh, S., Holme, E., Jonsson, I.-M. & Tarkowski, A. Endogenously oxidized mitochondrial DNA induces in vivo and in vitro inflammatory responses. J. Leukoc. Biol. 75, 995–1000 (2004).
-
Zhang, Q. et al. Circulating mitochondrial DAMPs cause inflammatory responses to injury. Nature 464, 104–107 (2010).
-
Garcia-Martinez, I. et al. Hepatocyte mitochondrial DNA drives nonalcoholic steatohepatitis by activation of TLR9. J. Clin. Investig. 126, 859–864 (2016).
-
Hopfner, K. P. & Hornung, V. Molecular mechanisms and cellular functions of cGAS-STING signalling. Nat. Rev. Mol. Cell Biol. 21, 501–521 (2020).
-
Yi, W., Hu, S., Qian, X., Yan, W. & Li, Y. Synthetic Biology-Based Engineering Cells for Drug Delivery. Exploration 5, 20240095 (2025).
-
Yang, Z. et al. Dual mRNA co-delivery for in situ generation of phagocytosis-enhanced CAR macrophages augments hepatocellular carcinoma immunotherapy. J. Control Rel. 360, 718–733 (2023).
-
Li, N. et al. A new era of cancer immunotherapy: combining revolutionary technologies for enhanced CAR-M therapy. Mol. Cancer 23, 117 (2024).
-
Bui, T. A., Mei, H., Sang, R., Ortega, D. G. & Deng, W. Advancements and challenges in developing in vivo CAR T cell therapies for cancer treatment. EBioMedicine 106, 105266 (2024).
-
Parhiz, H. et al. PECAM-1 directed re-targeting of exogenous mRNA providing two orders of magnitude enhancement of vascular delivery and expression in lungs independent of apolipoprotein E-mediated uptake. J. Control Rel. 291, 106–115 (2018).
-
Tombacz, I. et al. Highly efficient CD4+ T cell targeting and genetic recombination using engineered CD4+ cell-homing mRNA-LNPs. Mol. Ther. 29, 3293–3304 (2021).
-
Segawa, K. & Nagata, S. An apoptotic ‘eat me’ signal: phosphatidylserine exposure. Trends Cell Biol. 25, 639–650 (2015).
-
Lan, T. et al. Sphingosine kinase 1 promotes liver fibrosis by preventing miR-19b-3p-mediated inhibition of CCR2. Hepatology 68, 1070–1086 (2018).
-
Sager, H. B. et al. RNAi targeting multiple cell adhesion molecules reduces immune cell recruitment and vascular inflammation after myocardial infarction. Sci. Transl. Med. 8, 342ra380–342ra380 (2016).
Acknowledgements
This work was supported by the National Key Research and Development Program of China (2024YFA0918400), National Natural Science Foundation of China (82425056 and 82350125, 82173763, 82404560), the Fundamental Research Funds of Shandong Province (ZR2022ZD18, ZR2023QH191), the China National Postdoctoral Program for Innovative Talents (BX20230204), the China Postdoctoral Science Foundation (2023M732091), the Taishan Scholar Program of Shandong Province (NO.tsqn202507054), Qilu Young Scholars Discipline Construction Funds of Shandong University (21310082363663) and Excellent Young Scholars of Shandong Provincial Natural Science Foundation (2022HWYQ-008). We are grateful for technical support from X.S and L.W. from the Pharmaceutical Biology Sharing Platform, School of Pharmaceutical Sciences, Shandong University. We thank Wuhan Servicebio Technology Co., Ltd. and eceshi (www.eceshi.com) for the Immunofluorescence, immunohistochemistry and SEM characterization of liver tissues. Image created with Biorender.com and Figdraw.
Ethics declarations
Competing interests
The authors declare no competing interests.
Peer review
Peer review information
Nature Communications thanks Hiroyasu Nakano, who co-reviewed with Yuichi Tsuchiya, Hua Wang, and the other, anonymous, reviewer(s) for their contribution to the peer review of this work. A peer review file is available.
Additional information
Publisher’s note Springer Nature remains neutral with regard to jurisdictional claims in published maps and institutional affiliations.
Supplementary information
Source data
Rights and permissions
Open Access This article is licensed under a Creative Commons Attribution-NonCommercial-NoDerivatives 4.0 International License, which permits any non-commercial use, sharing, distribution and reproduction in any medium or format, as long as you give appropriate credit to the original author(s) and the source, provide a link to the Creative Commons licence, and indicate if you modified the licensed material. You do not have permission under this licence to share adapted material derived from this article or parts of it. The images or other third party material in this article are included in the article’s Creative Commons licence, unless indicated otherwise in a credit line to the material. If material is not included in the article’s Creative Commons licence and your intended use is not permitted by statutory regulation or exceeds the permitted use, you will need to obtain permission directly from the copyright holder. To view a copy of this licence, visit http://creativecommons.org/licenses/by-nc-nd/4.0/.
About this article

Cite this article
Gao, J., Yang, Z., Song, Y. et al. TRIM13 in situ engineering boosts anti-inflammatory capacity of CAR-Ms for liver fibrosis therapy. Nat Commun 17, 2077 (2026). https://doi.org/10.1038/s41467-026-69858-3
-
Received:
-
Accepted:
-
Published:
-
Version of record:
-
DOI: https://doi.org/10.1038/s41467-026-69858-3