Introduction
Transplanted and engineered cells are increasingly being used in medical treatments, thereby necessitating advanced analytical methods to ensure their efficacy and reliability of high-performance therapies. For example, tissue regeneration involves delivering specific types of cells to injured tissues or organs to restore their function, thus rendering it one of the most widely used cell therapies currently1. Strategies for tissue regeneration have been expanded via various approaches, including Gintuit, a multicellular sheet utilizing allogeneic fibroblasts, and StrataGraft, a recently Food and Drug Administration (FDA)-approved tissue-engineered skin substitute that incorporates living human dermal fibroblasts (hDFs)2,3,4,5. hDFs are commonly employed in scaffold-based tissue engineering strategies, particularly wound healing, owing to their outstanding potential in generating angiogenic paracrine factors and key components of the extracellular matrix (ECM), such as collagen and fibronectin6,7,8. Angiogenic genes promote the growth of new blood vessels, which supply oxygen and nutrients necessary for healing9. ECM genes assist in the construction of a scaffold that supports cells, thus facilitating wound fixing by the engineered tissue10,11.
Although these efficient biological properties, which render hDFs and other dermal cells highly beneficial for tissue regeneration, they are not widely adopted in actual clinical applications owing to their inability to consistently achieve uniform therapeutic performance across various treatment conditions12,13. Engineered therapeutic cells should undergo expansion and aging during the production process within a specific range of passage numbers that maintain consistent therapeutic characteristics for predictable treatment outcomes14,15. However, notable heterogeneity in the aging level of single cells arises since each cell is subjected to its own microscopic environmental conditions and metabolic states16. These differences result in diverse aging rates among whole-cell populations, which causes some cells to age faster or slower than others, thereby resulting in extremely inefficient treatment17,18,19. Therefore, achieving a precise analysis of aging heterogeneity and consistent therapeutic efficacies at the single-cell level remain critical challenges for reliable tissue regeneration, although they are highly recommended by the FDA for ensuring the efficacy and quality control of cell therapies20,21.
Despite the critical requirements mentioned above, the existing tissue cell therapies rely on nonquantitative aging analysis at the cell-population level22,23,24. This dependence on qualitative aging evaluations, which merely compare pre- and post-engineering conditions, hinders the accurate assessment of therapeutic efficacy. Furthermore, the analysis of candidate cell types has been restricted to the main active ingredients at the gene and protein levels, which precludes the possibility of rapid diagnosis of product quality with aging status during production25,26. Therefore, one must leverage the phenotypic characteristics of single cells, including biochemical properties such as the reactive oxygen species (ROS), which is a key aging messenger, and biophysical properties such as the cell size, shape, mass, volume, and refractive index (RI). Such a comprehensive informatics-based approach that integrates genomic, proteomic, and phenomic data enables the precise quantitative control of aging heterogeneity across multiple dimensions, thereby advancing tissue cell therapy.
Flow and chemical cytometry have been primarily utilized to analyze the heterogeneity of therapeutic cells at single-cell resolutions27. However, the requirement for labeling and lysis renders these methods destructive, as they alter the intrinsic nuclear architecture of single cells, thus limiting their applicability in actual production and treatment. Although image cytometry has been recently integrated with artificial intelligence (AI) to enable rapid and label-free single-cell analysis28, its ability to correlate molecular information, which is crucial for understanding cell aging, remains limited. More importantly, these analytical techniques offer mere phenotype analyses and fail to establish a quantitative relationship between the therapeutic performance of the analyzed cells and key genomic factors29. Therefore, robust analytics that can quantify the multidimensional heterogeneities of aging based on the diverse phenotypes of individual cells in a label-free, high-throughput manner are essential for predicting treatment outcomes and ensuring reliable therapeutic applications of the cells.
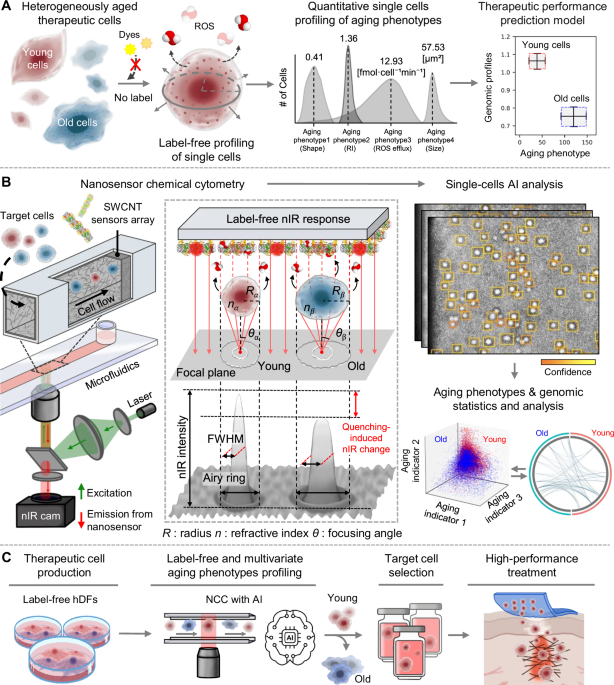
In this study, we developed and enhanced NCC to profile multidimensional aging heterogeneity by incorporating high-throughput automation and deep learning-based analysis, enabling large-scale single-cell measurements in high precision. It can quantify the aging heterogeneity of therapeutic cells (e.g., hDFs) in a nondestructive and high-throughput manner. We quantify four representative biophysical and biochemical phenotypes related to aging: cell size, eccentricity, RI, and H2O2 efflux (Fig. 1A). By correlating these label-free aging phenotypes with genomic information, we establish an empirical model for predicting the therapeutic performance of hDFs at various aging stages. To perform NCC, we integrate a near-infrared (nIR) fluorescent single-walled carbon nanotube (SWCNT) nanosensor array with a microfluidic system as a bifunctional source for the simultaneous label-free imaging and sensing of cells (Fig. 1B). Upon introducing hDFs into the microchannel, the flowing cells serve as highly informative Gaussian lenses projecting nIR emission profiles from an SWCNT nanosensor array and extract aging information on a per-cell basis in real time and in a label-free manner30,31. This is due to the photonic nanojet phenomenon between nIR fluorescence from the nanosensor array and flowing live cells32. The resulting optical modulation serves as an optical readout of biophysical and chemical properties of the cell. nIR-mode single-cell images are analyzed by calculating the airy ring and lensing intensity generated by the photonic nanojet, thus enabling the determination of the cell size, shape, RI, and ROS rate. By simultaneously analyzing hundreds of nIR images using a deep-learning program developed in this study, we establish a quantitative correlation between phenotypic heterogeneities and genetic information obtained via the RNA sequencing (RNA-seq) of hDFs. This methodology may enable the sensitive detection of phenotypic changes in aging hDFs, facilitate rapid on-site identification of young cells by profiling target phenotypes, and ultimately improve therapeutic outcomes (Fig. 1C). Furthermore, it can enable a comprehensive plate-to-tissue feedback cycle and optimize the efficacy of cell-based regenerative therapies for future applications.

A Label-free profiling of hDFs phenotypes, including cell size, shape, RI, and H2O2 efflux and their correlation with genomic database. B Single-cell sensing mechanism of NCC using cellular lensing effect based on photonic nanojet, image analysis using AI, and data correlation between NCC aging phenotype and genomic information from RNA-seq. C Conceptual workflow of hDF-therapy development process via label-free NCC profiling of aging heterogeneities.
Results
Characterizations of aging in hDFs
To accurately investigate the aging characteristics of hDFs, we differentiated normal (non-aged) cells from aged cells using different passage numbers. Passage 5 hDFs (p5), typically used in cell therapy because of their high proliferative capacity and therapeutic efficacy33,34, were used as the control group, whereas passage 15 hDFs (p15), known for their reduced regenerative potential35, and representing the maximum passage number guaranteed by the cell supplier, served as the aged group. Analysis of conventional aging markers at intermediate passages between p5 and p15 demonstrates that these two passages can sufficiently cover the key stages of aging and exhibit discernible distinctions in aging characteristics (Supplementary Fig. 1). We employed various analytical techniques to characterize the age-related phenotypic and molecular discrepancies between p5 and p15. Established markers of cellular aging include increased senescence-associated β-galactosidase (SA-β-gal) activity36,37, decreased mitochondrial membrane potential (MMP) due to mitochondrial dysfunction38, shortened telomere length39, upregulation of pro-inflammatory cytokines40,41,42,43, alterations in specific cell-cycle regulators inducing cell-cycle arrest and halting proliferation44, enlarged cell size and cytoskeletal changes associated with an abundance of lysosomes, vacuoles, and mitochondria45, and ROS accumulation, which substantially contributes to cellular aging38,46,47. This comprehensive assessment highlighted key aging markers, such as an increase in SA-β-Gal (Fig. 2A) and a decrease in MMP (Fig. 2B), thus indicating ceased division with an irreversible growth arrest. Quantitative reverse transcription polymerase chain reaction (qRT-PCR) analyses revealed that the average telomere length in p15 was significantly shorter than that in p5, with mean values of 1.90 ± 0.01 kb for p15 and 10.50 ± 0.70 kb for p5, indicating that p15 was more advanced in aging than p5 (Fig. 2C). Additionally, qRT-PCR showed elevated expression of Interleukin 6 (IL6) and Interleukin 1β (IL1β) in p15, thus suggesting enhanced pro-inflammatory signaling in aged cells (Fig. 2D). Total RNA-seq analysis revealed distinct differences in gene expression profiles between p5 and p15, indicating substantial changes associated with cellular aging (Fig. 2E and F). p5 exhibited signatures indicative of active cell proliferation and homeostatic maintenance, whereas p15 demonstrated gene expression patterns associated with reduced inflammatory responsiveness and impaired cellular adaptability, hallmarks of cellular aging (Supplementary Fig. 2). Specifically, genes involved in cell cycle regulation and mitosis, such as ANKRD53, CDC25C, and NEK2, were upregulated in p5, whereas cell cycle inhibitory genes, including SPRY2 and WNT5A, were elevated in p15, reflecting proliferative capacity in p5 and functional impairment in p15 (Fig. 2G and H). Gene interaction network and gene ontology–biological process (GO-BP) analyses further substantiated these findings, revealing robust enrichment of mitotic, meiotic, and cell division–related pathways in p5 (Fig. 2I and J). These results suggest that p5 retains active mechanisms that support proliferation and cellular renewal, whereas these processes deteriorate markedly in p15.

A Aging-related changes detected using β-galactosidase assays of p5 and p15 and its quantification expressed as relative fluorescence units (RFUs) (n = 6, biological replicates). B Mitochondrial membrane potentials (MMP) of p5 and p15 measured by TMRE fluorescence (n = 8, biological replicates). C Telomere length of p5 and p15 evaluated by qRT-PCR (n = 3, biological replicates). D Relative gene expression levels of IL6 and IL1β in p5 and p15 evaluated by qRT-PCR (n = 4, biological replicates). E PCA plot of p5 and p15 showing clustering by sample type across PC1. F Circos plot showing overlapping of genes from p5 and p15. G Volcano plot, H heatmap, I gene ontology–biological process (GO-BP) term -based enrichment network, and J bubble plot of GO-BP enrichment analysis for cell cycle-related genes in p5 and p15. Pathway enrichment analysis was performed using Metascape, and the bubble plot was generated using SRplot. K Relative gene expression levels of MKI67 in p5 and p15 via qRT-PCR (n = 4, biological replicates). L Microscopy images and Phalloidin staining (blue: nuclei, red: F-actin) of p5 and p15 (scale bar = 250 μm). M Cell-size distribution of p5 and p15 quantified via Phalloidin staining (n = 37, biological replicates). N Intracellular ROS staining using DCF-DA (green), with its quantification expressed in RFUs (n = 6, biological replicates). Data are presented as mean ± SD. Welch’s two-sided t-test was performed to compare p5 and p15 for each assay. Statistical significance is indicated as follows: ****p < 0.0001, *** p < 0.001, **p < 0.01, ns not significant. Source data are provided as a Source Data file, and full statistical results are provided in Supplementary Data 1.
Despite the increased production of inflammatory cytokines, p15 showed diminished responsiveness to these stimuli and impaired cellular adaptation, indicating functional impairment associated with aging. Consistently, network analysis highlighted that while signals related to inflammation, oxidative stress, and apoptosis were elevated in p15, the regulatory and response mechanisms were compromised, revealing a complex profile of functional decline (Supplementary Fig. 3). Furthermore, the decreased expression of MKI67 also known as Ki-67 coincided with alterations in cell cycle–related gene expression, indicating an age-related decline in cell cycle regulation and DNA repair capacity (Fig. 2K). An optical microscopy image showed that p15 experienced not only an increase in cell size but also a change in cell shape from spindle shaped to polygonal, thus indicating that aging impinges upon the cellular architecture and function (Fig. 2L). Cell-size quantification via phalloidin/DAPI staining confirmed that p15 showed much greater size heterogeneity than p5 (Fig. 2M and Supplementary Fig. 4). The passive release of H2O2 from aged hDFs was strongly associated with an increase in ROS levels. A dose-dependent increase in the ROS levels was particularly pronounced in p15, as indicated by DCF-DA staining (Fig. 2N). These results were supported by the flow cytometry of p5 and p15 mixed at different ratios (10:0, 8:2, 5:5, 2:8, and 0:10), which showed a gradual and steady increase in ROS expression with an increase in p15 (Supplementary Fig. 5). This increase in ROS serves as a biomarker for aging and may contribute to the morphological and functional decline in older cells. These findings provide a molecular basis for the reduced efficacy of therapies using aged fibroblasts and validate our NCC aging-analysis capabilities.
Workflow of NCC for aging analysis of hDFs
Based on the aging characteristics of hDFs, we injected p5, p7, p9, p11, p13, and p15 into a fabricated nanophotonic microchip and performed NCC analysis. This analysis was conducted using hDFs in the floating state, which reflects the final product condition, as most cell therapies are administered in suspension. To examine the biophysical and molecular profiles of each single cell, we acquired nIR images. The nIR images of each aging sample were analyzed using our specified deep-learning tools to detect single hDFs (Fig. 3A). Additionally, we employed the yolov5l model and conducted deep-learning training (Supplementary Fig. 6)48. Each component enhanced the performance of the model in accurately locating bounding boxes, assessing object confidence, and classifying objects, thereby increasing the cell-detection precision (Supplementary Fig. 7). Because the model consistently achieved an F1 score above 0.97 at confidence levels of 0.4 and 0.5, we set the confidence threshold at 0.50 (Supplementary Figs. 8 and 9). Only predictions exceeding this threshold were considered effective detections and were represented in shades progressing from orange to yellow49,50. To calculate the biophysical phenotypes of the detected cells, we optimized an elliptical mask around the cell periphery using an in-house code. Then, the lengths of the major (a) and minor (b) axes were measured through the center of the ellipse, enabling the determination of both cell size and eccentricity. Next, we measured the full width at half maximum (FWHM) of the nIR lensing profiles to calculate the RI30. Finally, the lensing intensity changes were measured to calculate the H2O2 efflux. Here, we targeted H2O2 among the ROS owing to its most central and stable role in cellular signaling during aging51. To detect the efflux of H2O2 from a cell, we used a (GT)15 DNA wrapped SWCNT (SWCNT/(GT)15). While this sensor can respond to a range of ROS and secreted biomolecules, it exhibits preferential sensitivity and consistent quenching behavior toward H2O2, making it a reliable indicator for high-sensitivity detection of H2O2 efflux. This property has been previously demonstrated through the observed attenuation of nIR intensity upon selective detection of H2O2 (Supplementary Figs. 10 and 11)52,53. By combining the surface reaction kinetics of H2O2 on the nanosensors with diffusion decay models from the cell, changes in nIR intensity in cell lensing images were quantified to measure H2O2 efflux down to the femtomolar level in a completely label-free manner (detailed model derivations are presented in Supplementary Note 1)30. The real-time detection of such low concentrations of H2O2 efflux is enabled by the close interaction between single cell surfaces and the overlying nanosensor array via a biowaveguide.

A Deep learning-based single-cell data-extraction workflow based on nIR lensing images. B Representative raw data (top) and deep learning-processed data (bottom) of p5, p7, p9, p11, p13, and p15 obtained from NCC. C Calculations of cell size and eccentricity, and FWHM of intensity along cross-sectional line for p5 and p15 using image-analysis code. Left: raw image, middle: coded image; right: cross-sectional nIR intensity profiles. D Representative FDTD snapshot of single hDFs forming a photonic nanojet, and 3D regression model for estimating RI extraction of single hDFs via FDTD. Real-time H2O2 efflux sensing in (E) p5 and (F) p15 within 10 min. Left: nIR images at 0 and 10 min; middle: color-adjusted images based on nIR intensity; right: histogram of normalized nIR intensities (≥0.30) within the cell regions, overlaid with Non-Gaussian KDE curves. Blue and red lines indicate intensity distributions at 0 and 10 min, respectively. Source data are provided as a Source Data file.
A total of 13,924, 10,378, 14,430, 7,546, 10,707, and 14,792 single cells were detected and used for the subsequent data extraction of p5, p7, p9, p11, p13, and p15, respectively (Fig. 3B). Details of the experimental batches and corresponding single cell counts for each group are provided in Supplementary Table 1. Representative nIR images and lensing profiles revealed that p15 was markedly larger and more elongated than p5 (Fig. 3C). Finite-difference time-domain method (FDTD) simulation shows that nIR fluorescence from the top of the hDFs focused strongly on a distant point 20 μm from the cell center, thus forming a ~4 μm wide photonic nanojet (left, Fig. 3D). This optical effect arises under specific conditions, such as when the RI ratio between the particle and the surrounding medium is below 2 and the particle diameter aligns with the wavelength of incident light54. Live animal cells inherently satisfy these conditions due to their relative RI (1.33–1.42) and size range (10–20 μm), making them highly conducive to nanojet formation. In contrast, microparticles of similar size and shape to cells such as glass beads or polystyrene have a relatively higher RI of around 1.4, which prevents nanojet generation (Supplementary Fig. 12). These findings confirm that the fluorescence changes observed in cells are driven by the photonic nanojet phenomenon, not by scattering or diffraction effects. By performing these FDTD simulations, we constructed a three-dimensional (3D) regression plot based on the measured radius and FWHM for the estimated RI extraction from the target cells in NCC (right, Fig. 3D). To confirm that the nIR signal response specifically originates from H2O2 efflux in the cells, we conducted control experiments under distinct H2O2 enzymatic conditions (Supplementary Fig. 13), verifying that the signal is attributable to H2O2 release rather than other chemicals or optical artifacts. Representative p5 data showed a ~5.33% decrease in the nIR lensing intensity (I) within 10 min, which was attributed to H2O2 efflux from the cell, thus resulting in the quenching of the nanosensor area (Fig. 3E). Meanwhile, p15 exhibited an ~ 8.86% decrease in I, which might be due to enhanced H2O2 signaling associated with the aging process (Fig. 3F).
Aging heterogeneities of hDFs revealed by NCC
Using the NCC workflow, we analyzed the distribution of aging phenotypes in single cells, including the size, eccentricity, RI, and H2O2 efflux, within the p5 and p15 populations (Fig. 4A). The mean (μ) cell size for p5 was 65.83 μm2, with a standard deviation (σ) of 18.14, whereas for p15, the μ of cell size was 88.94 μm2, with a σ of 42.78. For eccentricity, p15 showed a μ of 0.43 with a σ of 0.16, whereas p5 showed a μ of 0.46 with a σ of 0.18. p5 indicated a μ RI of 1.3647 with a σ of 0.0090, whereas p15 showed a μ RI of 1.3602 with a σ of 0.0096. Finally, the μ H2O2 efflux for p5 was 21.84 fmol·cell-1·min-1 with a σ of 17.83, whereas for p15, a μ was 31.08 fmol·cell-1·min-1 was indicated with a σ of 35.00. The μ values for the size and H2O2 efflux agreed well with the average size and H2O2 assay of hDF populations characterized using conventional staining-based assays. When observing the change from p5 to p15, the μ values for the cell size, eccentricity, and H2O2 efflux all increased, whereas the RI decreased (Welch’s t-test, p < 0.0001). Additionally, the σ for all four phenotypes of hDFs significantly increased from p5 to p15 (F-test, p < 0.0001), thus indicating an overall increase in cellular heterogeneity with aging. When comparing with the middle aging levels of p7, p9, p11, and p13, the μ remained almost consistent up to p13, whereas the σ increased until p13, followed by a significant increase in p15 (Fig. 4B). Single distribution curves of each phenotype for p7, p9, p11, and p13 are shown in Supplementary Fig. 14.

A Non-Gaussian distribution curves of cell size, eccentricity, RI, and H2O2 efflux in p5 and p15. Data points for RI and H2O2 efflux were excluded with 95% confidence interval. B Comparison of mean (μ) values and standard deviation (σ) of each phenotype in p5, p7, p9, p11, p13, and p15. Welch’s two-sided t-test was used to compare mean values between p5 and each of the other passages (represented by red, blue, orange, and green lines for each phenotype). Two-sided F-test was used to compare standard deviations between p5 and each passage (purple line). 2D correlation graphs for C size vs. RI, D eccentricity vs. size, E RI vs. eccentricity, F size vs. H2O2 efflux, G eccentricity vs. H2O2 efflux, and H RI vs. H2O2 efflux in p5 and p15. Coordinates at maximum density value were plotted based on KDE, Pearson correlation coefficient (R) and linear regression of correlation (black line) are displayed on each graph to assess relationships between variables. Statistical significance is indicated as follows: ****p < 0.0001, ***p < 0.001, ns: not significant (vs. p5). Source data are provided as a Source Data file, and full statistical results for Welch’s t-test and F-test are provided in Supplementary Data 1.
By plotting two-dimensional (2D) correlation graphs, we visualized the dynamic shifts in single-cell densities and identified the coordinates of the maximum density based on kernel density estimation (KDE). Additionally, we calculated the Pearson correlation coefficient (R) to quantitatively analyze the correlation between the two indicators (Fig. 4C–H). The correlation between size and RI showed R values of –0.41 and –0.59 for p5 and p15, respectively (Fig. 4C). The relationship between RI and size exhibited the most dynamic correlation, which is consistent with the result of previous studies55,56. The R value decreased by 0.18 after aging, thus indicating a stronger negative correlation compared with the case before aging. The eccentricity showed a correlation with size, with R values of 0.15 and 0.22 for p5 and p15, respectively (Fig. 4D), and a correlation with the RI, with R values of 0.19 and 0.14 for p5 and p15, respectively (Fig. 4E). This represents an independent attribute with the lowest R values. The 2D correlations between the biophysical phenotypes for p7, p9, p11, and p13 are shown in Supplementary Fig. 15. Additionally, we investigated the dynamic physicochemical correlations between the biochemical and biophysical attributes (Fig. 4F–H). The correlation between size and H2O2 efflux exhibited the most sensitive dynamics, with R values of 0.31 and 0.43 for p5 and p15, respectively (Fig. 4F). Furthermore, the correlation between RI and H2O2 efflux showed R values of –0.16 and –0.30 for p5 and p15, respectively. This indicates a difference in the R value of 0.14, which signifies that the negative correlation becomes more pronounced with aging (Fig. 4H). Meanwhile, eccentricity remained as an independent attribute with respect to H2O2 efflux, with R values of 0.02 and 0.07 for p5 and p15, respectively (Fig. 4G). 2D correlation graphs between the biophysical and biochemical phenotypes for p7, p9, p11, and p13 are shown in Supplementary Fig. 16. In general, eccentricity exhibited a less dynamic correlation than the other phenotypes during hDF aging. This result is consistent across other passage numbers of hDFs, as confirmed via principal component analysis (PCA) (Supplementary Fig. 17).
3D aging trajectory derived from NCC
Based on 2D dynamic analysis, we selected size, RI, and H2O2 efflux as the phenotypes most reflective of hDF aging and plotted the 3D single-cell distribution space for p5 and p15 (Fig. 5A and B). For p5, the maximum density values were obtained under a size of 56.06 μm2, an RI of 1.3638, and a H2O2 efflux of 12.78 fmol·cell-1·min-1 (left, Fig. 5A). For p15, the maximum density values were obtained under a size of 65.91 μm2, an RI of 1.3597, and an H2O2 efflux of 15.33 fmol·cell-1·min-1 (left, Fig. 5B). The nIR images of representative single cells from the maximum density spaces clearly showed the sensitive changes in the attributes (right, Fig. 5A and B). Details of the nIR images and intensity histograms for single cells at the maximum density spaces can be found in Supplementary Fig. 18. By overlaying the 3D spaces of p5 and p15, we observed an increase in the scattered plots, thus further highlighting the pronounced effect of aging on hDF heterogeneity (Fig. 5C). The 3D single-cell distribution space graphs for p7, p9, p11, and p13 are shown in Supplementary Fig. 19. To quantify the heterogeneity of each group, we calculated the mean effective volume (mean EV) based on the 3D single-cell distribution space (Fig. 5D). The effective volume for each data point was defined as the reciprocal of its local density value (D), and the mean EV was calculated as follows:
$${Mean; EV}=frac{1}{n}{sum}_{i=1}^{n}frac{1}{{D}_{i}}$$
(1)
where n is the total number of cells in the group, and Di is the local density of the i-th cell estimated by KDE.

3D single-cell distribution spaces based on size, RI, and H2O2 efflux in A p5 and B p15. Left: 3D single-cell distribution space graph; right: single cells from maximum density spaces in nIR images. C Overlapped 3D plots of p5 and p15. D Mean effective volume (mean EV) values calculated from 3D single-cell distribution plots of p5, p7, p9, p11, p13, and p15. E Aging trajectories based on maximum density values obtained from cell size, RI, and H2O2 efflux in p5, p7, p9, p11, p13, and p15. Each point was calculated based on three features, and the Euclidean distance was computed between adjacent passages (e.g., p5–p7, p7–p9). For unknown subjects 1–4, data points for RI and H2O2 efflux were also excluded based on the 95% confidence interval. F The maximum density coordinates were mapped onto the 3D aging trajectories, and G the prediction rates and accuracy at each aging passage were evaluated. Welch’s two-sided t-test was performed to compare p5 with each of the other passages. Statistical significance is indicated as follows: ****p < 0.0001, ***p < 0.001, ns: not significant (vs. p5). Source data are provided as a Source Data file, and full statistical results are provided in Supplementary Data 1.
As a result, the mean EV was 306.640 at p5, showing moderate variations in earlier passages. Notably, it showed a sharp increase to 1337.183 at p15, indicating a substantial rise in cellular heterogeneity. Welch’s t-test confirmed a statistically significant increase in mean EV from p5 to p15 (p < 0.0001), suggesting that cell distribution becomes considerably more dispersed in late-passage populations. Based on these coordinates, we completed the 3D aging trajectories for the hDFs (Fig. 5E), which visually represent the spatial trends in cell population shifts across passages. The Euclidean distances between the maximum density coordinates of each passage showed a gradual increase as passages progressed, and the largest change was observed between p13 and p15 with a distance of 9.033. The distance between p5 and p15 was calculated to be 13.828, suggesting a notable spatial shift in the central distribution of the cell population between early and late passages. This trajectory provides a visual interpretation of how cell populations spatially evolve with aging.
For future applications, we can directly estimate the aging levels of unknown hDF subjects in a quantitative manner by only measuring the NCC phenotypes and mapping them onto these virtual 3D aging trajectories. While conventional aging assessment methods rely on label-based genetic or proteomic analyses, which are complex and time-consuming, it is noteworthy that the proposed method allows for rapid and straightforward calculations. To demonstrate this, we developed a predictive model for unknown aging subjects by integrating 3D aging trajectories-based features with KDE density-based characteristics. Clustering was performed using five 3D aging trajectories-based features, including cell size, H2O2 efflux, and RI. Then, the clustering results were combined with eight KDE-based features, including data spread and the heterogeneity index, to train the model (Supplementary Table 2). We trained the model with a Multi-Task Learning approach (Supplementary Fig. 20)57. Using this model, we predicted the aging stages of four unknown subjects (Subject 1-4). For each subject, the maximum density coordinates were mapped onto the 3D aging trajectory to qualitatively visualize their distribution within the feature space (Fig. 5F). As a result, the predicted aging stages showed high prediction rates, exceeding 85% for the p5, p9, and p13 stages (Fig. 5G). Detailed analyses can be found in Supplementary Fig. 21. To demonstrate the universal applicability of our system across various aging models, we applied the NCC system to a chemically induced aging model using hDFs treated with 0 μM, 100 μM, and 200 μM of H2O2 (Supplementary Fig. 22). Increasing concentrations of H2O2 led to elevated oxidative stress and induced premature aging in the cells58. In the 3D aging trajectories, distinct patterns emerged corresponding to the H2O2 concentrations, reflecting aging processes in the premature aging model that closely resemble those of conventional aging.
Evaluation and correlation of NCC with cell-treatment efficacy
Finally, the in-vitro therapeutic performance of hDFs was evaluated in order to assess whether the NCC results aligned with the genetic and cytokine profiles across different ages. Genomic profiling revealed notable genetic alterations that underpin functional differences between young and old hDFs. Specifically, p15 exhibited increased gene expression involved in oxidative stress and ROS production, including IFI6, SLC1A1, and PDK4, whereas the expression of CBS, a gene that mitigates oxidative stress, decreased (Fig. 6A and B). These genetic alterations suggest enhanced potential for ROS production in aged cells, which is consistent with the observed decreases in MMP and increased ROS levels (Supplementary Fig. 1). Furthermore, upon exposure to ROS, these cells exhibited a respiratory burst, in contrast to the homeostatic regulation observed in p5, which actively downregulated apoptotic pathways (Fig. 6C). Conversely, p5 showed increased expression of genes such as IGFBP5, MBP, and AGT, associated with oxidative stress and wound healing, reflecting robust cellular mechanisms for responding to external stress and injury (Supplementary Fig. 23). Such discrepancies were also evident in the ECM organization, with p5 exhibiting greater expression of ECM-related genes including COL11A1, MFAP5, AGT, and ACAN compared to p15 (Fig. 6D and E). GO-BP analyses further delineated these differences, with p15 predominantly enriched in ECM organization and blood vessel development, whereas p5 exhibited enrichment in ossification and ECM regulatory pathways (Fig. 6F). These genomic and functional differences highlight the distinct biological states of hDFs at different stages of aging, with p5 geared toward growth and regeneration, whereas p15 displayed enriched stress responses and aging-associated decline. Gene expression profiles associated with inflammation and apoptosis further supported these conclusions, demonstrating a clear distinction between the growth-oriented profiles of p5 and the inflammation and stress-responsive profiles of p15 (Supplementary Figs. 24 and 25). Additionally, morphological changes in p5 and p15 corroborated these findings, reinforcing that gene expression patterns reflect the progression of aging. The evaluation of angiogenic capabilities revealed a marked downregulation of key factors, such as the vascular endothelial growth factor (VEGFA) and hepatocyte growth factor (HGF), in p15, as demonstrated via qRT-PCR (Fig. 6G) and enzyme-linked immunosorbent assay (ELISA) analysis (Fig. 6H). Furthermore, representative ECM factors such as collagen type I (COL1A1), epithelial cadherin (E-cadherin, CDH1), fibronectin, and smooth muscle α-actin (SM-α) were observed to be downregulated in p15, as assessed via qRT-PCR (Fig. 6I) and western blotting analysis (Fig. 6J). These declines in angiogenic and ECM factor expression correspond to increased aging-associated markers such as SA-β-Gal and ROS alongside mitochondrial dysfunction and telomere shortening, thus suggesting an internal cellular environment that is becoming less supportive of vascular growth and tissue regeneration59. Further analysis into the effect of hDFs on vascular cells via conditioned media experiments highlights the marked difference in angiogenic promotion between p5 and p15. Media from p5 clearly enhanced the formation and migration of endothelial structures in HUVECs, thus suggesting that the secretome of younger fibroblasts retained its functional vitality, which is pivotal for applications in tissue regeneration (Figs. 6K and L and Supplementary Figs. 26 and 27). These findings underscore the importance of refining cellular implants by determining the degree of aging in clinical applications, particularly when robust angiogenesis, ECM secretion, and cell proliferation are required.

RNA-seq results depicted in A heatmap, B volcano plot, and C GO-BP term-enrichment analysis of ROS responses in p5 and p15. RNA-seq results depicted in D heatmap, E volcano plot, and F GO-BP term-enrichment analysis of ECM regulation in p5 and p15. Pathway enrichment analysis was performed using Metascape. Relative G gene and H protein expression levels of angiogenic factors (VEGFA and HGF) in p5 and p15, as evaluated via qRT-PCR (n = 4, biological replicates) and ELISA (n = 6, biological replicates). Relative I gene and J protein expression levels of ECM factors (collagen type I, E-cadherin, fibronectin, and SM-α) in p5 and p15, as evaluated via qRT-PCR (n = 4, biological replicates) and western blotting analysis (n = 4, biological replicates). Uncropped full-length blots are presented in Supplementary Fig. 28. Data are presented as mean ± SD. Quantification of K tube formation by measuring the number of junctions (n = 4, biological replicates) and nodes (n = 4, biological replicates), and L quantification of cell migration evaluated using scratch assay (n = 120, biological replicates), following treatment of HUVECs with CM from p5 and p15. 2D correlation graphs show relationships between proteomic data and aging phenotypes. Each plot uses values normalized based on the mean and standard deviation of batch-level data, with p5 set to 1 as the reference. tan θ values represent ratio of changes in aging phenotypes to changes in proteomic data. M Correlation of VEGF levels with aging phenotypes. N Correlation of collagen type I levels with aging phenotypes. The x-axis shows NCC-derived aging phenotypes averaged over single-cell measurements (p5, n = 5 batches; p15, n = 8 batches), and the y-axis represents protein expression levels obtained from population-level assays (VEGF: n = 6 biological replicates; collagen I: n = 4 biological replicates). Data are presented as mean ± SD. Welch’s two-sided t-test was performed to compare p5 and p15 for each assay. Statistical significance is indicated as follows: ****p < 0.0001, ***p < 0.001, **p < 0.01, *p < 0.05. Source data are provided as a Source Data file, and full statistical results are provided in Supplementary Data 1.
Finally, we analyzed the relationship between the therapeutic performance of hDFs and their label-free aging phenotypes using biochemical assays and NCC data. To enable a fair comparison, NCC metrics derived from single-cell measurements were normalized using batch-level means and standard deviations, aligning them with population-level protein data. To evaluate the directional association between aging phenotypes and therapeutic protein expression, we calculated the slope (tan θ) between group-mean values at p5 and p15 (Fig. 6M and N). Eccentricity and H2O2 efflux showed negative tan θ values, suggesting a potential association with reduced therapeutic performance. In contrast, RI showed a large tan θ despite a small phenotypic change, reflecting its potential sensitivity as an early aging indicator. These results suggest that NCC-derived phenotypes may capture functional changes associated with cellular aging, and that tan θ can be used as a simple metric to assess the relationship between aging phenotypes and therapeutic outcomes. In the future, if proteomic information can also be obtained at the single-cell level, more quantitative and mathematically rigorous correlation analyses would be feasible.
Discussion
In summary, we developed a label-free, high-throughput, single-cell analytical platform to assess aging heterogeneity and predict the therapeutic performance of hDFs. By just loading unlabeled hDFs into a microchannel integrated with an nIR fluorescent SWCNT sensor array, we extracted four key physicochemical phenotypes (cell size, shape, RI, and H2O2 efflux at femtomolar level) during aging at a high-throughput single-cell resolution by leveraging the nIR cell lensing effect. Using an AI-integrated form factor, we precisely quantified the four indicators from nIR images of more than 105 individual cells within 1 h. This overcomes the limitation of conventional physical cytometry, which cannot quantify the chemical properties of single cells, by enabling NCC to analyze both physicochemical properties during aging without labels (Supplementary Table 3). First, we characterized the aging of hDFs using conventional analytics, including SA-β-Gal activity assessment, MMP measurement, and qRT-PCR analysis to measure the expressions of IL6 and IL1β. By performing NCC, we discovered that the heterogeneity of size, eccentricity, RI, and H2O2 efflux of aging hDFs increased by 135.83%, 12.5%, 6.67%, and 96.30%, respectively. Changes in the size and RI were strongly correlated with aging, whereas H2O2 efflux showed the strongest correlation with size. Based on this finding, we derived a 3D aging trajectory that can quantitatively assess the aging status of hDFs, even when the passage number is unknown. Building on these trajectories, we developed a predictive model integrating KDE features, achieving over 77% accuracy in predicting aging stages of unknown subjects. Additionally, the model demonstrated its universal applicability by classifying cellular states in a chemically induced aging model derived from premature aging trajectories of hDFs. Finally, the results of RNA-seq analysis revealed that p5 exhibited higher expression of genes related to oxidative stress, wound healing, and ECM organization than p15. By correlating these performance factors to NCC phenotypes, we developed an empirical model that can predict the therapeutic performance of hDFs using only the aging phenotypes measured via NCC in a completely label-free manner. While genetic and environmental factors can influence cellular aging and lead to variations in aging trajectories, our study focused on hDFs under controlled conditions, varying only passage numbers to minimize unrelated factors. This approach ensures reliable analyses within a single cell type, such as in tissue therapy product development, where genetic and environmental variability has limited impact. For applications involving diverse cell types, separate models tailored to specific genetic or environmental contexts may be required, highlighting an important direction for future research.
Methods
Synthesis and characterization of nIR fluorescent nanosensor
HiPCOTM SWCNT (Unidym, Inc.) and a 30-base (GT) sequence of ssDNA (Integrated DNA Technologies) were mixed in a 1:1 mass ratio in DNase-free water. The mixture was sonicated for 30 min (3 mm tip diameter, 40% amplitude, 125 W, Cole Parmer) on a cool rack. Subsequently, it was centrifuged twice for 60 min (1730 R; Gyrozen Co., Ltd.) at a relative centrifugal force (RCF) of 16,000 g. The supernatant was obtained. Successful suspension of the nanosensor was confirmed via UV-Vis-nIR absorption spectroscopy (UV-2600i, Shimadzu Corporation). The concentration of the nanosensor in the dispersion was estimated using an extinction coefficient of ε632 nm = 0.036 (mg/L)−1, which resulted in a final concentration of 200 mg/L for the SWCNT/(GT)15 sensor dispersion. This concentration was used to integrate the nanosensors with the microfluidic channel experiments. The nIR spectrum of the nanosensor was obtained under a 721-nm laser excitation (MRL-FN-721-300 mW, CNI Optoelectronics Technology Co., Ltd.). The excited laser beam was passed through a SpectraPro HRS-300 spectrometer (Princeton Instruments) and monitored using a PyLoN-IR InGaAs spectroscopy detector (Princeton Instruments), cooled with liquid nitrogen. Subsequently, 20 μL of various concentrations of H2O2 solution were added to 180 μL of SWCNT/(GT)15 sensor solution, thus resulting in a total volume of 200 μL in a 96-well plate. After incubating the solution at room temperature for 30 min, its fluorescence intensity was measured in triplicate.
Fabrication and measurement associated with NCC
Two microliters of (3-Aminopropyl)triethoxysilane (APTES) (99% purity, Sigma Aldrich) mixed in an ethanol solution (2.5% APTES, 5% H2O) was injected into a microfluidic channel (μ-Slide VI 0.1, ibiTreat) and dried for 1 h at 75 °C in an oven. Following the APTES treatment, 2 μL of SWCNT dispersions were injected into the channel via a syringe. The channel was allowed to evaporate overnight. Subsequently, the surfaces coated with the SWCNT/(GT)15 sensors were washed twice with 1 mL of 1X phosphate-buffered saline (PBS) (Gibco BRL, Gaithersburg, MA, USA) to eliminate any uncombined nanosensors. Furthermore, we used commercially available fluidic channels instead of custom-designed ones, enabling other researchers to easily replicate the NCC setup using a standardized protocol. In-vitro experiments for H2O2 detection were conducted as follows: SWCNT/(GT)15 sensors were used as optical transducers for H2O2 detection, where nIR fluorescence was emitted when they were excited by a visible-range laser (e.g., 721 nm). H2O2 solution (30 wt.% in H2O, Sigma Aldrich) was diluted to 1 M with deionized water to investigate the chemical-sensing performance of the nanosensor-integrated microfluidics. The hDFs in the cell media from various prepared passages were injected at a concentration of 106 cells·mL−1, where 300 μL was injected into the microfluidic channel integrated with nanosensors. Cells were washed with PBS and resuspended in fresh media under strictly controlled room temperature conditions (~23 °C) to minimize pH and temperature effects on H2O2 sensing. Low-magnification nIR images of the microfluidic channel integrated with nanosensors were captured under a 721-nm laser excitation (MRL-FN-721-300 mW, CNI Optoelectronics Technology Co., Ltd, China) using an IX73P1F inverted microscope (OLYMPUS Co., Ltd.) equipped with the appropriate optical filters. Subsequently, nIR images were captured when the cells were stationary. To monitor the H2O2 efflux, additional nIR images were captured at the same location 10 min later. The nIR images captured were first adjusted using the CLAHE algorithm to ensure that the background brightness was uniform across the entire image60. Subsequently, AI was adopted to separate the cells from the background and to calculate the coordinates using the bounding box of the cell. By comparing the coordinates from the initial image with those from the image captured 10 min later, any cell with a coordinate difference greater than 1% was considered non-matching and thus excluded. For cells with matching coordinates, an elliptical mask was applied to the periphery of the cell for data acquisition. The cell size and eccentricity were determined based on the pixel count, with a pixel size of 1.497 μm2. The average intensity within the mask was used to calculate the H2O2 efflux within 10 min. Subsequently, the cell volume was calculated based on the cell area, assuming that the area represented a cross-section through the cell center. The femtomolar level of the H2O2 efflux was determined by multiplying the real-time local H2O2 concentration by the single-unit volume and then dividing it by the measurement time (10 min). FDTD calculations were performed using the Lumerical FDTD Solution (Lumerical Inc.) to model the lensing effect in hDFs under various conditions, including different cell RIs ranging from 1.345 to 1.43 in 0.005 increments and cell radii extending from 3 to 12.5 μm by 0.5 μm intervals. The wavelength range was set to 1000 nm, which corresponded to the reaction of the (6,5) chirality peak of the SWCNT/(GT)15 sensor with H2O2. The RI of the media (outside the cell) was set to 1.337, which is similar to the RI of the hDF media61.
Deep learning of NCC data
To identify cells within our dataset, we utilized the “Labeling” tool to annotate the cellular images, thereby facilitating the training of the yolov5l model using deep-learning techniques48. The model employs an array of convolution kernels to extract diverse features from the images for identifying areas without labels. Training was conducted over 300 epochs, with an early stopping mechanism implemented when no loss reduction was observed throughout 50 epochs. We applied the Adam optimization algorithm, trained the model in batches of 16 images, and evaluated its performance based on accuracy and F1 scores. The yolov5l model output encompassed bounding boxes, categories, and confidence scores. The bounding boxes provide spatial information regarding the location and size of objects within the images, whereas the categories predict the class to which these objects belong. The confidence score, which was set at a threshold of 0.50 for this experiment, probabilistically represented the accuracy of the predictions, with only those exceeding this threshold considered effective detections to ensure the reliability and precision of the results. During the preprocessing phase, images measuring 640 × 512 were cropped to 100 × 100, with an overlap of 20 pixels to prevent cell exclusion. Subsequent steps involved normalizing the intensity across all images to minimize variance. We employed Python’s linear-transformation techniques to adjust the mean intensity value of each image to the average intensity of the entire dataset, thereby enhancing the detection efficiency. This methodology enables the prediction frames surrounding each cell to display varying colors based on the cell type or specific chemicals emitted or absorbed by the cells, thus facilitating a more straightforward and rapid assessment of the cellular states. To predict hDF aging, we developed a predictive model using key cellular features. Five 3D aging trajectories-based features, including cell size, H2O2 efflux, and RI were first standardized using Z-score normalization. Density-based clustering methods, DBSCAN and K-Means, were applied to identify key clusters, from which cluster probabilities and maximum labels were derived. Additionally, eight KDE-based features, such as the distance from the center (Spread), heterogeneity index (EVt), and local mean density, were extracted. These 8 features were used for model training, with the dataset consisting of 6 passage stages (p5, p7, p9, p11, p13, and p15). The data were divided into training and validation sets in an 8:2 ratio. A Multi-Task Learning approach was employed, utilizing a network architecture with three hidden layers and an output layer. To address class imbalance, Focal Loss with class-specific weights and a WeightedRandomSampler were implemented. The model was trained for 500 epochs using the AdamW optimizer, warm-up scheduler, and cosine annealing. The trained model was then applied to predict the aging stages of unknown subjects 1–4, mapping their maximum density coordinates onto the 3D aging trajectories for quantitative evaluation of their aging states.
Cell sources and culture protocols
hDFs were purchased from Lonza (Basel, Switzerland) and cultured in Dulbecco’s modified eagle’s medium (Gibco BRL, Gaithersburg, MA, USA) supplemented with 10% (v/v) fetal bovine serum (FBS) (Gibco BRL, Gaithersburg, MA, USA, A3160601) and 1% (v/v) penicillin/streptomycin (Gibco BRL, Gaithersburg, MA, USA) at 37 °C with 5% CO2. Monocytes (U937, ATCC CRL-1593.2) cells were purchased from American Type Culture Collection (ATCC) and cultured according to the supplier’s protocol. U937 cells were maintained in RPMI-1640 medium (ATCC 30-2001) supplemented with 10% (v/v) FBS at 37 °C with 5% CO2. HUVECs were purchased from PromoCell (Heidelberg, Germany) and cultured in endothelial cell media (PromoCell, Heidelberg, Germany) supplemented with a growth-medium supplement mix (PromoCell, Heidelberg, Germany) at 37 °C with 5% CO2. The culture media for both cell types were changed every 2 d. HUVECs within four passages were used for the experiments. This study used commercially available human and animal cell lines, and therefore, inclusion and ethics considerations were not applicable.
Next-generation sequencing (NGS)
For NGS analysis, total RNA was isolated from hDFs. RNA quality was assessed using a Nanodrop 2000 spectrophotometer (Thermo Fisher Scientific, Waltham, MA, USA) and an Agilent 4000 TapeStation (Agilent Technologies, Santa Clara, CA). Only samples with an RNA integrity number (RIN) above 10 were selected for sequencing. cDNA libraries were prepared using QuantSeq 3’mRNA-seq Library Prep Kit FWD (Lexogen, Vienna, Austria, 192) and sequenced on the NextSeq 550 platform (Illumina). The resulting reads were trimmed for adapter sequence and low-quality sequence using BBDuk, and then aligned to the reference genome using Bowtie2, which was also used to determine gene counts.
R-based data analysis
Data analysis was conducted using R. Initially, RNA counts for two time points, p5 and p15, were preprocessed using the edgeR package by removing entries with zero counts and excluding genes with a total count of less than six across all samples. Subsequently, the RNA counts were normalized across groups using the trimmed mean of M-values method to facilitate further analysis before being converted to log2 counts per million. PCA was performed to calculate the principal components and eigenvalues using the FactoMineR and FactoExtra packages, and the library sizes were analyzed using R’s built-in functions. For differential expression analysis between the p5 and p15 RNA samples, empirical Bayes statistics from the limma package were used. Volcano plots were generated to visualize significant changes in expression, which highlighted genes with an absolute log fold change greater than 2 and a p-value less than 0.01, using the EnhancedVolcano package. Hierarchical clustering heatmaps were created using the heatmap package, where the Euclidean distance and ward.D2 method were used for calculations and clustering, respectively. Biological pathway enrichment analysis was performed using the MetaScape platform (http://metascape.org)62, and the resulting data were visualized. Bubble plots were built using SRplot63.
SA-β-Gal detection assay
CellEvent™ Senescence Green Detection Kit (Thermofisher, Waltham, MA, USA, C10850) was used for SA-β-Gal detection according to the manufacturer’s specifications. Briefly, 1 × 10⁵ cells were seeded into each well of six-well plates for fluorescence imaging, and 5 × 10³ cells were seeded into each well of a 96-well plate. After twenty-four hours of seeding, the cells were washed once with PBS (Gibco BRL, Gaithersburg, MA, USA) and fixed with a 4% paraformaldehyde solution. After fixation, the cells were washed once with 1% BSA in PBS, and the working solution was added. Subsequently, the plate was incubated at 37 °C for 2 h without CO2, and the cells were washed thrice with PBS. Fluorescence was measured using an ultraviolet-visible spectrophotometer (UV-Vis, Lambda40, Perkin Elmer, Schwerzenbach, Switzerland, Ex/Em = 490/514 nm), and images were captured to examine the mitochondrial fluorescence intensity using a fluorescence microscope (DFC 3000 G, Leica, Wetzlar, Germany).
TMRE-mitochondrial membrane potential assay
TMRE dye was used to stain the live cells using a TMRE-mitochondrial potential assay kit (Abcam, Cambridge, UK, ab113852,). The assay was performed according to manufacturer’s protocol. Briefly, 5 × 10³ cells were seeded into each well of a 96-well plate and treated with 50 nM TMRE. Subsequently, the plate was incubated at 37 °C for 30 min, and the fluorescence was measured using UV-Vis-nIR spectroscopy (Lambda40, Perkin Elmer, Ex/Em = 549/575 nm).
qRT-PCR analysis
qRT-PCR was performed to quantify the relative gene-expression levels of human-specific GAPDH, IL6, IL1β, MKI67, VEGFA, HGF, COL1A, and CDH1. The total RNAs were extracted from the samples using 1 mL of TRIzol reagent (Life Technologies, Inc., Carlsbad, CA, USA) and 200 μL of chloroform for each sample. The lysed samples were centrifuged at 12,000 g for 10 min at 4 °C. Each RNA pellet was washed with 75% (v/v) ethanol in water and then dried. After drying, the RNA samples were dissolved in RNase-free water. To perform qRT-PCR, an SsoAdvanceed™ Universal SYBR Green Supermix kit (Bio-Rad, Hercules, CA, USA, 1708882) and a CFX Connect™ real-time PCR detection system (Bio-Rad) was used. GAPDH was used as the internal control. Table 1 lists the primers used for qRT-PCR.
Telomere length analysis
qRT-PCR was used to determine changes in average telomere length based on ScienCell’s Absolute Human Telomere Length Quantification qPCR Assay Kit (ScienCell, Carlsbad, CA, USA, 8918). DNA was extracted utilizing buffers and spin columns following the AccuPrep® Genomic DNA Extraction Kit instructions provided by Bioneer (Bionner, Dajean, Republic of Korea, K-3032). For each DNA sample, two consecutive reactions were performed: the first to amplify a single-copy reference (SCR) gene and the second for the telomere sequence. The SCR primer set recognizes and amplifies a 100 bp-long region on human chromosome 17 and serves as a reference for data normalization. Both PCRs were performed in a final volume of 20 μL using 1 μL of reference/genomic DNA samples from patients and controls (5 ng), 2 μL of primer stock solution (telomere or SCR), 10 μL of 2 × qPCR FastStart Essential DNA Green Master Mix (Roche Diagnostics International), and 7 μL of nuclease-free water. The PCR conditions were as follows: 95 °C for 10 minutes followed by 32 cycles of: 95 °C for 20 s, 52 °C for 20 s, and 72 °C for 45 s. All reactions were run in duplicate.
Phalloidin staining
hDFs were seeded in six-well plates, fixed with a formaldehyde solution for 10 min, and then washed twice with PBS (Gibco BRL, Gaithersburg, MA, USA). After replenishment with PBS, Phalloidin L (Vector Laboratories Inc., Newark, CA, USA) was added to the samples for 10 min. After staining, the samples were washed twice with PBS and counterstained with DAPI. The cells were examined via fluorescence microscopy (DFC 3000 G, Leica).
Intracellular ROS staining and analysis
To stain the intracellular ROS, 2′,7-dichlorodihydrofluorescein diacetate (DCF-DA), (Invitrogen, Carlsbad, CA, USA, D339), which is a fluorescent indicator of ROS, was used. The cells were incubated with 10 μmol/L DCF in PBS (Gibco BRL, Gaithersburg, MA, USA) for 20 min at 37 °C. After incubation, the cells were washed twice with PBS and observed under a fluorescence microscope (DFC 3000 G; Leica). The concentration of the intracellular ROS was determined by measuring the fluorescence intensity (Ex/Em = 494/524 nm) using a Varioskan LUX multimode microplate reader (Thermo Fisher Scientific, Waltham, MA, USA). For flow cytometry, p5 and p15 were incubated with 10 μmol/L DCF in PBS (Gibco BRL, Gaithersburg, MA, USA) for 20 min at 37 °C. Subsequently, the hDFs were washed once with PBS, detached, and dissociated via treatment with Accutase (Gibco BRL, Gaithersburg, MA, USA) for 10 min at room temperature. The hDFs from each group were centrifuged for 5 min at 220 g and washed twice with PBS. Subsequently, p5 and p15 were transferred to test tubes containing 500 μL PBS at ratios of 10:0, 8:2, 5:5, 2:8, and 0:10.
Flow cytometry
Flow cytometry analysis was performed using FACS Aria Fusion (BD Biosciences, San Jose, CA, USA), and data were analyzed with FlowJo v.10 software (BD Biosciences, San Jose, CA, USA). hDFs were initially gated based on forward scatter area (FSC-A) and side scatter area (SSC-A) to exclude debris. Singlet cells were then gated based on FSC-A vs. FSC-H to remove highly fluorescent dead or aggregated cells. Single-cell populations were selected, followed by gating on DCFDA-positive populations based on FITC-A intensity plotted against FSC-A to assess ROS expression levels.
ELISA
To analyze the secretion of angiogenic paracrine factors, we used ELISA kits for human VEGF (DY293B; 1:120; P222558; clone not specified; R&D Systems, Minneapolis, MN, USA) and HGF (DY294; 1:180; P382450; clone not specified; R&D Systems, Minneapolis, MN, USA) according to the manufacturer’s instructions. Conditioned medium (CM) was obtained from p5 and p15. The optical density (OD) value of each well was measured at 450 nm using a microplate reader (correction at 540 nm; Tecan).
Western blotting analysis
hDFs were collected and lysed in radioimmunoprecipitation assay buffer (Rockland Immunochemicals Inc., Limerick, PA, USA). After centrifugation at 10,000 g for 10 min, the supernatant was used as a protein extract. Protein concentrations were determined using a bicinchoninic acid assay (Pierce Biotechnology, Rockford, IL, USA). The same proteins from each sample were mixed with a sample buffer, loaded, and subjected to sodium dodecyl sulfate-polyacrylamide gel electrophoresis (SDS-PAGE; Hercules, CA, USA) using a 10% (v/v) resolving gel. Proteins separated by SDS-PAGE were transferred to immuno-blot polyvinylidene fluoride membranes (Bio-Rad) and probed with antibodies against GAPDH (ab9485; 1:2000; lot not specified; polyclonal; Abcam, Cambridge, UK), Fibronectin (ab268022; 1:1000; 1059939; clone EPR23110-46; Abcam, Cambridge, UK), collagen type I (ab34710; 1:1000; lot not specified; polyclonal; Abcam, Cambridge, UK), and SM-α (ab5694; 1:400; lot not specified; polyclonal; Abcam, Cambridge, UK) at 4 °C overnight. Membranes were then incubated with horseradish peroxidase-conjugated secondary antibodies against GAPDH, collagen type I, and SM-α (HAF008; 1:1000; FIN2023051; polyclonal Goat IgG; R&D Systems, Minneapolis, MN, USA), and against fibronectin (HAF007; 1:1000; FIM3222041; polyclonal Goat IgG; R&D Systems, Minneapolis, MN, USA) at room temperature for 1 h. Blots were then incubated in the dark. Luminescence was recorded on an x-ray blue film (Agfa Healthcare NV, Mortsel, Belgium). Bands were imaged using an Image Studio Lite (LI-COR Biosciences, OR, USA).
HUVEC tube formation and migration assay
Tube formation by HUVECs was assessed using an angiogenesis assay kit in-vitro (Abcam, Cambridge, UK, ab204276) according to the manufacturer’s protocol. The CM extracted from each group was mixed with the HUVEC medium at a 1:1 ratio and then used to treat HUVECs cultured on a pre-coated Matrigel. For the migration assay, the CM extracted from each group was mixed with the HUVEC medium at a 1:1 ratio and used to treat the scratched HUVEC. A straight scratch was created on the HUVEC layer using a P1000 pipette tip (Neptune Scientific, San Diego, CA, USA). After incubation for 0 and 24 h, the gap widths of the scratch repopulations were measured and compared with the initial gap size at 0 h. The size of the denuded area was determined at each time point from each digital image using Adobe Photoshop CC (Adobe Systems, San Jose, CA, USA).
Statistical analysis
All data are presented as mean ± standard deviation. Statistical analyses were performed using the GraphPad Prism software (GraphPad Software, San Diego, CA, USA). One-way analysis of variance and an unpaired Student’s t-test were performed to determine the statistical significance. Differences with p < 0.001, p < 0.01, and p < 0.05 compared with the control were considered significant.
Reporting summary
Further information on research design is available in the Nature Portfolio Reporting Summary linked to this article.
Data availability
The RNA-seq data generated in this study have been deposited in the NCBI GEO database under accession code GSE297406. The raw nIR images of hDFs used for single-cell analysis are available via Figshare [https://doi.org/10.6084/m9.figshare.29087852.v1]. Source data are provided with this paper. Any remaining information can be obtained from the corresponding author upon reasonable request. Source data are provided with this paper.
Code availability
The source code used for cell detection, feature extraction, and passage number prediction is available in the GitHub repository NCC_Code [https://github.com/Youngho-Cholab/NCC_Code] under the MIT License, and is citable via Zenodo [https://doi.org/10.5281/zenodo.15695547]. All NCC-related data were generated from raw nIR images using this code.
References
-
De Pieri, A., Rochev, Y. & Zeugolis, D. I. Scaffold-free cell-based tissue engineering therapies: advances, shortfalls and forecast. NPJ Regen. Med 6, 18 (2021).
-
Trubelja, A., Kasper, F. K., Farach-Carson, M. C. & Harrington, D. A. Bringing hydrogel-based craniofacial therapies to the clinic. Acta Biomaterialia 138, 1–20 (2022).
-
Schmidt, C. Gintuit cell therapy approval signals shift at US regulator. Nat. Biotechnol. 30, 479 (2012).
-
Schurr, M. J. et al. Phase I/II clinical evaluation of StrataGraft: a consistent, pathogen-free human skin substitute. J. Trauma 66, 866–874 (2009).
-
Shou, Y. et al. Dynamic stimulations with bioengineered extracellular matrix-mimicking hydrogels for mechano cell reprogramming and therapy. Adv. Sci. 10, e2300670 (2023).
-
Stunova, A. & Vistejnova, L. Dermal fibroblasts-A heterogeneous population with regulatory function in wound healing. Cytokine Growth Factor Rev. 39, 137–150 (2018).
-
Tracy, L. E., Minasian, R. A. & Caterson, E. J. Extracellular matrix and dermal fibroblast function in the healing wound. Adv. Wound Care (N. Rochelle 5, 119–136 (2016).
-
Tai, C. et al. Human skin dermis-derived fibroblasts are a kind of functional mesenchymal stromal cells: judgements from surface markers, biological characteristics, to therapeutic efficacy. Cell Biosci. 12, 105 (2022).
-
Molina, E. A. et al. Angiogenic gene characterization and vessel permeability of dermal microvascular endothelial cells isolated from burn hypertrophic scar. Sci. Rep. 12, 12222 (2022).
-
Lu, H. et al. Cultured cell-derived extracellular matrix scaffolds for tissue engineering. Biomaterials 32, 9658–9666 (2011).
-
Malakpour-Permlid, A. et al. Identification of extracellular matrix proteins secreted by human dermal fibroblasts cultured in 3D electrospun scaffolds. Sci. Rep. 11, 6655 (2021).
-
Mascharak, S. & Longaker, M. T. Fibroblast heterogeneity in wound healing: hurdles to clinical translation. Trends Mol. Med. 26, 1101–1106 (2020).
-
Talbott, H. E., Mascharak, S., Griffin, M., Wan, D. C. & Longaker, M. T. Wound healing, fibroblast heterogeneity, and fibrosis. Cell Stem Cell 29, 1161–1180 (2022).
-
Salzer, M. C. et al. Identity noise and adipogenic traits characterize dermal fibroblast aging. Cell 175, 1575–1590 (2018).
-
Capelli, C. et al. Potency assays and biomarkers for cell-based advanced therapy medicinal products. Front Immunol. 14, 1186224 (2023).
-
Ge, M. X. et al. Multiple time-series expression trajectories imply dynamic functional changes during cellular senescence. Comput Struct. Biotechnol. J. 20, 4131–4137 (2022).
-
Tabula, T. he & Consortium, M. uris A single-cell transcriptomic atlas characterizes ageing tissues in the mouse. Nature 583, 590–595 (2020).
-
Gasek, N. S., Kuchel, G. A., Kirkland, J. L. & Xu, M. Strategies for Targeting Senescent Cells in Human Disease. Nat. Aging 1, 870–879 (2021).
-
De Luca, M. et al. Advances in stem cell research and therapeutic development. Nat. Cell Biol. 21, 801–811 (2019).
-
FDA. Potency Assurance for Cellular and Gene Therapy Products. Draft Guidance for Industry, 89707-89709 (2023).
-
Salmikangas, P., Carlsson, B., Klumb, C., Reimer, T. & Thirstrup, S. Potency testing of cell and gene therapy products. Front Med (Lausanne) 10, 1190016 (2023).
-
Lee, Y. & Shivashankar, G. V. Analysis of transcriptional modules during human fibroblast ageing. Sci. Rep. 10, 19086 (2020).
-
Gerasymchuk, M., Robinson, G. I., Kovalchuk, O. & Kovalchuk, I. Modeling of the Senescence-Associated Phenotype in Human Skin Fibroblasts. Int. J. Mol. Sci. 23 (2022).
-
Chung, K. W. et al. Molecular insights into sirt1 protection against uvb-induced skin fibroblast senescence by suppression of oxidative stress and p53 acetylation. J. Gerontol. A Biol. Sci. Med Sci. 70, 959–968 (2015).
-
Cohn, R. L., Gasek, N. S., Kuchel, G. A. & Xu, M. The heterogeneity of cellular senescence: insights at the single-cell level. Trends Cell Biol. 33, 9–17 (2023).
-
Kirschner, K., Rattanavirotkul, N., Quince, M. F. & Chandra, T. Functional heterogeneity in senescence. Biochem Soc. Trans. 48, 765–773 (2020).
-
Weinmullner, R. et al. Organotypic human skin culture models constructed with senescent fibroblasts show hallmarks of skin aging. NPJ Aging Mech. Dis. 6, 4 (2020).
-
Hiramatsu, K. et al. High-throughput label-free molecular fingerprinting flow cytometry. Sci. Adv. 5, eaau0241 (2019).
-
Song, Y. et al. Nanosensor chemical cytometry: advances and opportunities in cellular therapy and precision medicine. ACS Meas. Sci. Au 3, 393–403 (2023).
-
Cho, S. Y. et al. Cellular lensing and near infrared fluorescent nanosensor arrays to enable chemical efflux cytometry. Nat. Commun. 12, 3079 (2021).
-
Cho, S. Y. et al. Nanosensor chemical cytometry for characterizing the efflux heterogeneity of nitric oxide from macrophages. ACS Nano 15, 13683–13691 (2021).
-
Zhu, J. & Goddard, L. L. All-dielectric concentration of electromagnetic fields at the nanoscale: the role of photonic nanojets. Nanoscale Adv. 1, 4615–4643 (2019).
-
Sareen, N. et al. Early passaging of mesenchymal stem cells does not instigate significant modifications in their immunological behavior. Stem Cell Res Ther. 9, 121 (2018).
-
Varani, J. et al. Human skin in organ culture and human skin cells (keratinocytes and fibroblasts) in monolayer culture for assessment of chemically induced skin damage. Toxicol. Pathol. 35, 693–701 (2007).
-
Zhao, A. G., Shah, K., Freitag, J., Cromer, B. & Sumer, H. Differentiation Potential of Early- and Late-Passage Adipose-Derived Mesenchymal Stem Cells Cultured under Hypoxia and Normoxia. Stem Cells Int. 2020, 8898221 (2020).
-
Dimri, G. P. et al. A biomarker that identifies senescent human cells in culture and in aging skin in vivo. Proc. Natl Acad. Sci. 92, 9363–9367 (1995).
-
Debacq-Chainiaux, F., Erusalimsky, J. D., Campisi, J. & Toussaint, O. Protocols to detect senescence-associated beta-galactosidase (SA-betagal) activity, a biomarker of senescent cells in culture and in vivo. Nat. Protoc. 4, 1798–1806 (2009).
-
Miwa, S., Kashyap, S., Chini, E. & von Zglinicki, T. Mitochondrial dysfunction in cell senescence and aging. J. Clinical Invest. 132 (2022).
-
Bernadotte, A., Mikhelson, V. M. & Spivak, I. M. Markers of cellular senescence. Telomere shortening as a marker of cellular senescence. Aging (Albany NY) 8, 3 (2016).
-
Lee, Y. I., Choi, S., Roh, W. S., Lee, J. H. & Kim, T.-G. Cellular Senescence and Inflammaging in the Skin Microenvironment. Int. J. Mol. Sci. 22, 3849 (2021).
-
Wei, X. et al. Senescence in chronic wounds and potential targeted therapies. Burns & Trauma 10 (2022).
-
Coppé, J.-P., Desprez, P.-Y., Krtolica, A. & Campisi, J. The Senescence-Associated Secretory Phenotype: The Dark Side of Tumor Suppression. Annu. Rev. Pathol.: Mechanisms Dis. 5, 99–118 (2010).
-
Coppé, J.-P. et al. A human-like senescence-associated secretory phenotype is conserved in mouse cells dependent on physiological oxygen. PLOS ONE 5, e9188 (2010).
-
Uxa, S. et al. Ki-67 gene expression. Cell Death Differ. 28, 3357–3370 (2021).
-
Cristofalo, V. J., Lorenzini, A., Allen, R. G., Torres, C. & Tresini, M. Replicative senescence: a critical review. Mechanisms Ageing Dev. 125, 827–848 (2004).
-
Chen, Q. & Ames, B. N. Senescence-like growth arrest induced by hydrogen peroxide in human diploid fibroblast F65 cells. Proc. Natl Acad. Sci. 91, 4130–4134 (1994).
-
Meyer, P. et al. A model of the onset of the senescence associated secretory phenotype after DNA damage induced senescence. PLOS Computational Biol. 13, e1005741 (2017).
-
Song, Y. Unveiling aging heterogeneities in human dermal fibroblasts via nanosensor chemical cytometry. NCC_Code, Zenodo, https://doi.org/10.5281/zenodo.15695547 (2025).
-
Kubheka, S. & Ajoodha, R. in 2023 International Conference on Electrical, Computer and Energy Technologies (ICECET). 1-6 (2023).
-
Han, S., Lee, Y., Kim, J. & Cho, S.-Y. Physicochemical Profiling of Macrophage Heterogeneity Using Deep Learning Integrated Nanosensor Cytometry. ACS Sens 8, 1676–1683 (2023).
-
Duan, J., Duan, J., Zhang, Z. & Tong, T. Irreversible cellular senescence induced by prolonged exposure to H2O2 involves DNA-damage-and-repair genes and telomere shortening. Int. J. Biochem. Cell Biol. 37, 1407–1420 (2005).
-
Lew, T. T. S. et al. Real-time detection of wound-induced H(2)O(2) signalling waves in plants with optical nanosensors. Nat. Plants 6, 404–415 (2020).
-
Wu, H. et al. Monitoring Plant Health with Near-Infrared Fluorescent H2O2 Nanosensors. Nano Lett. 20, 2432–2442 (2020).
-
Chen, Z., Taflove, A. & Backman, V. Photonic nanojet enhancement of backscattering of light by nanoparticles: a potential novel visible-light ultramicroscopy technique. Opt. Express 12, 1214–1220 (2004).
-
Neurohr, G. E. et al. Excessive Cell Growth Causes Cytoplasm Dilution And Contributes to Senescence. Cell 176, 1083–1097.e1018 (2019).
-
Schurmann, M., Scholze, J., Muller, P., Guck, J. & Chan, C. J. Cell nuclei have lower refractive index and mass density than cytoplasm. J. Biophotonics 9, 1068–1076 (2016).
-
Ruder, S. An overview of multi-task learning in deep neural networks. arXiv preprint arXiv:1706.05098 (2017).
-
Kiyoshima, T. et al. Oxidative stress caused by a low concentration of hydrogen peroxide induces senescence-like changes in mouse gingival fibroblasts. Int. J. Mol. Med. 30, 1007–1012 (2012).
-
Demidova-Rice, T. N., Durham, J. T. & Herman, I. M. Wound healing angiogenesis: innovations and challenges in acute and chronic wound healing. Adv. Wound Care 1, 17–22 (2012).
-
Zuiderveld, K. Contrast limited adaptive histogram equalization. In Graphics Gems IV (ed. Heckbert, P. S.) 474–485 (Academic Press, 1994).
-
Xin, Z. et al. High-performance imaging of cell-substrate contacts using refractive index quantification microscopy. Biomed. Opt. Express 11, 7096–7108 (2020).
-
Zhou, Y. et al. Metascape provides a biologist-oriented resource for the analysis of systems-level datasets. Nat. Commun. 10, 1523 (2019).
-
Tang, D. et al. SRplot: a free online platform for data visualization and graphing. PLoS One 18, e0294236 (2023).
Acknowledgements
This project was conducted with the support of the Alchemist Project of the Korea Evaluation Institute of Industrial Technology (KEIT 20018560, NTIS 2410005252) funded by the Ministry of Trade, Industry & Energy (MOTIE, Korea, S.-Y. C. and S. H. B.). This study was also supported by the National Research Foundation (NRF) grants funded by the Korean government (MSIT) (RS-2023-00211580, S.-Y. C. and RS-2024-00405818, S.H.B.).
Ethics declarations
Competing interests
The authors declare no competing interests.
Peer review
Peer review information
Nature Communications thanks the anonymous reviewer(s) for their contribution to the peer review of this work. A peer review file is available.
Additional information
Publisher’s note Springer Nature remains neutral with regard to jurisdictional claims in published maps and institutional affiliations.
Supplementary information
Source data
Rights and permissions
Open Access This article is licensed under a Creative Commons Attribution-NonCommercial-NoDerivatives 4.0 International License, which permits any non-commercial use, sharing, distribution and reproduction in any medium or format, as long as you give appropriate credit to the original author(s) and the source, provide a link to the Creative Commons licence, and indicate if you modified the licensed material. You do not have permission under this licence to share adapted material derived from this article or parts of it. The images or other third party material in this article are included in the article’s Creative Commons licence, unless indicated otherwise in a credit line to the material. If material is not included in the article’s Creative Commons licence and your intended use is not permitted by statutory regulation or exceeds the permitted use, you will need to obtain permission directly from the copyright holder. To view a copy of this licence, visit http://creativecommons.org/licenses/by-nc-nd/4.0/.
About this article

Cite this article
Song, Y., Seo, I., Tian, C. et al. Unveiling aging heterogeneities in human dermal fibroblasts via nanosensor chemical cytometry. Nat Commun 16, 6276 (2025). https://doi.org/10.1038/s41467-025-61590-8
-
Received:
-
Accepted:
-
Published:
-
DOI: https://doi.org/10.1038/s41467-025-61590-8