
Introduction
Polystyrene (PS) is widely used in multiple commercial and consumer applications, including packaging, construction, and electronics that benefit from its durability, low weight, and insulating properties. In 2022, the global annual consumption of PS was 18 million metric tons (MMT)1,2, accounting for 6% of total global plastic production3. According to data from the US EPA, the lack of post-consumer recycling infrastructure for PS4 resulted in 91% of PS in the U.S. (2.8 MMT) being landfilled and 8.5% incinerated in 20195, though some amount of recycling may not be captured in these numbers6. Consequently, new methods for PS mechanical recycling and chemical recycling to monomers are gaining significant attention4,7. Advances have been made in the densification of expanded polystyrene (EPS) foam using solvent-based and mechanical techniques, which facilitate subsequent mechanical recycling4. Pyrolysis methods to convert PS to styrene8,9 include advances by Schmidt10 and Agilyx11.
Efforts to convert PS into other aromatic chemicals are the focus of growing attention12,13,14,15,16,17,18,19 and have led to multiple oxidation methods that convert PS into benzoic acid14,20,21,22. Recent studies have primarily featured photochemical methods, which generate benzoic acid in yields up to 73%23,24,25,26,27,28,29,30,31. Over 20 years ago, Partenheimer demonstrated that PS can be converted to benzoic acid with an 88% yield via catalytic autoxidation with a Co/Mn/Br/Zr co-catalyst in acetic acid20, conditions that closely resemble the commercial mid-century (MC) process for conversion of p-xylene to terephthalic acid32. These conditions, however, lead to additional process costs arising from the need to recover acetic acid by distillation. In addition, the insolubility of PS in acetic acid at autoxidation temperature hinders the oxidative reactivity of the polymer33. Use of benzoic acid as a solvent could address both limitations. Benzoic acid is the product of PS autoxidation, and its use as a solvent for the process could overcome the limitations of acetic acid and simplify the overall process. Benzoic acid readily dissolves PS33 and would enable the oxidation reaction to occur in a homogeneous solution, potentially improving the autoxidation kinetics and/or reducing the solvent demand by allowing for higher substrate loading during the reaction. While substitution of acetic acid with benzoic acid as a solvent for PS autoxidation has been previously suggested34,35,36, we are not aware of experimental demonstrations.
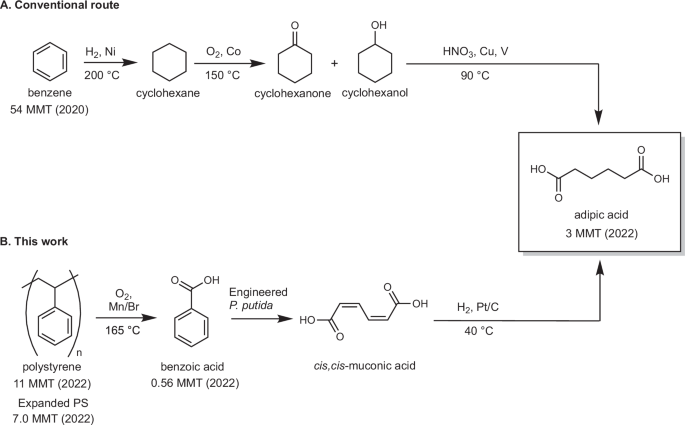
The appeal of improving the conversion of PS into benzoic acid is offset by the mismatch in the commercial market for benzoic acid (0.56 MMT/year)37 and to the annual volume of PS waste (3.1 MMT in the U.S. in 2019)5. This mismatch means that benzoic acid will need to be converted into one or more other products with higher market demand37,38,39. Microbial aromatic catabolism provides an efficient strategy to convert benzoic acid into muconic acid40,41,42,43,44,45, which may be readily converted into existing commodity chemicals, including adipic acid, terephthalic acid, adiponitrile, acrylic acid, and caprolactam46,47,48, or used directly in performance-advantaged bioproducts21,49,50,51,52,53,54. Hydrogenation of muconic acid to produce adipic acid43,55,56,57, one of the two co-monomers in nylon 6,6, is particularly appealing. Adipic acid has a growing market demand (3 MMT globally in 2022) that is well-matched to the volume of PS waste5,58. Adipic acid is currently produced via benzene hydrogenation to cyclohexane, cyclohexane autoxidation to KA oil (a mixture of cyclohexanone and cyclohexanol), and oxidation of KA oil with HNO3 with Cu/V co-catalysts (Fig. 1A)59. The KA oil oxidation step generates substantial greenhouse gases (GHGs: N2O, CO, and CO2)60 and would be ideally replaced with a more sustainable chemical pathway for adipic acid production.

A Primary production route to adipic acid from petrochemically-derived benzene. B Proposed route in this work from PS waste to benzoic acid, bioconversion to muconic acid, and hydrogenation to adipic acid.
In this work, we demonstrate the conversion of PS to adipic acid via a hybrid chemical and biological process, involving PS autoxidation to benzoic acid, bioconversion of benzoic acid to muconic acid, and hydrogenation of muconic acid to adipic acid (Fig. 1B). The PS autoxidation conditions are optimized to enable use of a benzoic acid and water co-solvent system instead of acetic acid and to simplify the previously reported Co/Mn/Zr/Br catalyst system to a composition that only consists of Mn/Br20,61,62. Benzoic acid obtained from PS autoxidation undergoes biological conversion to cis,cis-muconic acid using the engineered microbe Pseudomonas putida KT2440-CJ074. Finally, adipic acid is obtained via Pt/C-catalyzed hydrogenation of muconic acid. The economic feasibility and environmental impacts of the proposed pathways for both benzoic acid and adipic acid is evaluated using techno-economic analysis (TEA) and life cycle assessment (LCA). The results highlight the merits of this approach, in addition to illuminating further opportunities for improvement of these pathways to produce benzoic, muconic, and adipic acids as products.
Results
PS deconstruction to benzoic acid
Autoxidation of PS to benzoic acid has been previously demonstrated in acetic acid using a Co/Mn/Br/Zr catalyst system and under related MC-like process conditions14,20,21. To examine the feasibility of using benzoic acid as a reaction solvent, we compared PS autoxidation in acetic acid and benzoic acid under identical conditions: 0.45 g of PS beads (Mn 91.0 kg/mol, Ð = 2.9)63, 165 °C, 7 bar partial O2 pressure, and catalyst loadings of 3.6 wt% Co(OAc)2, 3.6 wt% Mn(OAc)2, and 4.0 wt% NaBr relative to the PS mass (resembling loadings used in previous PS autoxidation studies20,21). Initial experiments using 1.0 g of each solvent revealed that PS has poor solubility in acetic acid, even at elevated temperature. The polymer beads aggregated, and no formation of benzoic acid was observed during the reaction in acetic acid. PS was still insoluble in 10 g of acetic acid, but this condition enabled benzoic acid production. Thus, we used this condition to perform the control experiment. PS showed good solubility in benzoic acid at 165 °C and did not require adjustment of the solvent quantity. A comparison of these two experiments (Fig. 2A) showed that the use of benzoic acid as the solvent increases both the rate and yield of PS-derived benzoic acid, relative to the reaction performed in acetic acid. The yield of benzoic acid is defined by the molar ratio of PS-derived benzoic acid relative to the aromatic monomer units present in PS. The amounts of benzoic acid were quantified with ultra-high performance liquid chromatography with diode array detection (UHPLC-DAD)64 (for the reaction in benzoic acid, the solvent used in the reaction was subtracted from the total benzoic acid present at the end of the reaction). The lower rate in acetic acid is likely affected by the poor solubility of PS in acetic acid at 165 °C.

A Comparison of benzoic acid (green) and acetic acid (orange) as solvents for PS oxidation. Reaction conditions: PS (Mn 91.0 kg/mol, Ð = 2.9) 0.45 g, benzoic acid 1.0 g or acetic acid 10 g, Co/Mn/Br co-catalyst (3.6, 3.6, and 4.0 wt%, relative to the PS mass), 165 °C, 2 h, O2 7 bar/N2 53 bar at RT. B Benzoic acid yields when using various catalyst systems. For Co/Mn/Br co-catalyst, a loading of 3.6, 3.6, and 4.0 wt% (relative to the PS mass) is used, respectively. For other catalyst systems, the loadings of Co(OAc)2, Mn(OAc)2, and NaBr are 7.1 wt%, 7.1 wt%, and 4.0 wt%, respectively. C Effect of NaBr loading from 0 to 6.2 wt% at 7.1 wt% Mn(OAc)2. D Influence of the PS mass loading in benzoic acid on the reaction performance. E Reaction profile when using benzoic acid and H2O as co-solvents. The data are presented as mean values. The error bars represent the standard deviation from triplicates in (A–E), and the bar in (C, D) represents the range of yields obtained from duplicates. F Photos of post-consumer PS used in autoxidation reactions and the corresponding yields of benzoic acid. Reaction conditions: Post-consumer PS 0.45 g, benzoic acid 1.0 g with water 1.0 g, Mn(OAc)2 7.1 wt%, NaBr 1.0 wt%, 165 °C, 4 h, O2 7 bar/N2 53 bar at RT. Source data are provided as a Source data file.
The promising initial result obtained with benzoic acid as a solvent provided the basis for further optimization of the catalyst composition. A Mn/Br co-catalyst (7.1 wt% and 4.0 wt%, respectively) led to a yield of 78% in benzoic acid solvent (Fig. 2B), comparable to that obtained with the Co/Mn/Br co-catalyst system. The reaction time courses with the Co/Mn/Br and Mn/Br co-catalysts showed similar trends from 0.5 to 3 h (Fig. S1), indicating that Co is not an essential co-catalyst in this autoxidation reaction. Use of a Co/Br catalyst system resulted in only a 5% yield, and individual Co and Mn catalysts lacking bromide also performed poorly (Fig. 2B). Variation of the Mn(OAc)2 loading at 4.0 wt% NaBr showed that 7.1 wt% exhibited the optimal rate and product yield of benzoic acid (Fig. S2).
The NaBr loading has a substantial impact on benzoic acid production, with data showing a trade-off between rate and yield. Higher yields of benzoic acid were observed at higher NaBr loadings at 0.5 h, but deviations from this trend were evident at longer times. The best yield of 94% benzoic acid was observed with 2.0 wt% loading of NaBr at 2 h (Fig. 2C), with a decrease in yield at longer times. Overall, the trends in Fig. 2C indicate that NaBr accelerates the formation of benzoic acid but can also contribute to its decomposition. The oxidative sensitivity of benzoic acid has also been observed in PS oxidation by nitric acid22, and control experiments show that benzoic acid decomposes in the absence of PS under the present conditions (Fig. S3). Overall, these data show that a Mn/Br co-catalyst system with benzoic acid as the solvent enables improved rate and yield of PS depolymerization (94% yield after 2 h at 165 °C) relative to previously reported conditions with a Co/Mn/Br/Zr co-catalyst system in acetic acid (88% yield after 5 h at 180 °C)20. The results also enable a significant reduction in solvent demand by supporting reaction performance at 0.45 g PS/g benzoic acid rather than the 0.036 g PS/g acetic acid in the previous report.
Efforts to increase the PS mass loading beyond 0.45 g PS/g benzoic acid led to suboptimal outcomes (Fig. 2D), and no benzoic acid was formed in the absence of added solvent. Analysis of reaction products by gel permeation chromatography (GPC) reinforced these observations. Under the optimized reaction conditions (0.45 g PS/g benzoic acid, 7.1 wt% Mn(OAc)2, 2.0 wt% NaBr; cf. orange trace in Fig. 2D), the product mixture features a broad molar mass distribution at 0.5 h, but rapidly converges to products with molar masses less than 590 g/mol by 1 h (Figs. S4 and S5). GPC analysis of the reaction with a 1.3 g PS/g benzoic acid mass loading showed high molecular weight products were still present at 1 h (Fig. S6).
PS deconstruction with H2O co-solvent to improve the process
The TEA presented below revealed that the exothermic reaction under high PS loadings in benzoic acid could lead to challenges with heat management at scale. A potential solution to this problem is the use of a co-solvent with lower boiling point. Water is the ideal option. Previous studies of MC oxidation of methylbenzene derivatives indicated that the reaction can proceed with 5–20 wt% water in acetic acid, albeit at a slower rate61,65. Similar observations were made in the present system upon addition of 1.0 g of water to the standard reaction conditions, containing 0.45 g PS/1.0 g benzoic acid. A decrease in rate was observed, but a 94% yield of benzoic acid yield was still obtained at 3 h (Fig. 2E). Due to the process advantages of this co-solvent system (elaborated below), these conditions were adopted for the oxidative deconstruction of post-consumer PS samples. Post-consumer PS contains various additives that could affect autoxidation reaction outcomes, and thus we evaluated the depolymerization of post-consumer PS products, including white EPS, black EPS, a white coffee cup lid, and a yellow container, all of which were characterized thoroughly66. For EPS autoxidation using a co-solvent system consisting of an equal ratio of benzoic acid and H2O, a benzoic acid yield of 84% was obtained at 4 h (Fig. 2F), showing an increasing trend in benzoic acid yield over time (Fig. S7). Under the same reaction condition for EPS, the autoxidation of black EPS, the white coffee cup lid, and the yellow container resulted in yields of 88%, 94%, and 90%, respectively. Thus, the autoxidation using benzoic acid as a solvent can efficiently deconstruct PS products as well, achieving high benzoic acid yields despite the presence of unknown additives. Since the purity of each post-consumer PS sample and the substrate sizes (Fig. S8) were different, the optimal reaction time to achieve the highest yield would also vary.
Benzoic acid recovery from EPS oxidation
To isolate benzoic acid for bioconversion to muconic acid, the reaction mixture obtained from white EPS oxidation (cf. Fig. 2F, 84% crude yield) was subjected to vacuum distillation at 200 °C for 0.5 h (Fig. S9). This process led to high recovery of the benzoic acid product (82% isolated yield). The product purity was measured by differential scanning calorimetry (DSC) melting point analysis and found to be 99.84%, similar to the purity of commercially available benzoic acid (99.89%, Table S1). Recrystallization of this material resulted in an improved purity of 99.98%. Elemental analysis with inductively coupled plasma optical emission spectroscopy (ICP-OES) and mass spectroscopy (ICP-MS) showed negligible Mn content (below the detection limit) and a Br content of 0.004 wt%, which is sufficiently low to have no impact on the bioprocess (vide infra, Table S2).
Bioconversion of EPS-derived benzoic acid to muconate
The purified benzoic acid was converted to muconate using an engineered strain P. putida KT2440-CJ074. In this strain, strong, constitutive, and chromosomal overexpression of the gene encoding CatA-I, a catechol 1,2-dioxygenase, enables conversion of benzoate-derived catechol to muconate that subsequently accumulates due to catB deletion (Fig. 3A)56. In shake flask experiments, P. putida KT2440-CJ074 showed similar growth profiles on either 20 mM of commercially available benzoate or substrate from EPS autoxidation, and when glucose was provided as a carbon and energy source (Fig. 3B, C). Transient catechol accumulation was higher in cultivations with EPS-derived substrate (1.8 ± 1.1 mM) but quantitative molar conversion of benzoate to muconate was achieved on both substrates.

A Metabolic pathway from benzoate to cis,cis-muconate in P. putida KT2440-CJ074 (genotype: P. putida KT2440 ∆catRBC::Ptac:catA1 ∆pcaHG). Shake flask cultivations with P. putida KT2440-CJ074 in M9 minimal medium supplemented with glucose and either (B) commercial benzoic acid (solid lines) or (C) substrate from the autoxidation of post-consumer EPS (dashed lines). The data are presented as mean values. Error bars represent the standard deviation across three biological replicates. D Bioreactor cultivations with P. putida KT2440-CJ074 fed with commercial benzoate (solid lines) and substrate from the autoxidation of EPS (dashed lines) using a dissolved oxygen (DO)-stat fed-batch strategy. Bacterial growth was tracked as optical density at 600 nm (OD600). Data from singlet experiments are reported. Source data are provided as a Source data file.
After confirming the successful bioconversion of deconstructed EPS to muconate in flasks, we scaled up the process to 0.5 L bioreactors. As a control, we simultaneously tested the conversion of pure benzoate under the same cultivation conditions to ascertain whether the accumulation of any potential toxic by-product(s) from the EPS-derived stream would affect the bioprocess. A dissolved oxygen (DO)-stat fed-batch strategy was used in this experiment to intermittently feed benzoate and glucose in small doses (Figs. S10 and S11). This feeding strategy is generally effective for maximizing titers and yields while preventing substrate accumulation, particularly when (1) substrates are toxic and (2) a continuous feeding rate has not been established. However, this approach inherently limits productivity. Bacterial growth and muconate production followed the same values and trends for both commercial and EPS-derived benzoates, achieving ca. 30 g/L (232 mM and 211 mM, respectively) after 80 h (solid and dashed green lines, Fig. 3D). Muconate productivity was 0.4 g/L/h from EPS, with molar yields of ca. 96% in both cases. Together, these data show that EPS-derived substrate lack impurities that might inhibit the bioprocess in the tested conditions.
Hydrogenation of muconic acid to adipic acid
Muconate produced in the bioreactors from EPS was separated and purified using activated carbon treatment, as described in our previous report43. The purified muconic acid was used to produce adipic acid through hydrogenation with Pt/C (5 wt%) at 40 °C and 20 bar H2. 150 mg of muconic acid in 15 g of ethanol was converted to adipic acid, showing a quantitative yield within 7.5 min (Fig. S12), similar to previous reports43,56,57. After the removal of ethanol, the purity of adipic acid, as measured by DSC, was 99.64% (Table S1), confirming that adipic acid of high purity can be obtained.
TEA and LCA for PS deconstruction and conversion
With the successful chemical and biological conversion of PS to adipic acid at the bench scale, an economic and environmental analysis was conducted to understand how the technology could perform at an industrial scale. Conceptual process models for PS oxidation to benzoic acid and its successive conversion to adipic acid were developed in Aspen Plus V14, and TEA and LCA were conducted using the resulting material and energy balances. A simplified process flow diagram is shown in Fig. 4 with detailed descriptions and diagrams in Note S1 and Figs. S13–S16. The two processes of PS conversion to benzoic acid and benzoic acid conversion to adipic acid were considered to occur in co-located facilities allowing for detailed evaluation of each process. Importantly, the results for the co-located plants are nearly identical to those that would result from a single integrated process. The PS oxidation plant was assumed to have a feedstock capacity of 50 metric tons per day (MTPD), representing less than 1% of the total EPS and PS consumed within the U.S. in 20185. The feedstock capacity for the benzoic acid plant was also taken to be 50 MTPD as this is the amount of benzoic acid produced from the PS oxidation plant under base case conditions.

For the PS oxidation process, the feedstock was taken to be densified EPS sourced from a preprocessor as compressed blocks (see Note S2) and delivered at a price of $0.80/kg15,67,68. The feedstock was further assumed to consist of 95 wt% PS content with 5 wt% contaminants such as PP, PE, ash, and water69. The oxidation process begins by dissolving the PS feedstock in a benzoic acid melt, which is then pumped into the reactor alongside water in a 1:1 water to benzoic acid weight ratio. The reactor operates at 165 °C and 15 bar, with the water allowing for heat management in the continuous system via evaporative cooling. Mn(OAc)2 and NaBr are present at 7 wt% and 2 wt% relative to PS, and air is sparged at a 4.5:1 mass ratio relative to PS. The benzoic acid yield is taken as 85% of theoretical for a 3 h residence time at a solids loading of 15 wt% (defined as the fraction of PS feedstock to the total stream mass). As the reaction proceeds, the solution partially vaporizes and is sent to a partial condenser, thereby removing heat from the reaction and generating process steam. The gaseous fraction is separated and sent to incineration, whereas the liquid fraction is continuously drawn off and filtered to separate any solid impurities or by-products from the reaction. The filtrate, containing benzoic acid and solubilized catalyst, is sent to a distillation column to produce crude benzoic acid and a concentrated stream of catalyst and other heavy boilers, which is sent to incineration70. The fly ash from incineration containing metal oxides from the catalysts is recovered and dissolved in acetic acid for reuse in the reaction with an assumed 95% recovery71,72. The crude benzoic acid from distillation is combined with water and cooled to produce benzoic acid crystals, which are then recrystallized in water to produce the purified benzoic acid product73. A fraction (27%) of the purified benzoic acid is recycled to the oxidation step as solvent make-up and the rest is sent for further purification.
For the conversion of benzoic acid, the purified product from oxidation is combined with water and fed to a set of bubble column reactors alongside corn-derived glucose and diammonium phosphate as a source of nitrogen. The reactors are inoculated with a cell culture from a seed train and the benzoic acid is converted to muconic acid with a productivity of 2.4 g/L/h and a titer of 85 g/L, as reported in Corynebacterium glutamicum by Becker et al45. As noted above, the bioconversion results shown in the current study demonstrated that the purified benzoic acid from EPS does not inhibit P. putida CJ074 relative to commercial benzoic acid. However, we did not optimize the bioprocess for titer and rate despite opportunities to do so − for instance, using constant feeding instead of feeding via DO-stat mode could substantially increase productivity. The seminal work from Becker et al. includes considerable process optimization in a strain that is also likely more tolerant to higher muconic acid titers than P. putida. Hence, we use their bioprocess performance as optimistic metrics for the process modeling efforts. Air is sparged into the bioreactors to facilitate the aerobic conversion and NH4OH is added to maintain a neutral pH. After bioconversion, the muconate product is filtered to remove cell biomass and other solids, then acidified with H2SO4 in a crystallizer unit to produce crystalline muconic acid. The muconic acid is dried and mixed with ethanol in a 4:1 molar ratio, then sent to a packed bed reactor where it is hydrogenated over a 1 wt% Pt/Al2O3 catalyst using a 4:1 H2 to muconic acid molar ratio at 20 bar and 85 °C57. H2 is removed from the reactor product stream and passed through a pressure swing adsorption unit before being recycled; the remaining liquid fraction of the reactor product is flashed to recover and recycle the ethanol. The concentrated adipic acid stream is then crystallized at 15 °C and dried to produce the final adipic acid product.
Based on the mass and energy balances from the process model, the capital expenditure and operating expenses for the plant were estimated. The total direct installed cost for the PS oxidation plant was estimated to be $25 MM (Fig. 5A) resulting in a fixed capital investment of $53 MM. Most of the capital cost derives from the air compressor in the oxidation section as well as the crystallizers and centrifuges in the benzoic acid purification section. The annual operating costs for the plant were estimated to be $21 MM/year (Fig. 5B) resulting in a minimum selling price (MSP) of $1.70/kg benzoic acid (Fig. 5C). The feedstock cost for waste PS contributed the most to operational cost, accounting for 46% of the MSP. These high costs stem from the low density of EPS and small volume collections, which can increase transportation costs and require an additional densification step4,74. Additionally, the capital recovery charge and waste disposal were found to contribute 24% and 6% to the MSP costs, respectively. Although the MSP was estimated to be competitive with historic benzoic acid market prices at this scale (Fig. S17), the low market volumes may inhibit its deployment due to market saturation (the 50 MTPD modeled plant would produce about 33% of the global benzoic acid consumption in 202337), highlighting the potential benefit of further upgrading to adipic acid or other chemicals.

Economic results for the base case 50 MTPD PS oxidation plant showing A the total direct installed equipment cost in millions of dollars ($MM) by process area, B the annual operational expenses in millions of dollars per year ($MM/yr) by process area, and C the minimum selling price (MSP) in $/kg benzoic acid by component contributions. Error bars represent the standard deviation centered on the mean as determined from Monte Carlo analysis with 1000 runs. A summary of results and detailed capital and operating expenses are provided in Tables S3–S5. All costs shown are in 2022 USD. Cradle-to-gate LCA results for (D) the GHG emissions by component contribution and (E) additional impact categories normalized to virgin benzoic acid production. Error bars represent the standard deviation centered on the mean as determined from Monte Carlo analysis with 1000 runs. Univariate sensitivity results for F the MSP and G GHG emissions. Parameter values for the sensitivity are shown below the variable name in parenthesis in the following order: optimistic case, base case, pessimistic case. Raw data for all panels including complete LCA results for the base case univariate sensitivity analysis are provided in Tables S19–S24. OSBL outside battery limits, Stoich. stochiometric, Comp. composition.
Using the materials and energy inventory generated from process modeling, cradle-to-gate (i.e., from EPS collection to benzoic acid product) LCA was also conducted. The results estimate that benzoic acid produced from PS oxidation exhibits lower impacts across 12 out of 14 categories, including GHG emissions, human toxicity, fossil resources use, land use, mineral use, and water use (Fig. 5D, E). Although virgin benzoic acid is conventionally produced through the oxidation of toluene38 and LCA impacts might therefore be expected to be similar, the upstream impacts for toluene production are greater than the comparative impacts of upstream waste EPS collection. For example, mineral use, water use, human toxicity, and land-use impacts for virgin benzoic acid production are largely driven by upstream impacts of toluene production. For PS-derived benzoic acid, the main drivers for these environmental impacts are electricity demand and the EPS compaction process (due to freight transportation emissions and diesel consumption for powering the compaction machinery). Overall, benzoic acid from the oxidation process showed an 85% decrease in GHG emissions relative to virgin production with major contributors being the stoichiometric CO2 emission from contaminant oxidation and waste incineration and the electricity consumption for air compression (Fig. 5D). The excess steam generated from combustion is considered a co-product and largely offsets the impact of the stoichiometric emissions and results in a negative fossil fuel use. For both marine eutrophication and ionizing radiation impact categories, the oxidation process was found to have 243% and 259% higher impacts, respectively, than conventional benzoic acid production due to the high impact of solid waste treatment and electricity use (Table S16). Under a decarbonized electricity scenario (Fig. S17), the GHG emissions could further decrease to 0.15 kg CO2e/kg, showing a 92% decrease relative to virgin production using decarbonized electricity.
Univariate sensitivity analysis for the PS oxidation process highlighted that feedstock cost, plant size, and solids loading had the highest impact on the MSP (Fig. 5F), whereas solids loading and water solvent loading showed the highest impact on GHG emissions (Fig. 5G). Efforts to improve the collection infrastructure and volumes could decrease feedstock costs, thereby substantially decreasing process costs (Fig. 5F)74. The lower bound case for feedstock cost of $0.20/kg represents a scenario where only transport and compaction would be included68,75 whereas the upper bound case aligns with price highs in 2022 from US trade databases67. Notably, both decreasing and increasing the water solvent composition increased GHG emissions relative to the base case, showing a local minimum (Fig. S18). This behavior is observed due to less steam co-product generation at lower water compositions and higher steam consumption for benzoic acid distillation at high water compositions. Nevertheless, both pessimistic or optimistic scenarios result in lower GHG emissions than virgin benzoic acid production. Additional sensitivity variables explored are provided in Tables S19–S24.
For the production of adipic acid from the PS-derived benzoic acid, the direct installed equipment cost was estimated to be $75 MM resulting in a fixed capital investment of $140 MM (Fig. 6A). The large difference (~3-fold) in capital expenditure compared to the PS oxidation plant stems from the high equipment cost of the bubble column reactors required for the bioconversion and the muconic acid crystallizers required for product recovery. The annual operating costs for the plant were estimated to be $46 MM (Fig. 6B) with an MSP of $3.19/kg adipic acid (Fig. 6C). Relative to the market price of adipic acid ($2.18/kg), this represents a 46% premium, highlighting that further cost improvements are necessary to reach cost parity. The largest contributors to the MSP of adipic acid included the PS-derived benzoic acid feedstock cost and the capital recovery charge, which contributed 46% and 29%, respectively. The purchase of raw materials contributed 11% to overall costs, largely driven by acid and base costs required for muconic acid pH maintenance during production and product neutralization.

Economic results for the base case 50 MTPD adipic acid plant, including A the total direct installed equipment cost in millions of dollars ($MM) by process area, B the annual operational expenses in millions of dollars per year ($MM/year) by process area, and C the minimum selling price in $/kg adipic acid by component contributions. Error bars represent the standard deviation centered on the mean as determined from Monte Carlo analysis with 1000 runs. A summary of results and detailed capital and operating expenses are provided in Tables S8–S10. All costs shown are in 2022 USD. Cradle-to-gate LCA results for D the GHG emissions by component contribution and E additional impact categories normalized to virgin adipic acid production. Error bars represent the standard deviation centered on the mean as determined from Monte Carlo analysis with 1000 runs. Univariate sensitivity results for F the MSP and G GHG emissions. Parameter values for the sensitivity are shown below the variable name in parenthesis in the following order: optimistic case, base case, pessimistic case. Raw data for all panels, including complete LCA results for the base case univariate sensitivity analysis are provided in Tables S27–S30. *Stoichiometric CO2 emissions derive from aerobic respiration of benzoic acid, CO2 from aerobic respiration of glucose is considered neutral and not shown. **Ammonia includes ammonia, ammonium hydroxide, and diammonium phosphate. MA muconic acid, Stoich. stochiometric.
Cradle-to-gate (i.e., from EPS collection through adipic acid production) LCA results estimated adipic acid production from PS-derived benzoic acid to have lower impacts for GHG emissions, fossil resources use, ozone depletion, and photo-oxidant formation compared to virgin adipic acid (Fig. 6D, E and Table S16). The benzoic acid-derived adipic acid showed a 61% decrease in GHG emissions compared to virgin production. The largest contributors included ammonia, sulfuric acid, and electricity consumption, which accounted for 28, 19, and 13% of overall GHG emissions, respectively. Other notable contributors included benzoic acid make-up (due to process losses) and steam use, which contributed 13% and 12%, respectively. The GHG emissions generated from the conversion of the benzoic acid were not considered neutral, as they stem from fossil carbon-based PS and contributed 9% to overall GHG emissions. The benzoic acid-derived adipic acid was higher than virgin adipic acid across 10 out of 14 categories, including acidification, ecotoxicity, eutrophication, and water depletion (Fig. 6E and Table S16). The largest driver across these metrics for benzoic acid-derived adipic acid was found to be sulfuric acid consumption, which on average contributed >50% to each LCA impact category due to its high input requirements (4 kg sulfuric acid per kg adipic acid) and individual impact of 0.18 kg CO2e/kg sulfuric acid, highlighting a key area for improvement. The consumption of acid and base could be decreased by the use of a host organism tolerant to low pH environments, employing an electrochemical pH swing method, or recovering the ammonium sulfate by-product44,76,77. Ammonia (including ammonia, ammonia hydroxide, and diammonium phosphate) was another notable input, requiring 0.33 kg ammonia/kg adipic acid, and contributing to 27% of the cradle-to-gate GHG emissions for adipic acid.
Univariate sensitivity analysis for the adipic acid production process (Fig. 6F, G) showed that decreasing PS-derived benzoic acid cost and increasing plant size decreases the process MSP by 19% and 15%, respectively. Decreasing the productivity to 1 g/L/h showed a 5% increase in MSP due to an increase in the number of bubble columns reactors required. A decrease in titer to 50 g/L showed an increase of 7% in MSP and 4% in GHG emissions due to an increase in equipment size and wastewater generation, respectively. Further improvements for muconate titers and productivity from the base case would have minor impacts on the MSP. Sourcing cheaper glucose or switching to cheaper carbon sources for cell growth, such as mixed sugars from lignocellulose77 could further reduce process costs (Fig. S17). Additionally, the use of mixed sugars alongside renewable electricity and natural gas can ultimately reduce emissions to 2.42 kg CO2eq/kg and lower fossil fuel consumption, freshwater eutrophication, and ionizing radiation by 27–47% relative to the base case (Fig. S17). Overall, a combination of these improvements could allow for the benzoic acid-derived adipic acid to approach cost parity with current market prices with substantially lower environmental impacts.
Environmental risk assessment
A qualitative environmental risk assessment was conducted to examine the potential human health and ecological risks associated with the conversion of PS to adipic acid78. Potential hazards were identified by cross-referencing the U.S. Environmental Protection Agency’s Toxic Release inventory79, which provides information on the quantities and types of chemicals released by industrial facilities and their associated risks. Full details of the assessment are provided in the Supplementary Materials.
Bromine and manganese, used as catalysts in the conversion of PS to benzoic acid, were identified as potentially hazardous as they are toxic at high levels79 (see Supplementary Materials). Under the base case operating conditions, Mn and Br are used at levels comparable to other oxidation technologies, such as terephthalic acid production61,80 and can presumably be maintained at safe levels with most emissions present in the incineration flue gas or solid waste. For the conversion of benzoic acid to adipic acid, the use of ammonium hydroxide and sulfuric acid were found to present key risks. Ammonium hydroxide can produce ammonia gas, which is highly irritating to the respiratory tract and eyes, and prolonged exposure can lead to more severe respiratory and systemic effects. For sulfuric acid, the risk-screening environmental indicator (RSEI) score that accounts for the magnitude of chemical release, fate, and transport of the chemical, and the size and location of exposed populations, scores higher than 93% of chemicals on the Toxic Release Inventory. Compared to conventional adipic acid, which employs nitric acid, another toxic chemical, for the oxidation of ketone-alcohol oil, sulfuric acid still has a higher RSEI score because it is used/released in greater quantities and has a lower reference dose concentration. Although sulfuric acid can be effectively used with proper handling, there is still a significantly higher risk for harmful exposure to sulfuric acid compared to other toxic chemicals81, which presents another reason to target alternative pH maintenance methods that avoid its use.
Methods
Chemicals
Manganese (II) acetate (Mn(OAc)2, 98%), cobalt (II) acetate (Co(OAc)2, 99.99%), sodium bromide (NaBr, ≥99%), benzoic acid (≥99.5%), benzoic acid-2,3,4,5,6-d5 (≥99 atom% D), chloroform-d (99.8 atom% D), acetone-d6 (99.9 atom% D), dimethyl sulfoxide (≥99.9%), tetrahydrofuran (THF, ≥99.9%), PS (280 kDa, Lot#: MKCL4619), cis,cis-muconic acid (≥97%), adipic acid (99%), and Pt/C (5 wt%, Lot#: MKBN5556V) were purchased from Sigma Aldrich. Toluene (≥99.8%) was purchased from VWR Chemical. Ethanol (200 proof) was obtained from Pharmco (Greenfield Global). Benzoic acid used for analytical standards was obtained from Acros Organics. Ultra-zero compressed air and ultra-high purity compressed nitrogen gas were purchased from Matheson.
Catalytic autoxidation of PS
All reactions were performed on Series 5000 Multiple Reactor Parr Instruments, which provides for six 75 mL (total volume) batch reactors. Titanium reactors were used since the surface of stainless-steel reactor was corroded by NaBr at the reaction conditions. For a typical experiment, catalysts (Mn(OAc)2, Co(OAc)2, NaBr), benzoic acid, PS, and magnetic stir bar (length 10 mm, diameter 3 mm, PTFE) were added in a titanium reactor. Reactors were purged with N2 twice before leak testing at 80 bar. Upon passing leak testing, the reactors were charged with ultra-zero compressed air to 33 bar and further diluted with N2 to 60 bar. The reactors were heated to the desired reaction temperature for the target reaction time. The reaction times reported in this study includes a 30-min duration necessary to reach the desired temperatures.
After reaction completion, reactors were cooled down to ca. 20 °C in 30 min, then depressurized. All products (benzoic acid, residual PS, catalysts) in the headspace and reactor vessel were dissolved in THF and collected in a volumetric flask (25 mL). The solution in the flasks was diluted with THF for analysis. For the product solution containing cobalt ions, phthalic acid was added to the HPLC sample to achieve a mole ratio of phthalic acid to cobalt of 50:1, to inhibit the interaction between cobalt ions and benzoic acid.
Construction of P. putida KT2440-CJ074
The genome of P. putida KT2440 was engineered by transformation and homologous recombination of suicide plasmids, which can only replicate in the host by recombining into its genome, harboring selectable (i.e., tet, conferring resistance to tetracycline) and counter-selectable (i.e., sacB, imposing sensitivity to sucrose) markers. These plasmids also contain the desired allele flanked by fragments of DNA homologous to sequences upstream and downstream of the location targeted for integration, deletion, or replacement. Following selection for integration of the plasmid into the genome and counter selection for recombination of the plasmid out of the genome, approximately half of the isolates should contain the desired allele and half should return to their original sequence. The plasmid pMFL22 was first used to delete the catRBC genes and replace them with the tac promoter upstream of catA in the genome of P. putida KT2440 (ATCC 47054)56. To accomplish this, 5 mL LB broth (10 g/L tryptone, 5 g/L yeast extract, 5 g/L NaCl) was inoculated with P. putida KT2440 (ATCC 47054) and incubated overnight at 30 °C, 225 rpm. The next day the culture was centrifuged at room temperature, ~4147 rcf for 10 min and the cell pellet was washed three times in 2.5 mL 300 mM sucrose and then resuspended in 100 μL 300 mM sucrose. 300–500 ng of the plasmid was mixed with 50 μL of this cell solution, placed in a 0.1 cm cuvette, and electroporated at 1.6 kV; 25 μF, 200 ohms. 950 μL of SOC media was added to the cuvettes, transferred to a 2 mL microfuge tube, and incubated at 30 °C, 225 rpm for 1–2 h. The cells were then centrifuged for 1 min at 16,000 rcf, and all but ~100 μL of media was removed. The cells were then resuspended in the remaining volume and plated on LB plates (10 g/L tryptone, 5 g/L yeast extract, 5 g/L NaCl, 15 g/L agar) supplemented with 30 μg/mL tetracycline to select for integration of the suicide plasmids into the genome. The plates were incubated at 30 °C and colonies were restreaked on a second LB + tetracycline plate. Colonies were then streaked and restreaked on YTS plates (20 g/L tryptone, 10 g/L yeast extract, 250 g/L sucrose, 18 g/L agar) and incubated at 30 °C overnight. Colonies from the second YTS plates were then screened by colony PCR to identify those with the desired replacement. This procedure was then repeated to delete the pcaHG using pCJ01182, yielding KT2440-CJ074.
Bacterial strains, media, and shake-flask cultivations
The plasmid pMFL22 was used to delete the catRBC genes and replace them with the tac promoter upstream catA in the genome of P. putida KT2440 (ATCC 47054) and, as previously described56. The pcaHG genes were then deleted using pCJ011 as previously described82, yielding KT2440-CJ074. Cultivations were performed in LB (Sigma-Aldrich #L3022) or M9 minimal medium (6.78 g/L Na2HPO4, 3 g/L KH2PO4, 0.5 NaCl, 1 g/L NH4Cl, 100 mM CaCl2, and 18 mM FeSO4) supplemented with 20 mM glucose, 20 mM benzoate, or substrate from the autoxidation of EPS. A 100 mM benzoate stock was prepared by solubilizing benzoic acid (Sigma–Aldrich #242381) in water by pH adjusting to 7.0 with 1 M NaOH. A 100 mM benzoate stock was prepared from deconstructed EPS by assuming the weight was 100% benzoic acid and solubilizing the substrate in water via pH adjusting to 7.0 with 1 M NaOH. Both commercial benzoate and deconstructed EPS was provided to cultures at the same volumetric ratio (20% v/v). Glucose (Fisher Chemical #D16) was added from a 2.77 M stock prepared in water. All stock solutions were sterilized by 0.2 μm vacuum filtration prior to addition to the media. P. putida KT2440-CJ074 was revived from a glycerol stock by inoculating into Millers LB and cultivating at 30 °C, 225 rpm for 12 h. Cell pellets were washed in M9 salts, inoculated into 30 mL media as described above to an OD600 of 0.13–0.15 in 125 mL baffled metal-capped flasks, and cultivated at 30 °C, 225 rpm. Glucose was fed to 20 mM every 24 h. OD600 was measured with 50 μL culture, and samples were harvested for analyte quantitation by removing 0.5-1 mL, centrifuging at >15,000 × g, passing through a 0.2 μm syringe unit, and storing in amber silanized vials at −20 °C until analysis.
Bioreactor conversion of depolymerized EPS to muconate
The bioconversion of the EPS-derived stream generated via catalytic autoxidation to muconic acid was performed by P. putida KT2440-CJ074 using a dissolved oxygen (DO)-stat fed-batch strategy and a modified protocol from our previous work44. In addition, we conducted a parallel experiment with commercial benzoate (sodium benzoate; B420; Sigma Aldrich) to identify potential differences compared to the EPS-derived stream. For the seed of both bioreactor campaigns, a scrape of a frozen glycerol stock was used to inoculate 25 mL of LB Miller media in independent 125 mL baffled flasks. The cultures were incubated for 16.5 h at 30 °C and 225 rpm. Then, the cells were centrifuged at 5000 × g for 8 min, the supernatant was removed, and the cells were resuspended in 5 mL of modified M9 medium (see below). The resuspended cells were used to inoculate the bioreactors to an initial OD600 of 0.2. For the bioreactor experiments, OD600 was measured using a nanodrop (Thermo Scientific).
For the bioreactor experiment, P. putida CJ074 was cultivated in 0.5 L BioStat-Q Plus bioreactors (Sartorius Stedim Biotech) containing 200 mL of modified M9 medium with 2.7 g/L (15 mM) of glucose. The modified M9 medium also contains 13.56 g/L, Na2HPO4, 6 g/L, KH2PO4, 1 g/L, NaCl, 2 g/L, (NH4)2SO4, 2 mL/L of 1 M MgSO4 solution, 0.2 mL/L of 1 M CaCl2 solution, 2 mL/L of 5 g/L FeSO4 × 7H2O solution, and 1 mL/L antifoam 204 (A6426; Sigma Aldrich, St. Louis, MO). The cultivations were maintained at 30 °C, 7.0 pH using 4 M NaOH, and sparged with air at 1.2 vvm. The initial agitation in the batch phase was set at 350 rpm. After 4 h, 1.6 mL of a filter-sterilized (0.2 µm; Nalgene PES) 0.25 M solution of sodium benzoate (pH 7.5) was added to reach a concentration of 2 mM in the bioreactor. Once the saturation of oxygen reached 30%, the agitation was maintained at 30% using a DO cascade with a 5% dead band. When the glucose was depleted, the DO increased to 75%, at which point the fed-batch phase was initiated. The feed contained 1 M of benzoic acid, either from commercially-available sodium benzoate (144.11 g/L) or from the depolymerized EPS (122.12 g/L), 100 g/L (0.56 M) glucose, 13.5 g/L (0.10 M) ammonium sulfate, and 3.8 mL/L of antifoam 204, all adjusted to a pH of 7.5 with NaOH (10 M) and filter sterilized (0.2 µm; Nalgene PES). The feed was dosed for 30 s at a rate of 0.4 mL/min to target 1 mM benzoic acid concentration in the bioreactor in each pulse. The feed was automatically added every time the DO reached 75%. The agitation was manually adjusted to maintain a minimum DO of 10% (Fig. S11). The experiment ended when all the feed—a total of 85.5 mL and 60 mL from the commercial benzoate and EPS-derived stream, respectively –was consumed. The spent broth from the EPS-derived stream was then centrifuged at 20,000 × g and 30 min, filtered through 0.2 µm pore-size membranes (597-4520; Thermo Fisher), and used for further downstream separations and catalytic upgrading.
Muconic acid purification
The purification of muconic acid obtained from the bioprocess was conducted by following the method described in the previous report43. Proteins were removed from fermentation broth using a 10 kDa ultrafiltration cartridge (GE UFP-10-C-4X2MA, QuixStand System, 7–10 psig). The protein-free broth was treated with activated carbon (100 mesh, Darco, Sigma-Aldrich) to remove color impurities, monitored by UV-Vis at 400 nm (Beckman DU640), and filtered (0.2 µm PES, Nalgene). Muconic acid was crystallized by adjusting the broth to pH 2 with concentrated H2SO4 and cooling to 5 °C. Crystals were collected by vacuum filtration (0.2 µm PES), dried for 48 h in a vacuum oven. The remaining crystals were dissolved in ethanol to precipitate salts, filtered, and concentrated by rotary evaporation to yield purified muconic acid.
Hydrogenation of muconic acid
25 mg of Pt/C (5 wt%), 150 mg of purified muconic acid, and 15 g of ethanol were added sequentially in a stainless-steel Parr reactor (75 mL). The reactor was flushed with H2 three times and pressurized with H2 at 20 bar while stirring at 600 rpm. Since hydrogenation occurs even at room temperature, heating began immediately after pressurizing with H2 to 20 bar, which was marked as the reaction start time. The reaction temperature increased from RT to 40 °C after 30 min.
Benzoic acid, benzaldehyde, and muconic acid analysis
Benzoic acid, benzaldehyde, and cis,cis-muconic acid were analyzed using an Infinity II 1290 ultra-high-performance liquid chromatography (UHPLC) system (Agilent Technologies) equipped with a G7117A diode array detector (DAD)64. Samples (0.25 µL) were injected onto a Zorbax Eclipse Plus C18 Rapid Resolution HD column (2.1 × 50 mm, 1.8 µm; Agilent) maintained at 40 °C. The mobile phase consisted of (A) 20 mM phosphoric acid in ultrapure water and (B) 100% methanol, with a flow rate of 0.7 mL/min. The gradient program was: 0 min, A = 80%/B = 20%; 2 min, A = 35%/B = 65%; 2.01–3 min, A = 80%/B = 20%. Analytes were detected at 240 nm, and calibration curves (1–200 mg/L) showed R2 ≥ 0.995 using ten standards. Calibration verification standards were analyzed every 12–24 injections.
Quantitation of adipic acid
Adipic acid was quantified using the ultra-high performance liquid chromatography coupled with tandem mass spectrometry (UHPLC-MS/MS) method21. Characterization was performed on a Waters Acquity UPLC H-class system equipped with a Phenomenex Kinetex EVO C18 column (2.1 × 100 mm, 1.7 µm) operated at 30 °C, with a 10 µL injection volume and a flow rate of 0.3 mL/min. The mobile phases consisted of water with 0.1% formic acid (A) and acetonitrile with 0.1% formic acid (B), with a gradient elution from 95% A to 1% A over 11 min. Leucine-enkephalin (100 ng/mL in water/acetonitrile 50:50, v/v) was infused post-column at 5 µL/min as an external calibrant.
Compounds were ionized by electrospray in negative-ion mode (1.9 kV) and analyzed on a Waters Synapt G2-Si mass spectrometer. The desolvation and source temperatures were 450 °C and 120 °C, respectively, with nitrogen as desolvation, sweep, and nebulizer gases. Ions were scanned across m/z 50–1200 and subjected to tandem MS (MS/MS) in the quadrupole–TOF system, with argon collision gas (2 L/min) used for fragmentation.
Gel permeation chromatography (GPC) analysis
Molar mass analysis of PS and analysis of PS deconstruction products were performed using gel permeation chromatography (GPC) coupled with multi-angle light scattering (MALS) using an Infinity II 1260 HPLC system from Agilent. The HPLC stack is equipped with a degasser, vial sampler, and heated column compartment with one guard column and three PLgel 5 μm MIXED-C 300 × 7.5 mm (purchased from Agilent), heated to 40 °C. The mobile phase is HPLC-grade THF stabilized with butylated hydroxytoluene purchased from Spectrum Chemical running at a flow rate of 1 mL/min. The detectors used for GPC are a Wyatt Technology Optilab differential refractometer (dRI) and a Wyatt Technology miniDAWN light scattering detector (MALS). After the autoxidation reactions, THF was used to collect all products. Solid samples were prepared after removing THF by rotary evaporation (50 °C, 250 mbar, further decreased to 180 mbar as the solvent amount decreases), followed by drying in a vacuum oven (50 °C, 180 mbar). The solids were dissolved in THF at ~20 mg/mL and filtered through a 0.2 μm PTFE syringe filter. Untreated PS samples were prepared in THF at a concentration of ~5 mg/mL. A narrow molar mass distribution PS standard was used to normalize and align the detectors. A dn/dc value of 0.184 is used for PS samples83. GPC traces of PS standards (Tosoh Biosciences, PStQuick kit C and D) were obtained to compare the retention time of PS standards with that of residual oxidized PS.
NMR spectroscopy
The 1H NMR spectra of PS samples were recorded on a Bruker Ascend TM 300 MHz spectrometer. Chemical shifts were reported with respect to internal solvent (CDCl3, δ(1H) 7.26 ppm). DMSO was used to determine the purity of the PS substrates. The 1H NMR spectra of muconic acid were measured using a Bruker Avance III HD 400 MHz spectrometer, with toluene as an external standard for determining the purity of muconic acid. The spectra were analyzed using MestReNova (v14.2.0, Mestrelab Research S.L.).
Vacuum distillation and recrystallization
The separation of benzoic acid from the Mn/Br catalysts and residual PS was performed using a Kugelrohr apparatus (Büchi glass oven B-585) consisting of a four-bulb setup connected to a vacuum system (18 mbar). The first bulb contained 500 mg of products, and the temperature was increased to 200 °C. It takes ca. 9 min to reach 200 °C from RT. The system was maintained at this temperature for 30 min to recover benzoic acid. For the recrystallization of benzoic acid, approximately 2.5 g of the distilled benzoic acid was combined with 50 g of H2O, and the mixture was heated to 110 °C to dissolve the benzoic acid. The aqueous solution was then cooled to 3 °C in an ice bath, and filtration yielded purified benzoic acid.
Differential scanning calorimetry (DSC)
DSC measurements for post-consumer PS samples were performed on a TA Discovery X3 Differential Scanning Calorimeter Instrument (TA Instruments). Samples of 3–10 mg were placed in hermetically sealed aluminum pans (DSC Consumables—Part #—DSC84012). DSC measurements were taken at a heating and cooling rate of 10 °C/min from 0 to 160 °C. The results were reported for the second heating/cooling cycle. DSC measurements were also conducted for benzoic acid and adipic acid samples to obtain purity values. A Discovery DSC 25 (TA Instruments) with an attached refrigerated cooling system −90 °C accessory (TA Instruments) was used to collect data. The heating rate was set to 0.5 °C/min and sample size is roughly 1.7 mg. The data sampling interval was set to 1 s/point. TA Instruments T-zero hermetically sealed pans were used (TA Instruments—Part #— 900793.901). Purity was determined by analysis of the melting point following ASTM method E928 in the TA Instruments TRIOS software.
Thermogravimetric analysis (TGA)
TGA experiments were performed using a Discovery Series TGA 5500 (TA Instruments). Samples of 3–15 mg were loaded onto platinum pans for analysis. During analysis, the sample was purged with either nitrogen or air at a flow rate of 25 mL/min, with experiments conducted separately for each gas. The sample was heated at a rate of 20 °C/min to a final temperature of 700 °C. TA Instruments Trios Software was used for data analysis.
ICP-OES
Manganese concentration was measured using an Agilent 5100 ICP-OES instrument configured with an SPS4 autosampler. Samples were prepared via microwave digestion using a Milestone Ultrawave Single Reaction Chamber Microwave Digester with 15 vial rack. Approximately 0.25 g of sample was digested in 4 mL of concentrated nitric acid, 1 mL H2O, and 1 mL fluoroboric acid. The microwave digester was set to ramp at 10 °C/min to 250 °C and hold at 250 °C for 20 min. The pressure was maintained at a max pressure of 100 bar. After digestion, the samples were diluted to 50 mL using DI water. Quantitative analysis of manganese was performed by measuring 257.61 nm wavelength in axial mode. Axial mode was set to an RF Power of 1.4 kW, argon flow rate 13 L/min, auxiliary 1 L/min, nebulizer 0.6 L/min, uptake delays of 20 sec, max rinse time of 120 s with intelligent rinse enabled. Calibration standards were measured using a six-point calibration curve (0.1–20 ppm). The manganese calibration curve had a correlation coefficient of 0.9998. Quality control includes running blanks and calibration standards before and after manganese analysis.
ICP-MS
Bromine concentration was measured with ICP-MS. 10 mg of vacuum distilled benzoic acid was dissolved in 10 mL of DI H2O. The solution was further diluted in a ratio of 10:1 in a solution of milliQ water containing 1 wt% triethanolamine and analyzed using an Agilent 7700 ICP-MS using a five-point calibration curve from a bromine standard purchased from High Purity Standards. Calibration curve for Br resulted in a correlation coefficient value of 0.9999, a detection limit of 35 ppt, and a background level of 6.3 ppb. Blanks and calibration standards were run two times both before and after full quantification.
Elemental analysis for C, H, N
The post-consumer PS samples were analyzed for carbon, hydrogen, and nitrogen using a LECO CHN 628 (LECO Corporation). The analysis parameters are a combustion temperature of 950 °C and an afterburner temperature of 850 °C. The burn profile is as follows: step 1—high furnace flow for 40 s; Step 2—medium furnace flow for 30 s; and step 3—high furnace flow for 30 s. The ballast has an equilibration time of 30 s with a 300 s not-filled timeout. The aliquot loop has a fill pressure drop of 200 mmHg with an equilibration time of 8 s. A sample size of 100 mg was wrapped into a tin cup prior to analysis. This method was calibrated with EDTA (Part #—502-896—LECO Corporation).
Elemental analysis for Br, Cl
Total bromine and chlorine were determined by combustion ion chromatography. About 20 mg of each sample was weighed into an aluminum boat, wrapped in ashless filter paper, and combusted in an oxygen flask. The combustion products were collected and analyzed by ion chromatography using a polymeric anion exchange column with a sodium carbonate/sodium bicarbonate mobile phase. Anions were detected by a conductivity detector and quantified against diluted NIST-traceable standard solutions. System suitability was verified by replicate injections of working and check standards before and during the sequence. Blank corrections were applied, and concentrations were calculated from the measured solution concentration, sample mass, and dilution volume.
Measurement of temperature of liquid benzoic acid
To measure the liquid phase temperature at a desired gas-phase temperature, a Parr pressure vessel was modified by replacing the plug with a bored through union (Swagelok SS-200-1-2BT). A K-type thermocouple (Omega KQXL-18G-12) was placed through the fitting with the end submerged in the liquid phase benzoic acid. In the reactor, benzoic acid 3.0 g was added, and charged with the mixture of O2 at 7 bar and N2 at 53 bar. The temperature was monitored by connecting the thermocouple to a Watlow temperature controller.
Process modeling and techno-economic analysis
Conceptual process models for the conversion of PS to benzoic acid were developed using Aspen Plus V14. The oxidation of PS to benzoic acid was modeled using the ENRTL-HG and ELECNRTL property methods based on experimental results and literature. The conversion of benzoic acid to adipic acid was adapted from the model described in Mokwalto et al.77 which uses the NRTL property method.
Economic analysis was performed using a discounted cash flow rate of return analysis as described in Humbird et al.84 using the material and energy balances derived from the process models. A detailed description of the processes is provided in the Supplementary Materials and detailed diagrams with stream data are provided in Figs. S13–S16. Uncertainty analysis for the minimum selling price was performed using Monte Carlo analysis using 1000 runs to determine the mean and σ values. The ranges for each price were guided by historical price data from 2018 to 2022. When historical price data or ranges were unknown, a triangular distribution was used with the lower and upper bounds assumed to be 80% and 120% of the base value, respectively.
Life cycle assessment
To determine the environmental impacts of the conversion of post-consumer PS to adipic acid, a cradle-to-gate life cycle assessment was conducted using Brightway version 2 software and Activity Browser version 2.11. All co-products were treated using system expansion (e.g., assuming co-production of excess steam offsets traditional steam production). Background data are derived from Ecoinvent v3.9.1, and foreground data are derived from the material and energy balances provided by the process flow models developed herein using Aspen Plus. Life cycle stages include the collection and compaction of post-consumer PS waste, oxidation to benzoic acid, bioconversion to muconic acid, and final conversion to adipic acid. The ReCiPe 2016 midpoint H impact assessment method was utilized to investigate all environmental impacts, except for global warming potential, which was measured using the Intergovernmental Panel on Climate Change (IPCC) 2021 method. For the sensitivity analysis, a Monte Carlo analysis was performed with 1000 iterations, providing standard deviations for each environmental impact category.
Reporting summary
Further information on research design is available in the Nature Portfolio Reporting Summary linked to this article.
Data availability
All data from this work are available in the paper, Supplementary Information, Source Data file and from corresponding author(s) upon request. Source data are provided with this paper.
References
-
Expanded polystyrene market analysis: Industry market size, plant capacity, production, operating efficiency, demand & supply, end-user industries, sales channel, regional demand, company share, manufacturing process, 2015–2032. (ChemAnalyst, 2023).
-
Polystyrene market analysis: Industry market size, plant capacity, production, technology, operating efficiency, demand & supply, end-use, grade, foreign trade, sales channel, regional demand, company share, manufacturing process, policy and regulatory landscape, 2015–2030. (ChemAnalyst, 2023).
-
Geyer, R., Jambeck, J. R. & Law, K. L. Production, use, and fate of all plastics ever made. Sci. Adv. 3, e1700782 (2017).
-
Schyns, Z. O. G. & Shaver, M. P. Mechanical recycling of packaging plastics: a review. Macromol. Rapid Commun. 42, e2000415 (2021).
-
Milbrandt, A., Coney, K., Badgett, A. & Beckham, G. T. Quantification and evaluation of plastic waste in the United States. Resour. Conserv. Recycl. 183, 106363 (2022).
-
Expanded Polystyrene Industry Alliance. 2022 Recycling report: Expanded polystyrene transport packaging. (2024).
-
Marquez, C., Martin, C., Linares, N. & De Vos, D. Catalytic routes towards polystyrene recycling. Mater. Horiz. 10, 1625–1640 (2023).
-
Gonzalez-Aguilar, A. M., Pérez-García, V. & Riesco-Ávila, J. M. A thermo-catalytic pyrolysis of polystyrene waste review: A systematic, statistical, and bibliometric approach. Polymers 15, 1582 (2023).
-
Kosloski-Oh, S. C., Wood, Z. A., Manjarrez, Y., de Los Rios, J. P. & Fieser, M. E. Catalytic methods for chemical recycling or upcycling of commercial polymers. Mater. Horiz. 8, 1084–1129 (2021).
-
Sun, H., Rosenthal, C. & Schmidt, L. D. Oxidative pyrolysis of polystyrene into styrene monomers in an autothermal fixed-bed catalytic reactor. ChemSusChem 5, 1883–1887 (2012).
-
Agilyx technology produces on-spec product in Japan. (Agilyx, https://www.agilyx.com/agilyx-technology-produces-on-spec-product-in-japan/) 2024.
-
Xu, Z. et al. Cascade degradation and upcycling of polystyrene waste to high-value chemicals. Proc. Natl Acad. Sci. USA 119, e2203346119 (2022).
-
Munyaneza, N. E. et al. A generic platform for upcycling polystyrene to aryl ketones and organosulfur compounds. Angew. Chem. Int. Ed. 62, e202307042 (2023).
-
Rabot, C. et al. Polystyrene upcycling into fungal natural products and a biocontrol agent. J. Am. Chem. Soc. 145, 5222–5230 (2023).
-
Xu, Z. et al. Progress and challenges in polystyrene recycling and upcycling. ChemSusChem 17, e202400474 (2024).
-
Oh, S., Jiang, H., Kugelmass, L. H. & Stache, E. E. Recycling of post-consumer waste polystyrene using commercial plastic additives. ACS Cent. Sci. 11, 57–65 (2025).
-
Giakoumakis, N. S., Marquez, C., de Oliveira-Silva, R., Sakellariou, D. & De Vos, D. E. Upcycling of polystyrene to aromatic polyacids by tandem Friedel–Crafts and oxidation reactions. J. Am. Chem. Soc. 146, 34753–34762 (2024).
-
Baek, D. et al. Can the Hock process be used to produce phenol from polystyrene? J. Am. Chem. Soc. 147, 8687–8694 (2025).
-
Olivar, C. et al. Composite recycling with biocatalytic thermoset reforming. J. Am. Chem. Soc. 146, 30004–30008 (2024).
-
Partenheimer, W. Valuable oxygenates by aerobic oxidation of polymers using metal/bromide homogeneous catalysts. Catal. Today 81, 117–135 (2003).
-
Sullivan, K. P. et al. Mixed plastics waste valorization through tandem chemical oxidation and biological funneling. Science 378, 207–211 (2022).
-
Luo, X., Zhan, J., Mei, Q. & Zhang, S. Selective oxidative upgrade of waste polystyrene plastics by nitric acid to produce benzoic acid. Green. Chem. 25, 6717–6727 (2023).
-
Cao, R. et al. Catalytic oxidation of polystyrene to aromatic oxygenates over a graphitic carbon nitride catalyst. Nat. Commun. 13, 4809 (2022).
-
Huang, Z. et al. Chemical recycling of polystyrene to valuable chemicals via selective acid-catalyzed aerobic oxidation under visible light. J. Am. Chem. Soc. 144, 6532–6542 (2022).
-
Oh, S. & Stache, E. E. Chemical upcycling of commercial polystyrene via catalyst-controlled photooxidation. J. Am. Chem. Soc. 144, 5745–5749 (2022).
-
Peng, Z., Chen, R. & Li, H. Heterogeneous photocatalytic oxidative cleavage of polystyrene to aromatics at room temperature. ACS Sustain. Chem. Eng. 11, 10688–10697 (2023).
-
Bassani, D. M., De Abreu, A.-L. & Taton, D. Reassessing the photochemical upcycling of polystyrene using acridinium salts. Angew. Chem. Int. Ed. 64, e202418680 (2024).
-
Jiang, S., Chen, Y., Huang, Y. & Hu, P. Photooxidation of polystyrene into high-value chemicals. Eur. J. Org. Chem. 28, e202401109 (2024).
-
Skolia, E., Mountanea, O. G. & Kokotos, C. G. Photochemical aerobic upcycling of polystyrene plastics. ChemSusChem 17, e202400174 (2024).
-
Xu, S., Liu, S., Song, W. & Zheng, N. Metal-free upcycling of plastic waste: photo-induced oxidative degradation of polystyrene in air. Green. Chem. 26, 1363–1369 (2024).
-
Parkatzidis, K., Wang, H. S. & Anastasaki, A. Photocatalytic upcycling and depolymerization of vinyl polymers. Angew. Chem. Int. Ed. 63, e202402436 (2024).
-
Adamian, V. A. & Gong, W. H. in Liquid Phase Aerobic Oxidation Catalysis: Industrial Applications And Academic Perspectives: Industrial Applications And Academic Perspectives 41–66 (Wiley, 2016).
-
Hansen, C. M. Hansen Solubility Parameters: A User’s Handbook (CRC Press, 2007).
-
Partenheimer, W. Methodology and scope of metal/bromide autoxidation of hydrocarbons. Catal. today 23, 69–158 (1995).
-
Partenheimer, W. Transformation of polymers to useful chemicals oxidation. US Patent 6,958,373 (2005).
-
Sikkenga, D.L. Conversion of polystyrene to benzoic acid. US Patent 10,259,769 (2019).
-
Market volume of benzoic acid worldwide from 2015 to 2022, with a forecast for 2023 to 2030 (Statista, 2022).
-
Maki, T. & Takeda, K. in Ullmann’s Encyclopedia of Industrial Chemistry 329–342 (Wiley-VCH Verlag GmbH & Co., 2012).
-
Opgrande, J. L., Brown, E. E., Hesser, M. & Andrews, J. in Kirk-Othmer Encyclopedia of Chemical Technology 625–637 (John Wiley & Sons, Inc., 2003).
-
Bang, S. G., Choi, W. J., Choi, C. Y. & Cho, M. H. Production of cis,cis-muconic acid from benzoic acid via microbial transformation. Biotechnol. Bioprocess Eng. 1, 36–40 (1996).
-
van Duuren, J. B. et al. pH-stat fed-batch process to enhance the production of cis, cis-muconate from benzoate by Pseudomonas putida KT2440-JD1. Biotechnol. Prog. 28, 85–92 (2012).
-
Xie, N.-Z., Liang, H., Huang, R.-B. & Xu, P. Biotechnological production of muconic acid: current status and future prospects. Biotechnol. Adv. 32, 615–622 (2014).
-
Vardon, D. R. et al. cis,cis-Muconic acid: separation and catalysis to bio-adipic acid for nylon-6,6 polymerization. Green. Chem. 18, 3397–3413 (2016).
-
Salvachúa, D. et al. Bioprocess development for muconic acid production from aromatic compounds and lignin. Green. Chem. 20, 5007–5019 (2018).
-
Becker, J., Kuhl, M., Kohlstedt, M., Starck, S. & Wittmann, C. Metabolic engineering of Corynebacterium glutamicum for the production of cis, cis-muconic acid from lignin. Microb. Cell Factories 17, 115 (2018).
-
Coudray, L., Bui, V., Frost, J. W., Schweitzer, D. Process for preparing caprolactam and polyamides therefrom. US Patent 9,073,867 (2015).
-
Beerthuis, R., Rothenberg, G. & Shiju, N. R. Catalytic routes towards acrylic acid, adipic acid and ε-caprolactam starting from biorenewables. Green. Chem. 17, 1341–1361 (2015).
-
Khalil, I., Quintens, G., Junkers, T. & Dusselier, M. Muconic acid isomers as platform chemicals and monomers in the biobased economy. Green. Chem. 22, 1517–1541 (2020).
-
Shanks, B. H. & Keeling, P. L. Bioprivileged molecules: creating value from biomass. Green. Chem. 19, 3177–3185 (2017).
-
Rorrer, N. A., Vardon, D. R., Dorgan, J. R., Gjersing, E. J. & Beckham, G. T. Biomass-derived monomers for performance-differentiated fiber reinforced polymer composites. Green. Chem. 19, 2812–2825 (2017).
-
Johnson, C. W. et al. Innovative chemicals and materials from bacterial aromatic catabolic pathways. Joule 3, 1523–1537 (2019).
-
Abdolmohammadi, S. et al. Analysis of the amorphous and interphase influence of comononomer loading on polymer properties toward forwarding bioadvantaged copolyamides. Macromolecules 54, 7910–7924 (2021).
-
Cywar, R. M., Rorrer, N. A., Hoyt, C. B., Beckham, G. T. & Chen, E. Y.-X. Bio-based polymers with performance-advantaged properties. Nat. Rev. Mater. 7, 83–103 (2022).
-
Luo, X. et al. Circularly recyclable polymers featuring topochemically weakened carbon–carbon bonds. J. Am. Chem. Soc. 144, 16588–16597 (2022).
-
Draths, K. M. & Frost, J. W. Environmentally compatible synthesis of adipic acid from D-glucose. J. Am. Chem. Soc. 116, 399–400 (1994).
-
Vardon, D. R. et al. Adipic acid production from lignin. Energy Environ. Sci. 8, 617–628 (2015).
-
Settle, A. E. et al. Enhanced catalyst durability for bio-based adipic acid production by atomic layer deposition. Joule 3, 2219–2240 (2019).
-
Adipic acid market analysis: Industry market size, plant capacity, production, operating efficiency, demand & supply, end-use, sales channel, regional demand, foreign trade, company share, manufacturing process, policy and regulatory landscape, 2015–2035 (ChemAnalyst, 2023).
-
Musser, M. T. in Ullmann’s Encyclopedia of Industrial Chemistry 1–11 (Wiley-VCH Verlag GmbH & Co., 2005).
-
Inventory of US greenhouse gas emissions and sinks: 1990–2015 (US Environmental Protection Agency, Washington, DC, 2017).
-
Tomás, R. A. F., Bordado, J. C. M. & Gomes, J. F. P. p-Xylene oxidation to terephthalic acid: a literature review oriented toward process optimization and development. Chem. Rev. 113, 7421–7469 (2013).
-
Palumbo, C. T. et al. Catalytic carbon–carbon bond cleavage in lignin via manganese–zirconium-mediated autoxidation. Nat. Commun. 15, 862 (2024).
-
Cuthbertson, A. A. et al. Characterization of polymer properties and identification of additives in commercially available research plastics. Green Chem, (2024).
-
Erickson, E. et al. Sourcing thermotolerant poly(ethylene terephthalate) hydrolase scaffolds from natural diversity. Nat. Commun. 13, 7850 (2022).
-
Partenheimer, W. & Schammel, W.P. Oxidation process for the manufacture of aromatic acids from alkylaromatic compounds. US Patent 4,786,753 (1988).
-
Ellis, L. D. et al. Chemical and biological catalysis for plastics recycling and upcycling. Nat. Catal. 4, 539–556 (2021).
-
USA trade import and export data (United States Census Bureau, 2024).
-
Parry, L. Processing of expanded polystyrene in accordance with CPIA recommendations (Continuous Improvement Fund Office, Waste Diversion Ontario, 2014).
-
Association of Plastic Recyclers. Model Bale Specifications, https://plasticsrecycling.org/tools-and-resources/recycler-resources/model-bale-specifications/ (accessed 2024).
-
Sidi, H. & Sidey, M. Process for the production and purification of benzoic acid. US Patent 3,816,523 (1974).
-
Rezaei, V. & Sajadi, S. A. A. A strategy for total recovery of residue from terephthalic acid production process. Russ. J. Appl. Chem. 88, 1201–1206 (2015).
-
Edwards, R. C. & Golson, F. A. Process for the recovery of cobalt and manganese from oxidation residue incinerator ash, pyrolysis sand and pyrolysis char. US Patent 4,546,202 (1985).
-
Weaver, C.W. Purification of benzoic acid. US Patent 3,235,588 (1966).
-
de Oliveira, C. T., Luna, M. M. M. & Campos, L. M. S. Understanding the Brazilian expanded polystyrene supply chain and its reverse logistics towards circular economy. J. Clean. Prod. 235, 562–573 (2019).
-
Green Marketing Company. Densification and recycling of post consumer polystyrene (PS #6) packaging in Ontario municipalities (Waste Diversion Ontario, Continuous Improvement Fund Office, 2010).
-
Gausmann, M. et al. Recovery of succinic acid by integrated multi-phase electrochemical pH-shift extraction and crystallization. Sep. Purif. Technol. 240, 116489 (2020).
-
Mokwatlo, S. C. et al. Bioprocess development and scale-up for cis,cis-muconic acid production from glucose and xylose by Pseudomonas putida. Green. Chem. 26, 10152–10167 (2024).
-
Muazu, R. I., Rothman, R. & Maltby, L. Integrating life cycle assessment and environmental risk assessment: a critical review. J. Clean. Prod. 293, 126120 (2021).
-
United States Environmental Protection Agency. TRI program – Basic search, https://guideme.epa.gov/ords/guideme_ext/f?p=guideme:chemical-list-basic-search (accessed 2024).
-
Bartos, T. M. & Peterson, D. A. Process and apparatus for manufacturing aromatic carboxylic acids. US Patent 9,428,436 (2016).
-
United States Environmental Protection Agency. EasyRSEI Dashboard version 2.3.12 https://edap.epa.gov/public/extensions/EasyRSEI/EasyRSEI.html (accessed 2025).
-
Johnson, C. W. et al. Enhancing muconic acid production from glucose and lignin-derived aromatic compounds via increased protocatechuate decarboxylase activity. Metab. Eng. Commun. 3, 111–119 (2016).
-
Jeng, L., Balke, S., Mourey, T., Wheeler, L. & Romeo, P. Evaluation of light-scattering detectors for size exclusion chromatography. I. Instrument precision and accuracy. J. Appl. Polym. Sci. 49, 1359–1374 (1993).
-
Humbird, D. et al. Process design and economics for biochemical conversion of lignocellulosic biomass to ethanol: dilute-acid pretreatment and enzymatic hydrolysis of corn stover. (National Renewable Energy Lab, 2011).
Acknowledgements
We thank David Moore for the ICP-MS measurement, Stephen H. Dempsey for sharing the NMR method used to assess the purity of PS and muconic acid, Lisa M. Stanley for assisting with muconic acid purification, Jeremy R. Bussard for preparing the setup to measure the temperature of liquid benzoic acid, and Ryan Davis for a detailed review of the manuscript. Funding was provided by the U.S. Department of Energy, Office of Energy Efficiency and Renewable Energy, Advanced Materials and Manufacturing Technologies Office (AMMTO), and Bioenergy Technologies Office (BETO). This work was performed as part of the Bio-Optimized Technologies to keep Thermoplastics out of Landfills and the Environment (BOTTLE) Consortium and was supported by AMMTO and BETO under Contract DE-AC36-08GO28308 with the National Renewable Energy Laboratory (NREL), operated by Alliance for Sustainable Energy, LLC. The BOTTLE Consortium includes members from the University of Wisconsin, Madison.
Ethics declarations
Competing interests
H.M., M.O.K., and G.T.B. are inventors of a provisional patent filed in the US Patent and Trademark Office (USPTO) on October 29, 2024, as a US Patent Application Serial no.: 63/713,394. The other authors declare that they have no other competing interests.
Peer review
Peer review information
Nature Communications thanks Travis J. Williams and the other anonymous reviewers for their contribution to the peer review of this work. A peer review file is available.
Additional information
Publisher’s note Springer Nature remains neutral with regard to jurisdictional claims in published maps and institutional affiliations.
Supplementary information
Source data
Rights and permissions
Open Access This article is licensed under a Creative Commons Attribution-NonCommercial-NoDerivatives 4.0 International License, which permits any non-commercial use, sharing, distribution and reproduction in any medium or format, as long as you give appropriate credit to the original author(s) and the source, provide a link to the Creative Commons licence, and indicate if you modified the licensed material. You do not have permission under this licence to share adapted material derived from this article or parts of it. The images or other third party material in this article are included in the article’s Creative Commons licence, unless indicated otherwise in a credit line to the material. If material is not included in the article’s Creative Commons licence and your intended use is not permitted by statutory regulation or exceeds the permitted use, you will need to obtain permission directly from the copyright holder. To view a copy of this licence, visit http://creativecommons.org/licenses/by-nc-nd/4.0/.
About this article

Cite this article
Moon, H., DesVeaux, J.S., Van Roijen, E.C. et al. Upcycling waste polystyrene to adipic acid through a hybrid chemical and biological process. Nat Commun 16, 9543 (2025). https://doi.org/10.1038/s41467-025-64561-1
-
Received:
-
Accepted:
-
Published:
-
DOI: https://doi.org/10.1038/s41467-025-64561-1