
Introduction
CHO cells are widely used in the industrial production of therapeutic monoclonal antibodies, and the development of highly productive and reproducible manufacturing processes aimed at large-scale commercial production is ongoing. Currently, production is predominantly based on fed-batch culture in large-scale bioreactors, where productivity exceeding 10 g/L has been achieved1,2,3. Recently, the development of perfusion culture has been promoted as a next-generation manufacturing strategy. Perfusion culture is known for its higher volumetric productivity compared to fed-batch culture, with reports of volumetric productivity exceeding 5 g/L/day4,5.
The optimization of culture medium is a crucial activity in the development of pharmaceutical manufacturing processes. The development of feed medium used in fed-batch culture has commonly used a design of experiment (DoE) approach to optimize medium component concentrations, and numerous successful cases have been reported6,7,8 However, even with the same cell line and culture process, biological variations during cell culture can lead to changes in cell growth and nutrient consumption rate. Additionally, improper concentrations of glucose or specific amino acid can result in the accumulation of metabolic byproducts, leading to a decline in culture performance. Research is accordingly continuing, even following the achievement of high productivity9,10,11. Although media development for perfusion culture is under investigation, the number of reports is limited by the complexity of the culture method itself12,13.
In recent years, numerous studies have focused on in-line process monitoring technologies to improve process performance and reproducibility. Examples include near-infrared spectroscopy, Raman spectroscopy, capacitance spectroscopy, and off-gas sensor14,15,16,17. The use of in-line process monitoring technologies to control feed volumes based on specific indicators is reportedly able to suppress the accumulation of metabolic byproducts during culture, thereby improving productivity18. Among examples, maintenance of a low glucose concentration to prevent lactate accumulation enhances productivity, while reduction in the concentration of specific amino acid can suppress the formation of metabolic byproducts that impair cell culture performance9,11. In-line monitoring technology and feedback control enable more advanced control of such culture methods9. Combining these technologies with a dynamic feeding strategy, which changes the amount of feed added according to the culture conditions, allows for more precise control of the culture environment18. However, to accurately maintain specific concentrations of glucose and amino acid, it is essential not only to supplement the feed according to specific indicators but also to develop feed media that are modified to these indicators.
This study investigated appropriate indicators for controlling feed volume and adjusting amino acid and glucose concentrations. Correlations between viable cell density, amino acid consumption, and glucose consumption were analyzed to identify suitable indicator. Regression models were developed using the indicator to estimate nutrient consumption. The regression models were used to guide feed formulation and feed addition strategies in both fed-batch and perfusion cultures. The effectiveness of the selected indicator for the dynamic feeding strategy was evaluated by comparing the observed nutrient concentration trends with those predicted by the regression model.
Results
Experiments on determining indicator for dynamic feeding strategy
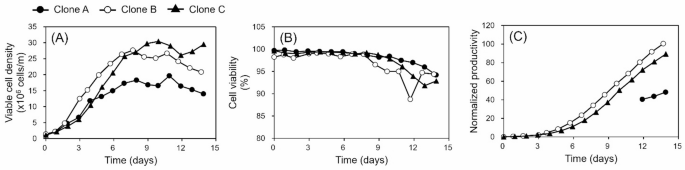
To develop a dynamic feeding strategy based on specific indicator, three cell lines producing different antibodies were cultured in fed-batch mode (Fig. 1). Clone A, clone B and clone C, expressing different recombinant monoclonal antibodies were used. Amino acid and glucose concentrations were measured daily in Clone A, while in Clones B and C, measurements were taken every other day. Amino acid consumption and glucose consumption were calculated from the measured concentration values using equation (Eq. 2).

Viable cell density, cell viability and productivity trends. Clone A, clone B and clone C were cultured by fed-batch culture mode using in-house feed medium. Trends of (A) viable cell density, (B) cell viability, and (C) normalized productivity in the fed-batch cultures of Clone A (filled circle), Clone B (open circle), and Clone C (filled triangle). Productivity is normalized to day 3 productivity of clone B due to confidentiality. Data represent a single culture result (n = 1).
For correlation analysis, 15 of the 20 canonical amino acids were analyzed. Glycine and glutamine were excluded as they were not present in the in-house CD feed medium. Alanine was excluded because it was continuously produced by cellular metabolism during the culture period. Asparagine, although included in the in-house CD feed medium, was excluded because it was depleted in the early phase of culture in all clones. Cysteine was excluded due to the difficulties associated with its analysis. Furthermore, since a decrease in VCD and viability was observed after day 11 of culture, the amino acid and glucose analysis results from day 0 to 11 were used for correlation analysis. A decrease in cell viability observed during the late culture phase was also supported by the increased leakage of lactate dehydrogenase (Supplementary Fig. S1).
Correlations between VCD, amino acid consumption, and glucose consumption were analyzed by multivariate analysis using JMP software (Supplementary Fig. S2, S3 and S4). The results demonstrated a strong correlation between amino acid and glucose consumption and VCD in the three clones, which exhibited different culture performance (Supplementary Table S1).
For Clone A, a regression model was established through regression analysis to predict amino acid and glucose consumption based on VCD. The models predicting amino acid and glucose consumption from VCD were established based on equation (Eq. 3). Amino acid and glucose consumption were expressed as linear equations with viable cell density as the explanatory variable (Supplementary Table S2).
Evaluation of regression models under the fed batch culture condition
Clone A was used to evaluate the suitability of VCD as an indicator for implementing a dynamic feeding strategy in fed-batch culture. To apply a VCD-guided dynamic feeding strategy, the concentrations of amino acid and glucose in the in-house CD feed medium were adjusted based on the equation (Eq. 5) and the regression model (Supplementary Table S2).
The allowance zone of nutrient concentrations during the culture period was defined as within ± 50% of the amino acid and glucose concentrations measured on the second day of culture. The adjustments of amino acid and glucose in the in-house CD feed medium were designed to maintain the nutrient concentration within the allowance zone.
A fed-batch culture applying the VCD-guided dynamic feeding strategy using the modified in-house CD feed medium was conducted, and the actual trends in nutrient concentrations were monitored and compared with the predicted values.
Analysis of the culture medium revealed that, aside from aspartic acid, serine, and glutamic acid, the actual trend of concentrations of nutrients closely matched those predicted trend by the regression model (Fig. 2). Moreover, compared to the culture method using a constant feed rate, the VCD-guided dynamic feeding strategy suppressed accumulation or depletion of nutrients, resulting in more stable nutrient levels throughout the culture period (Fig. 2). The introduction of the VCD-guided dynamic feeding strategy maintained cell proliferation and viability trends comparable to those under constant feed rate conditions, indicating its potential to enhance productivity (Fig. 3).

Amino acid and glucose trends. Clone A was cultured by fed-batch culture mode using in-house feed medium and modified in-house feed medium. In-house feed medium was added to cell culture with constant feed rate per day. Modified in-house feed medium was added to cell culture with dynamic feed rate guided by VCD. Actual concentration of amino acid and glucose in fed-batch culture with a constant feed rate (filled triangle), actual concentration of amino acid and glucose in fed-batch culture with a dynamic feeding strategy guided by viable cell density (filled circle), and predicted concentration of fed-batch culture with a dynamic feeding strategy guided by viable cell density (open circle). Amino acid and glucose concentrations are normalized to their day 2 concentrations due to confidentiality. Data represent a single culture result (n = 1).

Viable cell density, cell viability and productivity trends. Clone A was cultured by fed-batch culture mode using in-house feed medium and modified in-house feed medium. In-house feed medium was added to cell culture with constant feed rate per day. Modified in-house feed medium was added to cell culture with dynamic feed rate guided by VCD. Trends of (A) viable cell density, (B) cell viability, (C) normalized productivity, (D) osmolarity and (E) ammonia concentration in the fed-batch culture with a constant feed rate (filled triangle) and fed-batch culture with a dynamic feeding strategy guided by viable cell density (filled circle). Productivity is normalized to day 3 productivity due to confidentiality. Data represent a single culture result (n = 1).
Evaluation of regression models under the perfusion culture condition
Clone A was used to evaluate the suitability of VCD as an indicator for implementing a dynamic feeding strategy in perfusion culture. To apply a VCD-guided dynamic feeding strategy, the concentrations of amino acid and glucose in the feed medium were adjusted based on the equation (Eq. 6) and the regression model (Supplementary Table S2).
These adjustments were made under the assumption that bleeding had been initiated and the VCD was maintained at 1.0 × 10⁸ cells/mL. And also, these adjustments were designed to maintain the concentrations of amino acid and glucose in the culture medium within ± 50% of their respective values of the second day of culture.
Bleeding was continued from day 7 of culture, when the VCD reached 1.0 × 10⁸ cells/mL, until the end of culture. The in-house CD feed medium formulated for fed-batch culture was used until day 11, after which it was replaced with modified in-house CD feed medium for perfusion culture. The in-house CD feed medium formulated for fed-batch culture was fed with constant feed rate, and the modified in-house CD feed medium was fed by applying the VCD-guided dynamic feeding strategy. The actual trends in nutrient concentrations were monitored and compared with the predicted values.
Analysis of the culture medium revealed that, aside from aspartic acid, glutamic acid, and glucose, the actual trend of concentrations of nutrients closely matched those predicted trend by the regression model (Fig. 4). Moreover, compared to the culture method using a constant feed rate, the VCD-guided dynamic feeding strategy resulted in more stable nutrient levels throughout the culture period (Fig. 4).

Amino acid and glucose trends. Clone A was cultured by perfusion culture mode using in-house feed medium and modified in-house feed medium. In-house feed medium was added to cell culture with constant feed rate per day from day 2 to day 10. Modified in-house feed medium was added to cell culture with dynamic feed rate guided by VCD from day 11 to day 13. Actual concentration of amino acid and glucose in perfusion culture (filled circle), and predicted concentration of glucose and amino acid in perfusion culture (open circle). The dashed line indicates day 11 of culture, when dynamic feeding guided by viable cell density was started. Amino acid and glucose concentrations are normalized to their day 2 concentrations due to confidentiality. Data represent a single culture result (n = 1).
The in-house CD feed medium designed for fed-batch culture was used from day 4 to 10, and the modified in-house CD feed medium was introduced from day 11 to 14, applying the VCD-guided dynamic feeding strategy. A comparison of productivity between the two periods indicated that the introduction of the VCD-guided dynamic feeding strategy potential to enhance productivity (Fig. 5).

Viable cell density, cell viability and productivity trends. Clone A was cultured by perfusion culture mode using in-house feed medium and modified in-house feed medium. In-house feed medium was added to cell culture with constant feed rate per day from day 2 to day 10. Modified in-house feed medium was added to cell culture with dynamic feed rate guided by VCD from day 11 to day 13. Trends of (A) viable cell density, (B) cell viability, (C) normalized productivity, (D) osmolarity and (E) ammonia concentration in the perfusion culture. The dashed line indicates day 11 of culture, when dynamic feeding guided by viable cell density was started. Productivity is normalized to day 3 productivity due to confidentiality. Data represent a single culture result (n = 1).
Discussion
In the production of therapeutic antibodies using CHO cells, it is well known that differences in the culture environment influence culture performance, including cell proliferation, productivity, and product quality19,20. Therefore, maintaining a well-controlled culture environment throughout the cultivation period is essential. In particular, for perfusion culture, where antibodies are continuously produced over extended periods, it is critical to maintain the culture environment in a steady state. The combination of in-line process monitoring technologies and feedback control is widely utilized to achieve such environmental control9,18. However, the number of parameters that can be directly monitored by in-line sensors is limited. In cases where advanced modeling and cross-scale model transferability are required, the complexity of implementation increases. Therefore, a simplified method is needed to efficiently manage numerous components in the culture medium using a limited number of measurable indicators. Based on this consideration, the present study aimed to develop a dynamic feeding strategy guided by specific measurable indicators.
Indicators for the dynamic feeding strategy were selected from parameters that can be measured in-line or on-line, under the assumption that monitoring and feedback control would be applied. To manage amino acids and glucose during culture, parameters with a strong correlation to their consumption were explored across three CHO cell clones with different characteristics. VCD was identified as a highly correlated and suitable indicator.
To evaluate whether VCD can serve as an effective indicator for adjusting feed volume in both fed-batch and perfusion cultures, a VCD-guided dynamic feeding strategy was implemented in both culture modes. Two main aspects were evaluated. First, the concentrations and fluctuations of amino acids and glucose in the culture medium were assessed. Under the VCD-guided dynamic feeding strategy, both feed composition and feed volume were adjusted to maintain amino acid and glucose concentrations within a consistent range. The average concentrations and standard deviations of each component during culture were calculated for evaluation. Second, the difference between predicted concentrations derived from the consumption models and the actual measured concentrations of amino acids and glucose in the culture medium was assessed.
In this study, the feed medium was modified to maintain the concentrations of amino acids and glucose in the culture medium within ± 50% of their respective values on the second day of culture. Day 2 was selected as the normalization set point because it corresponds to the start of feeding in our platform process, marking the transition from the adaptation phase to the nutrient-controlled growth phase. Although this choice is process-specific, the VCD-guided dynamic feeding approach can also be applied to explore an optimal set point based on objective criteria such as specific growth rate or nutrient uptake stability. The feed composition was adjusted to maintain standardized nutrient concentrations within the range of 0.50 to 1.50. The difference between predicted and actual values was calculated, and a deviation of 0.25 or less was defined as the acceptable threshold, corresponding to half the width of the target concentration range.
In fed-batch culture, the VCD-guided dynamic feeding strategy demonstrated improved control of nutrient concentration fluctuations compared to the constant feed rate approach (Supplementary Table S3). For 13 amino acids and glucose, the average deviation between predicted and actual concentrations was within 0.25, indicating good predictive accuracy (Supplementary Table S3). Although this strategy successfully stabilized nutrient concentrations and reduced osmolality, no marked improvement in VCD, viability, or titer was observed. This may be because nutrient concentrations and osmolality under the constant feeding condition were already maintained within a non-limiting range for cell growth and productivity, leaving limited room for further enhancement. Therefore, this study should be interpreted as a proof-of-concept demonstration rather than an optimization of productivity.
In perfusion culture, the VCD-guided dynamic feeding strategy also demonstrated improved control of nutrient concentration fluctuations compared to the constant feed rate approach (Supplementary Table S4). For 11 amino acids, the average deviation between predicted and measured concentrations was within 0.25, indicating good predictive accuracy (Supplementary Table S4). In this culture mode, the dynamic feeding strategy was intentionally introduced on day 11 after the system reached a steady state (day 7–10) to evaluate the impact of switching from constant to dynamic feeding under stable conditions. This transition allowed comparison of metabolic behavior before and after the switch. Amino acid fluctuations were reduced, and osmolality tended to decrease after the transition. However, similar to the fed-batch culture, the constant feeding condition may have already maintained appropriate nutrient levels, which could explain why no significant improvement in productivity was observed.
These results demonstrate that VCD can be used as a practical and effective indicator for determining feed volume in both fed-batch and perfusion cultures. On the other hand, the actual concentration trends of several amino acids deviated from the predicted trends. In this study, the regression model was developed under conditions in which asparagine was depleted. In CHO cells using the GS expression system, it has been reported that the consumption of aspartate, serine, and glutamic acid is affected by the availability of asparagine21. Therefore, it is presumed that the deviation of the actual concentrations of aspartate, serine, and glutamic acid from the predicted values was due to the development of the regression model under asparagine-depleted conditions. These findings highlight the necessity of developing the regression model under conditions in which amino acids are not depleted to achieve more accurate predictions of their concentrations.
Furthermore, at very high VCDs (above approximately 1.5 × 10⁸ cells/mL), the correlations between VCD and nutrient concentrations tended to weaken, particularly for Clones B and C. This was likely influenced by the metabolic shift associated with decreased viability during the late culture phase and by the reduced sampling frequency (every other day), which limited temporal resolution. To construct a more accurate and broadly applicable model, it would be beneficial to use data obtained from cultures that maintained high cell viability, thereby minimizing the influence of metabolic shifts. Such refinements could extend the applicability of the dynamic feeding model to higher cell density ranges.
The VCD-guided dynamic feeding strategy enables the maintenance of multiple amino acids and glucose at target concentrations. Since the accumulation of amino acids and glucose is known to induce the production of metabolic byproducts that negatively impact productivity, this strategy is expected to contribute to improved culture performance22,23. Additionally, applying this strategy to perfusion culture allows for the development of feed media and process conditions based on data obtained from fed-batch culture, potentially reducing the time required for process optimization. Moreover, the flexible and self-adjusting nature of the VCD-guided approach enhances process robustness by compensating for transient deviations in cell density caused by bleeding operations in perfusion.
Materials and methods
Cells lines and media
Three CHO cell lines, clone A, clone B and clone C, expressing different recombinant monoclonal antibodies were used. The cell lines were generated from the CHOK1SV® host cell line (Lonza Biologics, UK) using the GS Gene Expression System® (GS-CHO system). In this study, fully in-house chemically defined (CD) basal and feed media were used for all cell lines.
Fed-Batch culture for determining indicator for dynamic feeding strategy
3 L Bioreactors (ABLE/Biot, Japan) were inoculated at a target cell density of 1.0 × 10⁶ cells/mL. Cell cultures were conducted with the set points for dissolved oxygen (DO), upper dead band pH, lower dead band pH, and temperature set at 44% air saturation, 7.30, 6.70, and 36.5 °C, respectively. Feeding was conducted using in-house CD feed medium to provide sufficient nutrients to the cells. Feeding of in-house CD feed medium was conducted daily from day 2 until the one day before the end of the culture. In-house CD feed medium was added with constant feed rate per day (3.5 w/w%).
Calculation of amino acid and glucose consumption
Culture volume after feeding, accounting for the solid content of the cells, was calculated using Eq. 1 (Eq. 1). Briefly, VT, VC, VF, VG, VA, S and Ct represent culture volume after feeding, culture volume at the time of sampling, feed volume, glucose addition volume, antifoam addition volume, solid volume per cell, and VCD at the time of sampling, respectively. Solid volume per cell was established based on experimental data.
$$:{text{V}}_{text{T}}={left(1-text{S}{text{C}}_{text{t}}right)text{V}}_{text{C}}+{text{V}}_{text{F}}+{text{V}}_{text{G}}+{text{V}}_{text{A}}$$
(1)
Amino acid and glucose consumption were calculated using Eq. 2 (Eq. 2). Briefly, ΔA, At, and F represent the amino acid or glucose consumption, amino acid or glucose concentration at the time of sampling, and amino acid or glucose concentration in the feed, respectively. t denotes time (in days), with t + 1 corresponding to one day after t, and t + 2 corresponding to two days after t.
$$:varDelta:text{A}=frac{{text{A}}_{text{t}}{left(1-{text{S}text{C}}_{text{t}}right)text{V}}_{text{C}}+text{F}{text{V}}_{text{F}}}{{text{V}}_{text{T}}}-{text{A}}_{text{t}+1:text{o}text{r}:text{t}+2}$$
(2)
Multivariate correlation analysis and regression analysis
Multivariate analysis and regression analysis were conducted using JMP software (SAS, USA). In the regression analysis, amino acid and glucose consumption were fitted to a linear regression model using VCD as variable, resulting in Eq. 3 (Eq. 3). Briefly, Yt, Xt, a and b represent amino acid or glucose consumption per day, VCD, coefficient, and constant, respectively.
$$:{text{Y}}_{text{t}}=text{a}{text{X}}_{text{t}}+text{b}$$
(3)
Adjustment of dynamic feeding volume and glucose and amino acid concentration in feed media
The feed volume, based on VCD, was represented by Eq. 4 (Eq. 4). Briefly, VF’ and c represent feed volume determined based on VCD, and coefficient, respectively.
$$:{{text{V}}_{text{F}}}^{{prime:}}=text{c}{text{X}}_{text{t}}{text{V}}_{text{C}}$$
(4)
To adjust the amino acid and glucose concentrations in the feed media, the predicted amino acid and glucose concentrations in the culture medium were calculated using Eq. 5 (Eq. 5) for fed-batch culture and Eq. 6 (Eq. 6) for perfusion culture. Briefly, At’, F’, B and VB represent the predicted amino acid or glucose concentration, the adjusted amino acid or glucose concentration, the amino acid or glucose concentration of basal medium, and the added basal medium volume, respectively.
$$:{{A}_{t+1}}^{{prime:}}=frac{{{A}_{t}}^{{prime:}}{left(1-{text{S}text{C}}_{text{t}}right)text{V}}_{text{C}}+{text{F}}^{{prime:}}{{text{V}}_{text{F}}}^{{prime:}}}{{text{V}}_{text{T}}}-{text{Y}}_{text{t}}$$
(5)
$$:{{A}_{t+1}}^{{prime:}}=frac{{{A}_{t}}^{{prime:}}left(1-text{S}{text{C}}_{text{t}}right){text{V}}_{text{C}}+{text{F}}^{{prime:}}{{text{V}}_{text{F}}}^{{prime:}}+text{B}{text{V}}_{text{B}}}{{text{V}}_{text{T}}+{text{V}}_{text{B}}}-{text{Y}}_{text{t}}$$
(6)
To maintain the amino acid and glucose concentrations at the expected levels throughout the culture period, the values of F′ in Eqs. 5 and 6 were determined. In this study, the glucose and amino acid concentrations in the feed medium were adjusted based on the assumed VCD for fed-batch and perfusion cultures. For fed batch-culture, the VCD under the culture conditions using the in-house feed medium before adjusting the glucose and amino acid concentrations was used. For perfusion cultures, the VCD was assumed to be maintained at 1.0 × 10⁸ cells/mL. Based on this assumption, simulations were performed to determine c and F’, ensuring that amino acid and glucose concentrations remained within the allowance zone throughout the culture period.
The feed composition adjustment (F′) was determined once by simulation before the start of the dynamic feeding phase. Based on this simulation, a single modified feed medium was prepared for each condition and used throughout the entire dynamic feeding period. During the culture, only the feed volume was dynamically adjusted according to the VCD-guided strategy, while the feed composition remained constant.
Fed-Batch culture for evaluation of regression models
125 mL shake flasks were inoculated at a target cell density of 1.0 × 10⁶ cells/mL. Shake flasks were placed in a 140 rpm, 36.5 °C, 5.0% CO2 incubator shaker. Feeding was conducted using in-house CD feed medium and modified in-house CD feed medium. Feeding of in-house CD feed and modified in-house CD feed media was performed daily from day 2 until the one day before the end of the culture. In-house CD feed medium was added with constant feed rate per day (3.5 w/w%). Modified in-house CD feed medium was added with dynamic feed rate guided by VCD.
Phenylalanine was excluded from the feed composition adjustment because its concentration could not be sufficiently reduced when using the in-house premixed feed powder. The premix contains not only amino acids but also vitamins and trace metals that influence cell growth. Reducing the amount of premix to lower phenylalanine levels would have undesirably decreased the concentrations of these essential components. Therefore, the amount of premixed powder used was maintained to ensure balanced micronutrient levels, resulting in phenylalanine being excluded from the adjustment.
Perfusion culture for evaluation of regression models
A 3 L Bioreactor equipped with Alternating Tangential Flow XCell perfusion filters (Repligen, USA) was inoculated at a target cell density of 1.0 × 10⁶ cells/mL. Cell cultures were conducted with the set points for DO, upper dead band pH, lower dead band pH, and temperature set at 44% air saturation, 7.30, 6.70, and 36.5 °C, respectively. Perfusion was initiated on day 1 at 1.0 volume vessel per day (VVD). The perfusion rate was then increased to 2.0 VVD on day 4. Feeding of in-house CD feed media and modified in-house CD feed media was performed daily from day 4 until the end of culture. In-house CD feed medium was added with constant feed rate per day (8.6 w/w% on day 4 and 25.7 w/w% from day 5 to day 10). Modified in-house CD feed medium was added with dynamic feed rate guided by VCD from day 11 to day 13. The feed volume per day was divided into 12 portions, and one portion was added every 2 h each day. When the viable cell concentration reached approximately 1.0 × 10⁸ cells/mL, as a cell bleeding, the cell culture medium was discarded, and fresh in-house CD basal medium was added once a day to maintain a VCD of 1.0 × 10⁸ cells/mL. Dynamic feeding was introduced from day 11 after the system reached a steady state (day 7–10), allowing direct comparison of metabolic and nutrient profiles before and after the transition from constant to dynamic feeding.
Glutamic acid was excluded from the feed composition adjustment because its concentration could not be sufficiently reduced when using the in-house premixed feed powder. The same premixed powder was used as in the fed-batch culture, and it contained amino acids, vitamins, and trace metals essential for cell growth. Therefore, the amount of premixed powder could not be further decreased without affecting other micronutrients. In addition, because the perfusion system continuously replaced the basal medium, which already contained a high concentration of glutamate, the target concentration reduction predicted by simulation could not be achieved. For these reasons, glutamate was excluded from the feed composition adjustment in the perfusion culture.
Cell count and glucose concentration measurement
VCD and cell viability were measured using a ViCell-XR (Beckman Coulter, USA) with the trypan blue exclusion method. Glucose concentration was measured using a BioProfile 400 (Nova Biomedical, USA) or Glucose Analyzer GA05 (A&T, Japan). The concentrations of monoclonal antibody in the culture supernatants were measured using a HPLC system (Agilent Technologies, USA) equipped with a UV detector and a protein A affinity column (Thermo Fisher Scientific, USA).
Amino acid measurement
Amino acid analysis was performed using a Hitachi L-8900 amino acid analyzer (Hitachi High Tech, Japan). Cell culture samples were treated with 15 mM HCl and 2.5% trifluoroacetic acid and incubated at room temperature for 5 min. After centrifugation at 10,000×g at 4 °C for 10 min, the cell culture supernatant was transferred to a microtube containing a 0.22 μm filter and further filtered by centrifugation at 10,000×g at 4 °C for 10 min. The sample was injected into the system, and free amino acids were separated using ion-exchange chromatography with a post-column ninhydrin reaction. Absorbance was recorded at both 570 nm and 440 nm after the reaction with ninhydrin to determine the response factor for individual amino acids and to quantify levels relative to known amino acid standards.
Data availability
The datasets generated and/or analyzed during the current study are not publicly available due to the in-house culture medium used being a trade secret of Astellas Pharma Inc. but are available from the corresponding author on reasonable request.
References
-
Huang, Y. M. et al. Maximizing productivity of CHO cell-based fed-batch culture using chemically defined media conditions and typical manufacturing equipment. Biotechnol. Prog. 26, 1400–1410 (2010).
-
Takagi, Y., Kikuchi, T., Wada, R. & Omasa, T. The enhancement of antibody concentration and achievement of high cell density CHO cell cultivation by adding nucleoside. Cytotechnology 69, 511–521 (2017).
-
Handlogten, M. W. et al. Intracellular response to process optimization and impact on productivity and product aggregates for a high-titer CHO cell process. Biotechnol. Bioeng. 115, 126–138 (2018).
-
Sun, T. et al. Establishment of a semi-continuous scale-down clone screening model for intensified perfusion culture. Biotechnol. Lett. 46, 1085–1093 (2024).
-
Pollard, D., Brower, M. & Richardson, D. Progress toward automated single-use continuous monoclonal antibody manufacturing via the protein refinery operations lab. Continuous Biomanufacturing – Innovative Technol. Methods 4, 107–130 (2017).
-
Torkashvand, F. et al. Designed amino acid feed in improvement of production and quality targets of a therapeutic monoclonal antibody. PLoS One. 10, e0140597 (2015).
-
Rouiller, Y. et al. A high-throughput media design approach for high performance mammalian fed-batch cultures. MAbs 5, 501–511 (2013).
-
Ling, W. L., Bai, Y., Cheng, C., Padawer, I. & Wu, C. Development and manufacturability assessment of chemically-defined medium for the production of protein therapeutics in CHO cells. Biotechnol. Prog. 31, 1163–1171 (2015).
-
Gagnon, M. et al. High-end pH-controlled delivery of glucose effectively suppresses lactate accumulation in CHO fed-batch cultures. Biotechnol. Bioeng. 108, 1328–1337 (2011).
-
Mulukutla, B. C., Kale, J., Kalomeris, T., Jacobs, M. & Hiller, G. W. Identification and control of novel growth inhibitors in fed-batch cultures of Chinese hamster ovary cells. Biotechnol. Bioeng. 114, 1779–1790 (2017).
-
Ladiwala, P. et al. Addressing amino acid-derived inhibitory metabolites and enhancing CHO cell culture performance through DOE-guided media modifications. Biotechnol. Bioeng. 120, 2542–2558 (2023).
-
Schwarz, H., Lee, K., Castan, A. & Chotteau, V. Optimization of medium with perfusion microbioreactors for high density CHO cell cultures at very low renewal rate aided by design of experiments. Biotechnol. Bioeng. 120, 2523–2541 (2023).
-
Lin, H., Leighty, R. W., Godfrey, S. & Wang, S. B. Principles and approach to developing mammalian cell culture media for high cell density perfusion process leveraging established fed-batch media. Biotechnol. Prog. 33, 891–901 (2017).
-
Arnold, S. A., Crowley, J., Woods, N., Harvey, L. M. & McNeil, B. In-situ near infrared spectroscopy to monitor key analytes in mammalian cell cultivation. Biotechnol. Bioeng. 84, 13–19 (2003).
-
Tanemura, H. et al. Comprehensive modeling of cell culture profile using Raman spectroscopy and machine learning. Sci. Rep. 13, 21805 (2023).
-
Wallocha, T. & Popp, O. Off-Gas-Based soft sensor for Real-Time monitoring of biomass and metabolism in Chinese hamster ovary cell continuous processes in Single-Use bioreactors. Processes 9, 2073 (2021).
-
Rittershaus, E. S. C. et al. N-1 perfusion platform development using a capacitance probe for biomanufacturing. Bioeng. (Basel). 9, 128 (2022).
-
Domján, J. et al. Raman-based dynamic feeding strategies using real-time glucose concentration monitoring system during adalimumab producing CHO cell cultivation. Biotechnol. Prog. 36, e3052 (2020).
-
Badsha, M. B., Kurata, H., Onitsuka, M., Oga, T. & Omasa, T. Metabolic analysis of antibody producing Chinese hamster ovary cell culture under different stresses conditions. J. Biosci. Bioeng. 122, 117–124 (2016).
-
Qin, J. et al. The effect of hyperosmolality application time on production, quality, and biopotency of monoclonal antibodies produced in CHO cell fed-batch and perfusion cultures. Appl. Microbiol. Biotechnol. 103, 1217–1229 (2019).
-
Duarte, T. M. et al. Metabolic responses of CHO cells to limitation of key amino acids. Biotechnol. Bioeng. 111, 2095–2106 (2014).
-
Zhang, X., Jiang, R., Lin, H. & Xu, S. Feeding Tricarboxylic acid cycle intermediates improves lactate consumption and antibody production in Chinese hamster ovary cell cultures. Biotechnol. Prog. 36, e2975 (2020).
-
Chitwood, D. G. et al. Characterization of metabolic responses, genetic variations, and microsatellite instability in ammonia-stressed CHO cells grown in fed-batch cultures. BMC Biotechnol. 21, 4 (2021).
Funding
This study was funded by Astellas Pharma Inc.
Ethics declarations
Competing interests
The authors declare no competing interests.
Additional information
Publisher’s note
Springer Nature remains neutral with regard to jurisdictional claims in published maps and institutional affiliations.
Supplementary Information
Rights and permissions
Open Access This article is licensed under a Creative Commons Attribution-NonCommercial-NoDerivatives 4.0 International License, which permits any non-commercial use, sharing, distribution and reproduction in any medium or format, as long as you give appropriate credit to the original author(s) and the source, provide a link to the Creative Commons licence, and indicate if you modified the licensed material. You do not have permission under this licence to share adapted material derived from this article or parts of it. The images or other third party material in this article are included in the article’s Creative Commons licence, unless indicated otherwise in a credit line to the material. If material is not included in the article’s Creative Commons licence and your intended use is not permitted by statutory regulation or exceeds the permitted use, you will need to obtain permission directly from the copyright holder. To view a copy of this licence, visit http://creativecommons.org/licenses/by-nc-nd/4.0/.
About this article

Cite this article
Kikuchi, T., Ohira, S. & Yamaguchi, H. Viable cell density as an indicator for dynamic feeding strategy in fed-batch and perfusion CHO cell culture. Sci Rep 15, 44714 (2025). https://doi.org/10.1038/s41598-025-28316-8
-
Received:
-
Accepted:
-
Published:
-
Version of record:
-
DOI: https://doi.org/10.1038/s41598-025-28316-8